
The surge of women in the workforce

Archived Content
Information identified as archived is provided for reference, research or recordkeeping purposes. It is not subject to the Government of Canada Web Standards and has not been altered or updated since it was archived. Please "contact us" to request a format other than those available.

The Canadian labour market has seen remarkable changes since the 1950s.
Computer-based technologies have helped automate workplaces. Globalization and the economic emergence of countries such as China and India have increased the volume of international trade and reshaped entire industries. The percentage of workers employed in unionized jobs, manufacturing jobs, or jobs covered by employer-sponsored pension plans has fallen. At the same time, Canadian workers have more formal education than workers in the 1950s.
One of the most substantial changes to the Canadian labour market is the participation, en masse, of women. Over the second half of the 20th century, women became far more involved in the workforce than ever before.
The labour force participation rate of women rises steadily from the 1950s to 1990
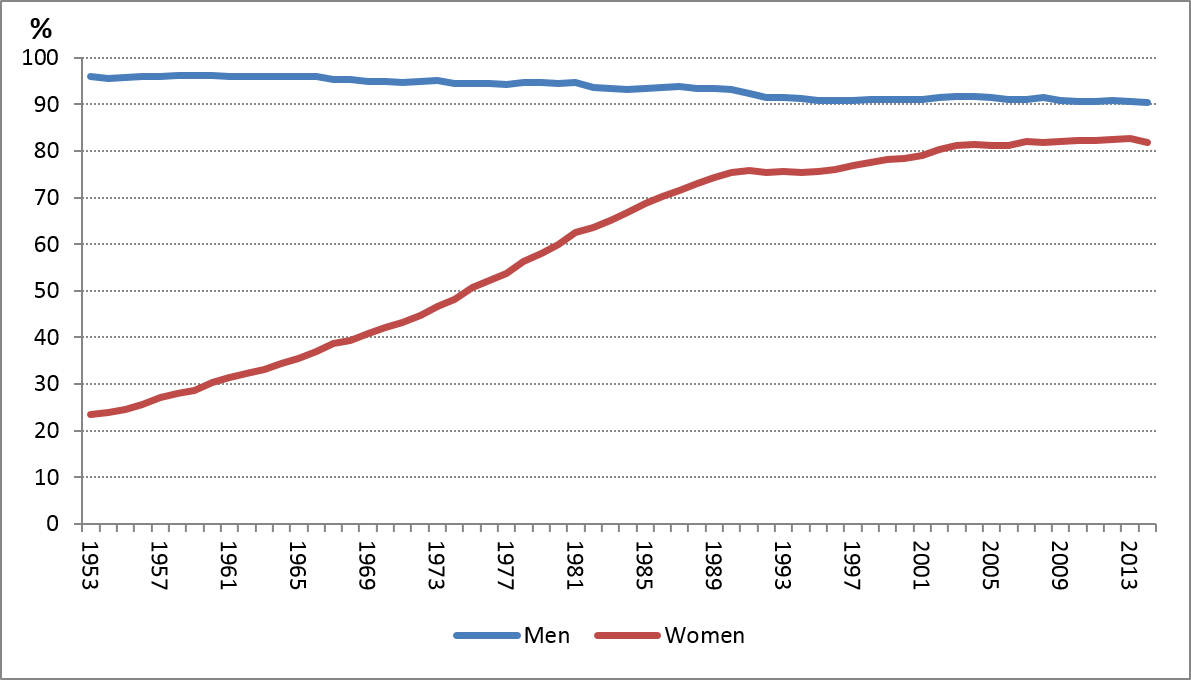
In the early 1950s, about one-quarter of women aged 25 to 54 participated in the labour market, that is, they had a job or were looking for one. In contrast, virtually every man in the same age group was participating in the labour market during this period.
However, women began increasing their presence in the labour market as social norms regarding gender roles evolved, new technologies such as electrical appliances reduced the time needed to perform household chores, families had fewer children and employment opportunities in the service sector increased.
From 1953 to 1990, the labour force participation rate for women grew steadily, rising from about 24% in 1953 to 76% in 1990. Meanwhile, the participation rate for men edged down from 96% in 1953 to 93% in 1990.
Women's involvement in the labour force has risen at a slower pace since 1990
The early 1990s marked the beginning of a slowdown in the growth of women's labour market participation. While their participation rate grew by 1.4 percentage points each year on average from 1953 to 1990, it has since grown by 0.3 percentage points each year on average.
As a result, the labour force participation rate of women reached 82% in 2014 compared with 91% for men.
Overall, the difference in the labour market participation rate between men and women narrowed from more than 70 percentage points in the early 1950s to less than 10 percentage points today. By 2014, women made up almost half (47%) of the entire Canadian workforce.
Chart 1: Labour force participation rates of men and women aged 25 to 54, 1953 to 2014
Description for Chart 1
| Year | Men | Women |
|---|---|---|
| 1953 | 95.9 | 23.5 |
| 1954 | 95.6 | 23.8 |
| 1955 | 95.8 | 24.5 |
| 1956 | 96.0 | 25.7 |
| 1957 | 96.1 | 27.1 |
| 1958 | 96.2 | 27.9 |
| 1959 | 96.2 | 28.7 |
| 1960 | 96.2 | 30.3 |
| 1961 | 96.0 | 31.4 |
| 1962 | 95.9 | 32.2 |
| 1963 | 96.0 | 33.2 |
| 1964 | 96.0 | 34.5 |
| 1965 | 95.9 | 35.5 |
| 1966 | 95.9 | 37.0 |
| 1967 | 95.4 | 38.6 |
| 1968 | 95.3 | 39.5 |
| 1969 | 95.0 | 40.8 |
| 1970 | 94.9 | 42.1 |
| 1971 | 94.7 | 43.3 |
| 1972 | 95.0 | 44.8 |
| 1973 | 95.1 | 46.6 |
| 1974 | 94.5 | 48.2 |
| 1975 | 94.5 | 50.7 |
| 1976 | 94.5 | 52.3 |
| 1977 | 94.3 | 53.7 |
| 1978 | 94.6 | 56.2 |
| 1979 | 94.7 | 58.0 |
| 1980 | 94.5 | 60.0 |
| 1981 | 94.6 | 62.6 |
| 1982 | 93.6 | 63.5 |
| 1983 | 93.5 | 65.2 |
| 1984 | 93.3 | 66.8 |
| 1985 | 93.5 | 68.7 |
| 1986 | 93.6 | 70.2 |
| 1987 | 93.8 | 71.5 |
| 1988 | 93.5 | 73.1 |
| 1989 | 93.5 | 74.4 |
| 1990 | 93.1 | 75.5 |
| 1991 | 92.4 | 75.9 |
| 1992 | 91.4 | 75.3 |
| 1993 | 91.4 | 75.7 |
| 1994 | 91.2 | 75.4 |
| 1995 | 90.9 | 75.7 |
| 1996 | 90.8 | 76.0 |
| 1997 | 90.9 | 76.9 |
| 1998 | 91.1 | 77.6 |
| 1999 | 91.1 | 78.2 |
| 2000 | 91.0 | 78.5 |
| 2001 | 91.1 | 79.1 |
| 2002 | 91.5 | 80.4 |
| 2003 | 91.6 | 81.1 |
| 2004 | 91.6 | 81.5 |
| 2005 | 91.5 | 81.1 |
| 2006 | 91.1 | 81.2 |
| 2007 | 91.1 | 82.1 |
| 2008 | 91.5 | 81.9 |
| 2009 | 90.8 | 82.1 |
| 2010 | 90.6 | 82.3 |
| 2011 | 90.7 | 82.2 |
| 2012 | 90.8 | 82.5 |
| 2013 | 90.7 | 82.7 |
| 2014 | 90.5 | 81.9 |
Higher participation, higher earnings
The increasing presence of women in the labour market led to a large rise in the median annual wages and salaries of women. Women's earnings more than doubled between the mid-1960s and the early 2010s, rising from $15,700 in 1965 to $37,200 in 2010 (in 2014 dollars).
This increase can be partially explained by two other trends: a growing share of women working full time on a full-year basis, and a growing share of women employed in relatively well-paid occupations.
For example, while very few, if any, women were employed as financial auditors and accountants in the early 1950s, women aged 25 to 54 accounted for over half (58%) of the workforce in this occupational group in 2014.
Definition
Labour force participation rate: Total labour force expressed as a percentage of the population aged 15 and over. The participation rate for a particular group (age, sex, marital status, geographic area, etc.) is the total labour force in that group expressed as a percentage of the population 15 years of age and over in that group.
References
Ferrao, V. 2010. Paid work. Women in Canada: A Gender-Based Statistical Report. Sixth edition. Statistics Canada. Catalogue 89-503X.
Goldin, C. 2006. "The Quiet Revolution That Transformed Women's Employment, Education, and Family." American Economic Review. Vol. 96, No. 2, 1-21.
Contact information
To enquire about the concepts, methods or data quality of this release, contact René Morissette (613-951-3608), Social Analysis and Modelling Division.
- Date modified: