Section 3 Workplace performance

Archived Content
Information identified as archived is provided for reference, research or recordkeeping purposes. It is not subject to the Government of Canada Web Standards and has not been altered or updated since it was archived. Please "contact us" to request a format other than those available.
This section focuses primarily on workplace performance measures based on employers' perceptions of labour productivity, sales growth, product quality, customer satisfaction and profitability improvements.
3.1 Performance indicators
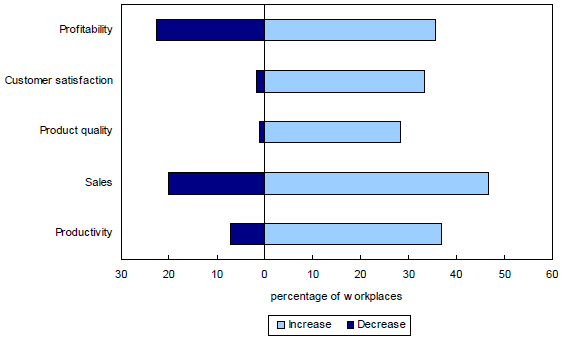
In the WES, workplaces were asked to state how their performance in productivity, sales, product quality, customer satisfaction and profitability improved between April 1, 2004, and March 31, 2005. Generally, workplaces reported improved performance during the year across all indicators, with sales growth being the highest (44.0%) and product quality (30.0%) the lowest.
Information and cultural industries outperformed all other industries on improvement in product quality and customer satisfaction. Finance and insurance outperformed all other industries on improvement in sales growth and profitability. As workplaces increased in size, so did the proportion of workplaces reporting improved productivity, product quality and customer satisfaction.
Table 3.1 Performance indicators, 2005
Chart 3.1
Change in selected performance indicators, 2005
Source: Statistics Canada, Workplace and Employee Survey, Workplace component.
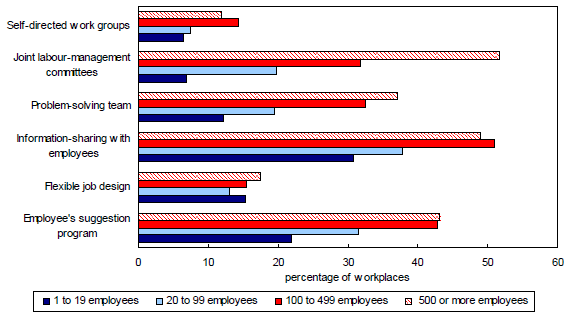
In 2005, employers with over 10 employees were asked which of the following work practices existed on a formal basis for non-managerial employees.
- Employees' suggestion program: includes employee survey feedback
- Flexible job design: include job rotation, job enrichment/redesign (broadened job definitions), job enrichment (increased skills, variety or autonomy of work).
- Information sharing with employees: For example, with respect to firm's performance, colleagues' wages, technological or organizational changes, etc. This implies that employees can provide feedback on policies.
- Problem-solving teams: Responsibilities of teams are limited to specific areas such as quality of work flow (i.e. narrower range of responsibilities than F).
- Joint labour-management committees: Include non-legislated joint labour-management committees and task teams that generally cover a broad range of issues, yet tend to be consultative in nature.
- Self-directed work groups: Semi-autonomous work groups or mini-enterprise work groups that have a high level of responsibility for a wide range of decisions/issues.
Of all work organization practices, information sharing was, as in 2001 and 2003, the most common in 2005, with more than one-third of workplaces reporting having a formal mechanism for sharing information. This would include the sharing of information on the firm's performance, technological or organizational changes. The least common practice was, as in 2001 and 2003, self-directed work groups, used by only 8.0% of the workplaces. Large workplaces (500 or more employees) were far more likely to use every formal work organization practice than smaller ones (less than 20 employees).
As workplaces increased in size, the use of work practices such as employee suggestion programs, problem-solving team and joint labour-management committees also increased.
Table 3.2 Use of innovative work practices, 2005
Chart 3.2
Incidence of high performance work practices, by workplace size, 2005
Source: Statistics Canada, Workplace and Employee Survey, Workplace component.
Workplaces that had implemented innovative work practices had a more positive assessment of their performance. For example, slightly more than half of workplaces that had implemented self-directed work groups reported improvement in product quality compared to one-third for those that had not. (Table 3.3)
This more positive assessment of performance also occurred when workplaces reported the use of innovative work practices and performance pay practices.
Chart 3.3
Selected performance indicators, by use of employee's suggestion programs, 2005
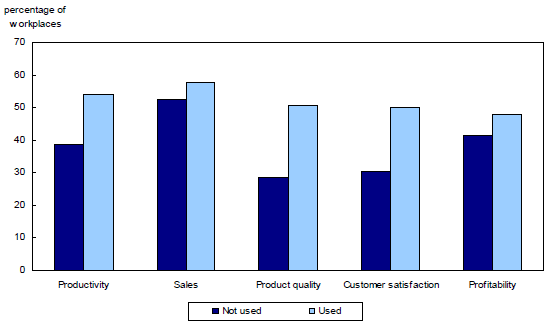
Source: Statistics Canada, Workplace and Employee Survey, Workplace component.
3.3 Hours worked
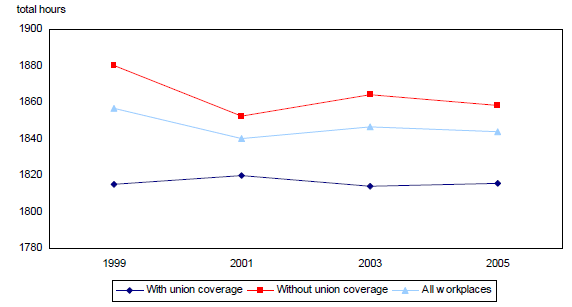
To address the issue of whether the implementation of these innovative work practices created an environment leading to greater effort and greater commitment from workers, we looked at annual hours worked per worker. (Table 3.4)
The number of annual hours worked per worker is presented in relation to various workplace characteristics and outcomes. The estimation procedure used usual or average weekly hours worked. The distribution of annual hours by industry was similar to published data from other comparable sources, although the WES annual hours were slightly higher. No adjustments, however, were made for holidays or vacation days taken by workers or days lost because of labour conflicts.
Overall, the annual number of hours worked per person remained quite stable from 1999 to 2005.
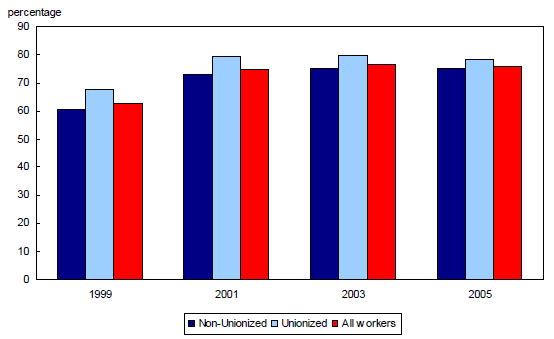
Workers in workplaces that implemented organizational changes, performance pay practices or introduced new products worked more hours than their counterparts in workplaces that have not implemented any of these practices. Where non-wage benefits were provided, the number of hours worked per person was higher. Workers employed in workplaces without collective bargaining agreement coverage worked far more hours than their counterparts employed in workplaces with collective bargaining agreement coverage.
Workers in manufacturing industries consistently worked more hours than their counterparts working in the service industries.
Chart 3.4
Average annual hours worked by union coverage in 1999, 2001, 2003 and 2005
Source: Statistics Canada, Workplace and Employee Survey, Workplace component.
3.4 Employees' satisfaction
Employees were more likely to be very satisfied with their job than with their pay. (Table 3.5) Overall, the WES indicated that about 90.0% of employees were either satisfied or very satisfied with their jobs. However, the proportion fell to around 77.0% when considering pay. Women and young workers tended to be a little less satisfied than other employees with their level of pay.
Managers were more likely to be very satisfied with their jobs than were production workers (48.0% versus 25.0%). Employees who had higher levels of pay also had higher levels of satisfaction with their jobs. The proportion of employees who were very satisfied with their jobs ranged from one quarter at the low end of the pay spectrum to 4 in 10 at the upper end.
Chart 3.5
Job and pay satisfaction by occupation, 2005

Source: Statistics Canada, Workplace and Employee Survey, Workplace component.
The WES gathered annual data on the number of days of paid leave (vacation, sick, parental and other) and unpaid leave taken, as well as the number of days of paid vacation leave workers are entitled to. We now look at these data for 2001, 2003 and 2005 to provide some insights into the effects of employees' paid and unpaid leave on productivity. (Table 3.6)
Over the period 2001 to 2005, 3 out of 4 workers took paid vacation. Over the same period, the average number of unpaid days taken remained in the range of 2 to 3 days. The number of unpaid days taken decreased as hourly wage increased.
More male workers took vacations than their female counterparts. Younger workers (aged 25 years or less), workers in the marketing/sales profession as well as workers with less than high school education were least likely to take annual paid vacation. However, these workers had the highest average amount of unpaid leave.
Workers that were either unionized or covered by a collective bargaining agreement had taken more days of paid vacation than their non-unionized or non-covered by collective bargaining agreement counterparts.
Workers that were dissatisfied with their job took on average 8.5 days of paid and unpaid leave whereas those satisfied with their job took an average of 6 days of paid and unpaid leave.
Chart 3.6
Use of annual vacation by employees, by union status,1999, 2001, 2003 and 2005
Source: Statistics Canada, Workplace and Employee Survey, Workplace component.
- Date modified: