Apprenticeable Occupations and the Employment Downturn in Canada

Archived Content
Information identified as archived is provided for reference, research or recordkeeping purposes. It is not subject to the Government of Canada Web Standards and has not been altered or updated since it was archived. Please "contact us" to request a format other than those available.
Louise Desjardins
Tourism and the Centre for Education Statistics Division
Statistics Canada
Decline between October 2008 and October 2009
Employment changes and demographic characteristics
Employment changes and employment characteristics
Recovery between October 2009 and October 2010
Conclusion
Appendix tables
Between 2000 and 2008, Canada enjoyed steady, rapid employment growth, with an annual growth rate of 2%. Subsequently, as a result of the global economic downturn, Canada's labour market suffered substantial employment losses, particularly in late 2008 and the first few months of 2009.
In this article, Labour Force Survey1 data are used to explore changes in employment in apprenticeable occupations over the 2008 to 2010 period, comparing those changes with those observed in all other occupations combined. Employment is examined from the perspective of selected demographic characteristics, such as age group, level of education and sex, and selected employment characteristics.
In the first half of the decade, between 2000 and 2005, employment grew much faster in apprenticeable occupations than in all other occupations combined (11.1% and 8.8%, respectively). Over the next three years, employment growth was comparable in the two groups, reaching record highs in October 2008.
However, in the wake of the economic slowdown which intensified in the fall of 2008, apprenticeable occupations sustained greater employment losses (-5.7%) than other occupations (-1.3%). And, while apprenticeable occupations posted gains of 3.3% between October 2009 and October 2010, employment in October 2010 (2,892,000) remained below its October 2008 level (2,969,000) (Chart 1).
Chart 1
Employment changes, October 2000 to October 2010
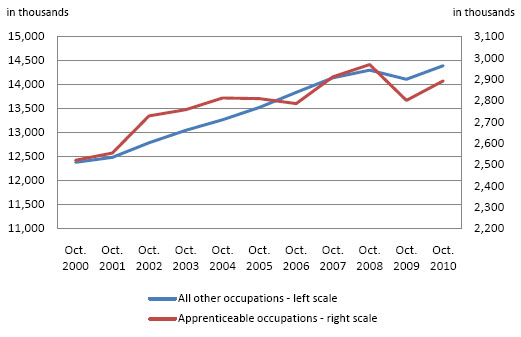
Source: Statistics Canada, Labour Force Survey, not seasonally adjusted.
Decline between October 2008 and October 2009
Not all workers in apprenticeable occupations were affected in the same way by the employment losses. Overall, the downturn in employment had the greatest impact on welders (-28.2%), exterior finishing trades (-20.8%), machinists (-17.2%), carpenters (-16.3%) and heavy equipment and crane operators, including drillers (-15.6%).2 Only automotive service workers and plumbers, pipefitters and steamfitters experienced any significant employment growth (5.3% and 6.9%, respectively) during the period (Appendix Table 1).
These results are attributable to the fact that apprenticeable occupations are closely associated with specific industries that were particularly hard hit by the decline in employment. Although employment decreased in a number of sectors, the declines had major impacts on apprenticeable occupations in the mining and oil and gas extraction (-21.1%), transportation and warehousing (-11.7%), manufacturing (-7.8%) and construction (-7.2%) sectors. There were also substantial employment losses in other occupations in the manufacturing sector (-11.1%) (Chart 2).
Chart 2
Employment changes between October 2008 and October 2009, by industrial sector
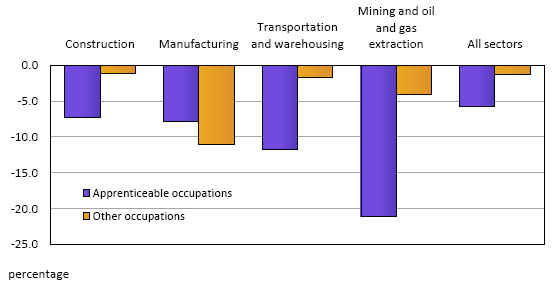
Source: Statistics Canada, Labour Force Survey, not seasonally adjusted.
For all occupations combined, the employment downturn took its heaviest toll in Ontario and Alberta between October 2008 and October 2009, where employment decreased by 3.1% and 3.3%, respectively.3 However, the biggest losses in apprenticeable occupations were observed in British Columbia (-14.4%) and Quebec (-11.8%). In British Columbia, the five apprenticeable occupations that experienced the largest losses were: electricians (-33.4%), interior finishing trades (-30%), food service trades (-29.7%) and heavy equipment and crane operators, including drillers (-28.3%). In Quebec, the most affected occupations were carpenters (-38.2%), hairstylists and estheticians (-27%) and truck drivers (-18%).
In both provinces, the other occupations were less affected by employment losses and even posted slight gains (0.8% in each province).
In contrast, the Atlantic provinces were the only region where employment in apprenticeable occupations increased during the period (5.6%). The gain was largely due to hairstylists and estheticians (42.4%), machinery and transportation equipment mechanics (except motor vehicle) (15.5%), trades helpers, construction labourers (14.6%) and interior finishing trades (14.3%).
Employment changes and demographic characteristics
A number of studies have demonstrated the relationship between level of education, employment prospects and individual earnings.4 According to annual Labour Force Survey data for 2009, the unemployment rate for Canadians with no high school diploma was 15.9%, triple the rate for Canadians with a university degree (5.0%). This suggests that schooling is an indicator of stability in the labour market, a higher level of education being associated with a higher employment rate. With respect to apprenticeable occupations, employment losses among workers who had not finished high school were substantial, at -12.3%, compared to workers who had an apprenticeship or trades certificate (-1.9%).
Moreover, the employment decline in apprenticeable occupations took a heavier toll on workers under age 25 (-13.1%) than on the 55-and-over group (-0.5%), on men (-6.1%) than on women (-3.3%), and on workers born in Canada (-7.3%) than on immigrants (-0.8%).
The larger employment decreases for men and workers born in Canada than for women and immigrants are mainly due to their demographic weight and to the fact that they are concentrated in specific industries. Nearly two thirds of male workers in apprenticeable occupations (64.4% in October 2008 and 61.5% in October 2009) were in the four industries with the largest declines (see Chart 2). In contrast, those same industries employed only about a quarter of the women working in apprenticeable occupations, who tended instead to be clustered in the retail trade, accommodation, food services and personal services industries, with two thirds of them working in personal service jobs, such as hairstylists and estheticians, and food service jobs, such as cooks, butchers and bakers.
While the proportion of workers in apprenticeable occupations who were born in Canada remained unchanged in the four industries with the largest declines between October 2008 and October 2009 (about 55%), the proportion of immigrants in those industries fell by 12 percentage points.5 At the same time, the number of immigrants was climbing in industries with growing employment, such as wholesale and retail trade and personal services. The number of immigrant workers in those industries rose from 107,500 to 135,200, a 26% increase.
While there was some employment decline in relation to these demographic characteristics in other occupations, the changes were, in percentage terms, less pronounced. For example, employment fell by 7.5% for people under age 25, while workers aged 55 and over saw a gain of 4.4%. Similarly, employment decreased by 1.9% for men and by 0.8% for women. Women's better employment performance is due primarily to the fact they were concentrated in educational services and health care and social assistance (employing about 30% of women), two sectors that experienced employment growth between October 2008 and October 2009. In contrast, the highest proportion of men in all other occupations was found in manufacturing (employing about 14% of men).
Employment changes and employment characteristics
When we look at employment characteristics, we find that the distribution of full-time workers and self-employed workers relative to the employed population was virtually unchanged between October 2007 and October 2009, despite a substantial increase in the absolute number of self-employed workers and a decline in full-time work.6 People employed in apprenticeable occupations were more likely to be working full time (91% to 89%) than those employed in other occupations (79%), but less likely to be self-employed (about 13%) than workers in other occupations (about 16%), despite the popular belief that tradespersons tend to own their own businesses or work for themselves.7
The smaller proportion of self-employed workers in apprenticeable occupations may be due to a decline in self-employment in the goods-producing sector (-1.3%), which includes mining and oil and gas extraction, utilities, construction and manufacturing. In contrast, the service sector saw an increase of 6.4% in self-employment between October 2008 and October 2009. Two sectors in particular contributed to that growth: finance, insurance, real estate and rental and leasing (29.0%) and wholesale and retail trade (9.5%),8 which together employed close to a quarter (about 23%) of all workers in non-apprenticeable occupations.
Since the late 1990s, the proportion of employees in temporary jobs has increased steadily in Canada, rising from 11.3% in 1997 to 12.9% in 2007. During the economic downturn, the number of permanent employees fell 3.8%, while the number of temporary employees grew slightly (0.7%). However, apprenticeable occupations lost twice as many permanent jobs (-7.3%) as other occupations (-3.1%).
Although, in all occupations combined, non-unionized employees were harder hit by job losses (-4.0%) than unionized employees (-1.7%),9 the proportions were similar for workers in apprenticeable occupations (-6.3% and -5.8%, respectively). While employment levels in apprenticeable occupations declined primarily among employers with fewer than 20 employees (-10.3%), the reverse was the case for other occupations, as job losses were greatest for employers with more than 500 employees (-5.7% compared with -1.7% for employers with fewer than 20 employees). In both categories of occupations, the largest employment decreases affected employees earning less than $10 an hour, while employment grew for employees earning $40 an hour or more. Employment growth in the upper earnings range was nearly triple the rate in apprenticeable occupations (34.2%) compared to other occupations (12.1%) (Appendix Table 2).
Recovery between October 2009 and October 2010
Between October 2009 and October 2010, employment grew slightly in Canada. The number of employed people rose by 375,200 (or 2.2%), and the unemployment rate fell from 8.4% in October 2009 to 7.9% in October 2010.10 The recovery was more beneficial for workers in apprenticeable occupations, as employment growth in those occupations was 3.3%, compared with 2.0% for workers in other occupations.
Although Quebec and British Columbia were hardest hit by the decline in employment in apprenticeable occupations, they experienced the strongest growth rates one year later, with employment increasing by 73,400 (or 12.1%) in Quebec and by 20,600 (or 5.6%) in British Columbia between October 2009 and October 2010. Those two provinces alone accounted for 85% of the employment gains in apprenticeable occupations over that period.
Employment gains among university graduates were higher in apprenticeable occupations (19.9%) than in other occupations (5.2%). In addition, employment was up appreciably for people with an apprenticeship or trade diploma or certificate in both apprenticeable occupations and all other occupations (9.0% and 5.0%, respectively).
However, the number of people under age 25 employed in apprenticeable occupations continued to decrease (-11,500 or -2.4%), while those aged 25 to 54 and 55 and over experienced substantial employment gains: 63,300 (or 3.3 %) and 39,500 (or 10 %), respectively. The increase in female workers in apprenticeable occupations (5.6%) was proportionally larger than the increase among their male counterparts (2.8%) as well as among male workers (2.7%) and female workers (1.4%) in other occupations (Appendix table 2).
In October 2010, there were 102,600 more permanent employees in apprenticeable occupations than in October 2009, while temporary employment remained virtually unchanged. Employment growth was stronger for non-unionized employees (5.5%) in apprenticeable occupations than for their unionized counterparts (1.6%). Again, the reverse was the case for all other occupations, where employment growth was higher for unionized employees (4.4%) compared to non-unionized employees (2.6%).
Increases in employment among apprenticeable occupation were comparable for employers with fewer than 20 employees (7.9%) and employers with more than 500 employees (8.8%). In the other occupations, employers with fewer than 20 employees showed the largest employment increase at 5.0%, compared to a 3.3 % increase for employers with more than 500 employees.
Finally, in apprenticeable occupations, employment increases were stronger for those earning $30 an hour, at 25.3%, whereas in other occupations, employment growth was comparable in most earnings categories (Appendix table 2).
Conclusion
The decrease in employment between October 2008 and October 2009 was larger in apprenticeable occupations than in all other occupations. It had the greatest impact on welders, exterior finishing occupations, machinists, carpenters and heavy equipment and crane operators, including drillers. These decreases were reflected as well by employment losses in the mining and oil and gas extraction, transportation and warehousing, manufacturing and construction sectors, all of which are important employers of workers in apprenticeable occupations.
The under-25 age group, males and workers born in Canada experienced the largest declines among workers in apprenticeable occupations. The employment decline for males and workers born in Canada was due to their heavy concentration in industries that experienced the largest employment decreases between October 2008 and October 2009. In addition, apprenticeable occupations lost proportionately twice as many permanent jobs as other occupations.
The increase in employment between October 2009 and October 2010 favoured workers in apprenticeable occupations more than workers in other occupations. Further research is needed to determine the extent to which these employment gains reflect infrastructure spending encouraged by governments to help revitalize the economy, business reinvestment or the increase in household spending in 2010 that resulted from greater confidence in Canada's economic situation. More detailed analyses of the labour market situation during that period and of the characteristics of workers in apprenticeable occupations might shed more light on these results.
Appendix tables
| October 2008 |
October 2009 |
Change 2008-2009 |
October 2010 |
Change 2009-2010 |
|
|---|---|---|---|---|---|
| in thousands | percent | in thousands | percent | ||
| All other occupations | 14,301.3 | 14,108.8 | -1.3 | 14,393.1 | 2.0 |
| Apprenticeable occupations | 2,969.4 | 2,800.7 | -5.7 | 2,892.1 | 3.3 |
| Automotive service | 176.1 | 185.5 | 5.3 | 186.0 | 0.3 |
| Carpenters | 161.8 | 135.4 | -16.3 | 146.1 | 7.9 |
| Electricians | 169.5 | 155.0 | -8.6 | 166.5 | 7.4 |
| Electronics and instrumentation | 141.6 | 128.7 | -9.1 | 150.0 | 16.6 |
| Exterior finishing | 73.7 | 58.4 | -20.8 | 61.9 | 6.0 |
| Food services | 373.4 | 379.7 | 1.7 | 398.8 | 5.0 |
| Hairstylists and estheticians | 150.2 | 141.8 | -5.6 | 158.4 | 11.7 |
| Truck drivers | 326.2 | 307.1 | -5.9 | 293.5 | -4.4 |
| Heavy equipment and crane operators including drillers | 118.9 | 100.3 | -15.6 | 97.1 | -3.2 |
| Interior finishing | 131.4 | 124.1 | -5.6 | 129.0 | 3.9 |
| Landscape and horticulture technicians and specialists | 75.5 | 72.4 | -4.1 | 88.7 | 22.5 |
| Machinists | 72.8 | 60.3 | -17.2 | 53.3 | -11.6 |
| Sheet metal workers and metal forming, shaping and erecting trades | 73.4 | 69.9 | -4.8 | 81.1 | 16.0 |
| Machinery and transportation equipment mechanics (except motor vehicle) | 186.6 | 179.0 | -4.1 | 177.1 | -1.1 |
| Oil and gas well drillers, servicers, testers and related workers | 25.6 | 19.0E | -25.8 | 28.6 | 50.5 |
| Plumbers, pipefitters and steamfitters | 65.2 | 69.7 | 6.9 | 80.0 | 14.8 |
| Trades helpers, construction and transportation labourers and related occupations | 398.2 | 401.8 | 0.9 | 386.4 | -3.8 |
| Welders | 114.3 | 82.1 | -28.2 | 83.2 | 1.3 |
| Others | 135.0 | 130.6 | -3.3 | 126.4 | -3.2 |
|
E
use with caution Source: Statistics Canada, Labour Force Survey, not seasonally adjusted. |
|||||
| October 2008 |
October 2009 |
Change 2008-2009 |
October 2010 |
Change 2009-2010 |
|
|---|---|---|---|---|---|
| in thousands | percent | in thousands | percent | ||
| Apprenticeable occupations | |||||
| Permanent job | 2,209.9 | 2,047.5 | -7.3 | 2,150.1 | 5.0 |
| Temporary job | 377.2 | 385.3 | 2.1 | 385.7 | 0.1 |
| Union coverage | 845.7 | 792.5 | -6.3 | 805.1 | 1.6 |
| No union coverage | 1,741.4 | 1,640.3 | -5.8 | 1,730.7 | 5.5 |
| Firm size | |||||
| Less than 20 employees | 782.2 | 701.7 | -10.3 | 757.4 | 7.9 |
| 20 to 500 employees | 903.9 | 884.6 | -2.1 | 857.0 | -3.1 |
| More than 500 employees | 901.1 | 846.5 | -6.1 | 921.4 | 8.8 |
| Hourly wages | |||||
| Less than $10.00 | 225.0 | 161.4 | -28.3 | 104.4 | -35.3 |
| $10.00 to $19.99 | 1,236.0 | 1,177.9 | -4.7 | 1,211.4 | 2.8 |
| $20.00 to $29.99 | 805.2 | 735.8 | -8.6 | 771.7 | 4.9 |
| $30.00 to $39.99 | 279.1 | 301.6 | 8.1 | 368.4 | 22.1 |
| $40.00 and over | 41.8 | 56.1 | 34.2 | 79.9 | 42.4 |
| All other occupations | |||||
| Permanent job | 10,598.6 | 10,271.5 | -3.1 | 10,583.9 | 3.0 |
| Temporary job | 1,429.5 | 1,434.7 | 0.4 | 1,490.0 | 3.9 |
| Union coverage | 3,704.0 | 3,678.8 | -0.7 | 3,839.1 | 4.4 |
| No union coverage | 8,324.1 | 8,027.3 | -3.6 | 8,234.8 | 2.6 |
| Firm size | |||||
| Less than 20 employees | 2,019.3 | 1,985.1 | -1.7 | 2,084.1 | 5.0 |
| 20 to 500 employees | 3,452.4 | 3,537.1 | 2.5 | 3,603.9 | 1.9 |
| More than 500 employees | 6,556.4 | 6,183.9 | -5.7 | 6,386.0 | 3.3 |
| Hourly wages | |||||
| Less than $10.00 | 1,446.8 | 1,095.5 | -24.3 | 714.9 | -34.7 |
| $10.00 to $19.99 | 4,791.4 | 4,717.5 | -1.5 | 5,049.0 | 7.0 |
| $20.00 to $29.99 | 3,091.7 | 3,080.1 | -0.4 | 3,293.1 | 6.9 |
| $30.00 to $39.99 | 1,642.8 | 1,630.1 | -0.8 | 1,736.7 | 6.5 |
| $40.00 and over | 1,055.5 | 1,183.0 | 12.1 | 1,280.3 | 8.2 |
|
Note: Paid employees only. Source: Statistics Canada, Labour Force Survey, not seasonally adjusted. |
|||||
Other publication consulted
Statistics Canada, 2009. The Canadian Labour Market at a Glance, 2007, Statistics Canada Catalogue No. 71-222-X, Ottawa, 127 p.
Notes
-
Estimates from the Labour Force Survey (LFS) used in this article are based on data that precede the LFS standard revision of January 2011. Note that changes to the LFS estimates are minor. Rates for unemployment, employment and participation are essentially unchanged, as are key labour market trends.
-
Readers should keep in mind that percentage changes may be substantially larger for occupations that have a small numbers of workers than for occupations with larger workforces.
-
LaRochelle-Côté, Sébastien and Jason Gilmore. 2009. "Canada's Employment Downturn", Perspectives on Labour and Income, Vol. 10, No. 12, Statistics Canada Catalogue No. 75-001-X.
-
For example, see Statistics Canada, 2010. Education Indicators in Canada: An International Perspective, 2010, Statistics Canada Catalogue No. 81-604-X, Ottawa, Statistics Canada and Council of Ministers of Education Canada, 110 p.
-
Since the LFS is a sample survey subject to some inherent error, particularly among smaller demographic groups, estimates for immigrants are averaged over a three-month period in order to improve confidence in the trend.
-
LaRochelle-Côté, Op. cit.
-
Wendy Pyper also documents the fact that there are fewer self-employed workers in skilled trades than in other occupations, in "Skilled trades employment", Perspectives on Labour and Income, Vol. 9, No. 10, October 2008, Statistics Canada Catalogue No. 75-001.
-
Statistics Canada. Table 282-0011: Labour Force Survey estimates (LFS), employment by class of worker, North American Industry Classification System (NAICS) and sex, unadjusted for seasonality, monthly (persons), CANSIM (database). http://cansim2.statcan.gc.ca (site consulted on December 20, 2010).
-
See LaRochelle-Côté, Op. cit.
-
Not seasonally adjusted data from the Labour Force Survey.
- Date modified: