
Child and spousal support in metropolitan and non-metropolitan areas, 2009/2010

Archived Content
Information identified as archived is provided for reference, research or recordkeeping purposes. It is not subject to the Government of Canada Web Standards and has not been altered or updated since it was archived. Please "contact us" to request a format other than those available.
By Paul Robinson and Mathieu Charron
- General Overview
- Virtually all recipients are women and almost all beneficiaries are children
- About 6% of children (18 years and under) living in the eight jurisdictions were enrolled in a MEP
- Median monthly support payment just over $300
- Three-quarters of recipients received a payment in March 2010
- A majority of cases had either no arrears or arrears less than two times monthly payment as of March 31, 2010
- Fact sheets
- Description of Methodology
- Detailed data tables
- References
- Notes
When the relationship between parents ends, through divorce, separation, or the ending of a common-law union, or when no relationship was established between the parents, one challenge many parents face is the continued financial support of their children. Often, parents need to develop support arrangements so that the financial burden of raising their children is shared between parents and the financial impact of the relationship break-down on the children is minimized.
Support arrangements can be either voluntarily agreed to by both parents or judgment ordered through the civil court system. According to such agreements or orders, support is provided on a regular, ongoing basis by one of the parents (the payor) to the other parent (the recipient) for the benefit of the children, the recipient, or both (the beneficiaries).
Some support arrangements are registered with maintenance enforcement programs (MEPs), which provide administrative support to payors and recipients of child and spousal support and improve compliance with support payments (Statistics Canada 2002). Registration of a case in a MEP is generally determined by the parties involved in the case, unless the recipient is receiving social assistance or money is owed to the Crown. According to 2006 data, 59% of parents who recently divorced or separated (including the dissolution of common-law unions) and with a child support arrangement registered with a court, had enrolled in a MEP (General Social Survey, 2006).
Using data from the Survey of Maintenance Enforcement Programs (SMEP), this article provides a general overview of child and spousal support cases registered with MEPs from eight reporting jurisdictions, which cover 18% of the population: Newfoundland and Labrador, Prince Edward Island, Nova Scotia, New Brunswick, Saskatchewan, Alberta, Yukon and the Northwest Territories. In addition, fact sheets are presented with data on each metropolitan and non-metropolitan area within the eight provinces and territories.
Text box 1
Differences between maintenance enforcement programs
The task of processing and ensuring payment of child and spousal support is essentially the same for all maintenance enforcement programs (MEP) across Canada: MEPs register cases, process payments, and monitor and enforce cases (Statistics Canada 2002). However, beyond the processing steps, each jurisdiction has developed its own maintenance enforcement policies and procedures to address local needs.
Among the jurisdictions examined in this document, three have adopted an automatic or "opt-out" registration system (Newfoundland and Labrador, Nova Scotia, and New Brunswick). In these jurisdictions, maintenance orders are automatically enrolled or filed with a maintenance enforcement program at the time of the order. To be removed from the caseload of a MEP, a recipient must request to be withdrawn from the program.
The five other jurisdictions, namely, Prince Edward Island, Saskatchewan, Alberta, Yukon, and the Northwest Territories, have an "opt-in" program, whereby registration is at the option of either the recipient or the payor. The only exceptions are cases where the recipient is entitled to social assistance, in which case enrolment in the MEP is mandatory.
Jurisdictions with "opt-out" registration systems tend to have more cases to administer and enforce since all new court orders are automatically enrolled. "Opt-in" jurisdictions, on the other hand, tend to have a higher proportion of cases already having arrears when they are first enrolled, or where there has been some difficulty in securing payments.
In addition, the MEPs vary in a number of other important aspects because of different local needs and policies. These differences may relate to client profile, enforcement powers in legislation, enforcement practices, enrolment process, handling and registration of payments, client responsibilities and case closure. Because of these differences, caution must be used in making comparisons between jurisdictions.
End of text box
General Overview
This section focuses on recipients and beneficiaries and provides statistics by jurisdiction for cases where the recipient resides in the province or territory.1 All statistics in this section are based on 2009/2010 data, the most up-to-date information currently available from the Survey of Maintenance Enforcement Programs. Most jurisdictions have been reporting to the survey for less than five years. Over this short period of time, most findings have remained relatively stable for all jurisdictions.
Virtually all recipients are women and almost all beneficiaries are children
In the eight jurisdictions examined, about 83,000 cases were enrolled in a maintenance enforcement program (MEP) on March 31, 2010 (Table 1). The vast majority (97%) of recipients were women.2
Children were the only beneficiaries in almost all the cases (93%). A spouse was the only beneficiary in another 4% of cases, while both spouse and children were the beneficiaries in 3% of cases. Among cases with child beneficiaries, almost two-thirds (64%) involved only one child, more than one quarter (28%) involved two children, and the remainder (9%) involved three or more children (Table 2).
For families on social assistance, payment received may be assigned to the provincial government to offset social assistance costs. About 14% of cases enrolled on March 31, 2010 were assigned.
About 6% of children (18 years and under) living in the eight jurisdictions were enrolled in a MEP
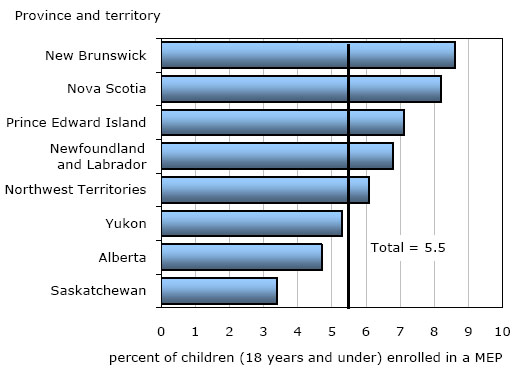
On March 31, 2010, about 91,000 child beneficiaries (18 years or under) or 6% of all children living in one of the eight reporting jurisdictions were enrolled in a MEP. The proportion of children enrolled ranged from 3% in Saskatchewan to 9% in New Brunswick (Chart 1). Another 22,000 child beneficiaries were over 18 years of age.
Chart 1
Proportion of children enrolled in Maintenance Enforcement Program (MEP), eight provinces and territories, as of March 31, 2010
Note: Population estimates at July 1st 2009 provided by Statistics Canada, Demography Division. Estimates are preliminary postcensal for 2009.
Source: Statistics Canada, Survey of Maintenance Enforcement Programs, 2009/2010.
Median monthly support payment just over $300
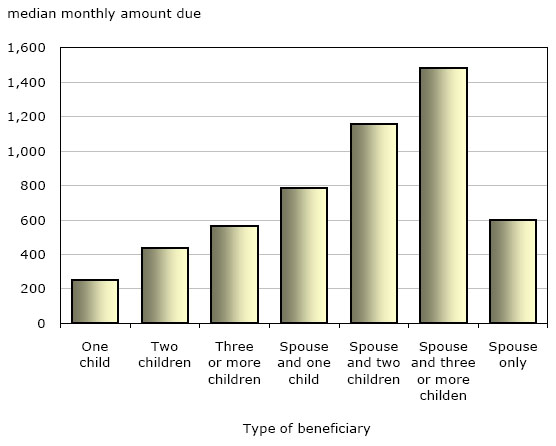
As of March 31, 2010, the median monthly amount of a regular child or spousal support payment among the eight jurisdictions was $305. In general, as the number of child beneficiaries increased, so too did the amount of support (Chart 2). Amounts were even higher when the case also involved a spouse beneficiary. Median monthly amounts due for cases with a single child beneficiary only were lowest in New Brunswick ($200) and highest in the Northwest Territories ($400).Chart 2
Median amount of monthly support payments, by type of beneficiary, eight jurisdictions, as of March 31, 2010
Note: Excludes a small number of Non-ISO, ISO-out cases where the recipient is known to reside outside the jurisdiction and cases with no monthly payments due.
ISO: Interjurisdictional Support Orders.
Source: Statistics Canada, Survey of Maintenance Enforcement Programs, 2009/2010.
The amount of child support due is generally calculated using the Child Support Guidelines. Court orders for support made under the Divorce Act usually use the Federal Child Support Guidelines. Some jurisdictions also have similar provincial/territorial Child Support Guidelines for orders authorized under provincial/territorial legislation. The guidelines primarily consider the income of the payor, the number of child beneficiaries and the province or territory where the payor lives (to account for differing tax rates across jurisdictions) to determine the amount of support. Spousal support is awarded on a different basis than child support. Where children are involved, child support takes precedence. Beyond that, the question of entitlement to spousal support has to be determined before any amounts are contemplated.
Three-quarters of recipients received a payment in March 2010
In March 2010, just over 67,000 cases (or 81% of total cases enrolled) were owed regular child or spousal support payments during the month. In most cases, enforcement of support payment was the responsibility of the reporting jurisdiction. However, 13% of cases enrolled were interjurisdictional support order-out cases, where the payor lived outside the province or territory and the case was enrolled in another MEP (or child support agency of another country) for enforcement.
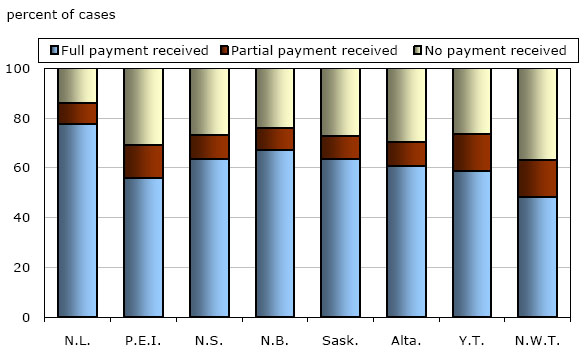
Of the total cases with a regular payment due in March 2010, 64% of recipients received their support in full, 10% received partial payment and the remaining 26% did not receive payment for the month. The proportion of recipients who received payment in full or in part varied by jurisdiction, from 63% of recipients in the Northwest Territories to 86% in Newfoundland and Labrador (Chart 3).
Chart 3
Support cases, by payment received, eight jurisdictions, March 2010
Note: Excludes a small number of Non-ISO, ISO-out cases where the recipient is known to reside outside the jurisdiction and cases with no monthly payments due.
ISO: Interjurisdictional Support Orders.
Source: Statistics Canada, Survey of Maintenance Enforcement Programs, 2009/2010.
Over the course of the fiscal year, MEPs collect not only regular payments, but also payments that go towards arrears (amounts owing from earlier missed payments). As well, other payments (such as event-driven payments, scheduled arrears payments and penalties) are charged, although in all jurisdictions the vast majority of payments due are for regular child or spousal support.3 In 2009/2010, total payments received equalled 83% of total payments due to recipients in seven jurisdictions (information for Newfoundland and Labrador was unavailable). For cases enrolled the entire fiscal year, and with a payment due each month, annual median amount collected was $3,200.
A majority of cases had either no arrears or arrears less than two times monthly payment as of March 31, 2010
In the eight jurisdictions, as of March 31, 2010, 40% of cases with an active payment obligation did not owe arrears and another 14% owed an amount less than two times the monthly payment due. The remaining 46% had arrears more than two times the monthly payment due. Arrears accrue from missed payments that have not been made up. Also, almost half of cases (47%) enrol with arrears already owing on enrolment. Overall, the median amount owing was about $4,200.
If support payments are not forthcoming, MEPs can undertake a variety of actions to enforce current payments or arrears. There are two main categories of enforcement actions: administrative enforcement (for example, wage garnishments, motor vehicle license interventions) and court enforcement (primarily default hearings). Administrative enforcement mechanisms are derived from both provincial and federal legislation. A previous study found that in Alberta and Yukon (jurisdictions that report most of their enforcement actions to the SMEP), administrative enforcement activities were taken in about two-thirds of cases enforced by the MEP in a given year (Robinson 2009).
Fact sheets
The fact sheets below show selected child and spousal support statistics by metropolitan and non-metropolitan areas within the eight reporting jurisdictions. In the past, results from the SMEP have usually been published at the provincial level. The fact sheets allow for the examination of differences and trends between the various areas within each jurisdiction.
In many instances, the beneficiaries and payors in a case live in different communities, or sometimes even different provinces or countries. Among the cases with a known address for both the payor and beneficiaries, the payor and beneficiaries lived in the same metropolitan or non-metropolitan area in just over half of the cases (53%). As a result, for each jurisdiction, information on beneficiaries and payors are presented separately.
Text box 2
Definition of metropolitan and non-metropolitan areas
Metropolitan areas include census metropolitan areas (CMA) and census agglomerations (CA). Statistics Canada defines CMAs and CAs as areas consisting of one or more neighbouring municipalities situated around a major urban core. A CMA must have a total population of at least 100,000, of which 50,000 or more live in the urban core. A CA must have an urban core population of at least 10,000.
Non-metropolitan areas consist of all areas outside of CMAs and CAs. For the purpose of this article, non-metropolitan areas have been subdivided into economic regions (ER), excluding all metropolitan areas (CMAs and CAs) within the region. For example, the Calgary ER has been divided into three areas: the Calgary CMA, the Okotoks CA and the remainder of the ER, termed "Calgary economic region (non-metropolitan parts)". For smaller jurisdictions, like Prince Edward Island and the Northwest Territories, census divisions (CD) were used in place of the ER, as the entire jurisdiction is considered one ER.
End of text box
In total, results were compiled for 76 metropolitan and non-metropolitan areas. Within jurisdictions, most differences between and among metropolitan and non-metropolitan areas (CMAs, CAs and non-metropolitan areas) in the proportion of children enrolled, the amounts due and the amounts collected were generally consistent. Occasionally, for some indicators, regional patterns or differences between types of communities (CMAs, CAs and non-metropolitan areas) existed for a few provinces or territories. These patterns and differences are explored in the jurisdictional highlights.
One notable finding was that areas with higher median incomes for males, aged 35 to 544, tended to also have higher median regular monthly child support payments for the payor (limited to cases with a one child support beneficiary) relative to areas with lower median incomes (Chart 4).5 For example, in areas where median incomes were greater than $50,000 (most, but not all, of these areas are in Alberta), the median regular payment due in March 2010 was $300. On the other hand, in areas where median incomes were less than $35,000, the median payment due was $200. Note that the determination of support by the Child Support Guidelines, which is used in the majority of child support cases, is based in part on the payor's income.Chart 4 Median amount of monthly support payments, by income level of metropolitan and non-metropolitan areas, selected jurisdictions, March 2010
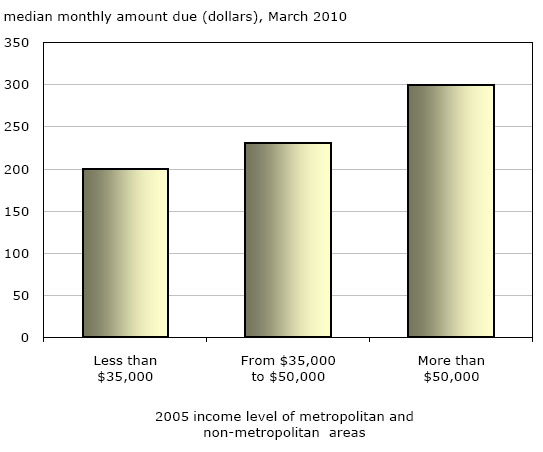
Note: Median income figures are from the 2006 Census of Population, and refer to 2005 calendar year. Figures are for males, between 35 and 54 years of age, as this group represents about 60% of all payors of child support.
Source: Statistics Canada, Survey of Maintenance Enforcement Programs, 2009/2010 and 2006 Census of Population.
Fact sheet: Newfoundland and Labrador
Beneficiaries
- As of March 31, 2010, there were 6,245 cases enrolled in Newfoundland and Labrador, where the recipient had a known address in the province.
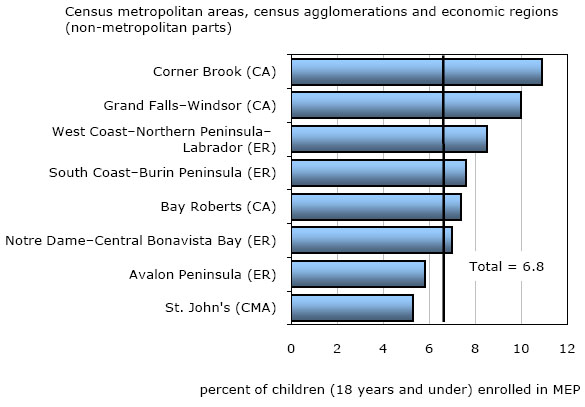
- Corner Brook had the highest proportion of children (18 years and under) enrolled in MEP (11%) while St. John's had the lowest (5%) (Chart 5).
- In 22% of cases outside of St. John's, the case was enforced by another jurisdiction (i.e. the payor resided outside of Newfoundland and Labrador), compared to 17% of cases where the recipient lived in St. John's.
- Fewer cases from St. John's were assigned (9%) compared to the rest of the province (14%).
- The proportion of cases where the recipient received a payment in March 2010 ranged from 82% in Grand Falls-Windsor to 89% in St. John's.
Chart 5
Proportion of children enrolled in Maintenance Enforcement Program (MEP), metropolitan and non-metropolitan areas, Newfoundland and Labrador, as of March 31, 2010
Note: Metropolitan areas consist of one or more neighbouring municipalities situated around a major urban core. A census metropolitan area (CMA) must have a total population of at least 100,000 of which 50,000 or more live in the urban core. A census agglomeration (CA) must have an urban core population of at least 10,000. An economic region (ER) is a grouping of complete census divisions created as a standard geographical unit for analysis of regional economic activity. For the purpose of this article, all ERs cover only areas outside of census metropolitan areas and census agglomerations. Population estimates at July 1st 2009. Estimates are preliminary postcensal for 2009. Statistics Canada, Canadian Centre for Justice Statistics, population estimates produced by author.
Source: Statistics Canada, Survey of Maintenance Enforcement Programs, 2009/2010.
Payors
- As of March 31, 2010, there were 5,140 cases enrolled in Newfoundland and Labrador, where the payor had a known address in the province.
- The median regular payment due for cases involving one child was slightly higher in St. John's ($225) than in the rest of the province ($200).
- The proportion of cases where the full regular payment due was collected from the payor or other sources ranged from 75% in Bay Roberts to 85% in the South Coast-Burin Peninsula economic region (Map 1).
Fact sheet: Prince Edward Island
Beneficiaries
- As of March 31, 2010, there were 2,245 cases enrolled in Prince Edward Island, where the recipient had a known address in the province.
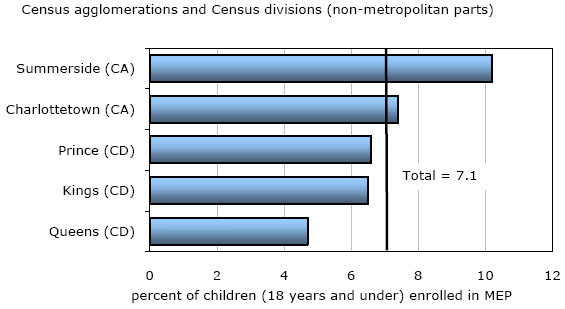
- Summerside had the highest proportion of children (18 years and under) enrolled in a MEP (10%) while Queens census division (non-metropolitan parts) had the lowest proportion (5%) (Chart 6).
- A higher proportion of children were enrolled in the metropolitan areas (8%) than the non-metropolitan areas (6%).
- In the Prince census division (includes all metropolitan and non-metropolitan areas), slightly more cases were assigned (16%) than elsewhere in the province (12%).
- The proportion of cases where the recipient received a payment in March 2010 ranged from 64% in Queen's census division (non-metropolitan parts) to 71% in Charlottetown and Prince census division (non-metropolitan parts).
Chart 6
Proportion of children enrolled in Maintenance Enforcement Program (MEP), metropolitan and non-metropolitan areas, Prince Edward Island as of March 31, 2010
Note: Metropolitan areas consist of one or more neighbouring municipalities situated around a major urban core. A census metropolitan area (CMA) must have a total population of at least 100,000 of which 50,000 or more live in the urban core. A census agglomeration (CA) must have an urban core population of at least 10,000. A census division (CD) is a group of neighbouring municipalities joined together for the purposes of regional planning and managing common services (such as police or ambulance services). These groupings are established under laws in effect in certain provinces of Canada. For the purpose of this article, all CDs cover only areas outside of census metropolitan areas and census agglomerations. Population estimates at July 1st 2009. Estimates are preliminary postcensal for 2009. Statistics Canada, Canadian Centre for Justice Statistics, population estimates produced by author.
Source: Statistics Canada, Survey of Maintenance Enforcement Programs, 2009/2010.
Payors
- As of March 31, 2010, there were 1,980 cases enrolled in Prince Edward Island, where the payor had a known address in the province.
- The median regular payment due for cases involving one child was slightly higher in Queens census division (non-metropolitan parts) and Kings census division (non-metropolitan parts) ($227) than in the rest of the province ($206)
- The collection rate for all cases was 76%. Rates ranged from a low of 67% in Prince census division (non-metropolitan parts) to 80% in both Charlottetown and Summerside (Map 2).
Fact sheet: Nova Scotia
Beneficiaries
- As of March 31, 2010, there were 14,960 cases enrolled in Nova Scotia, where the recipient had a known address in the province.
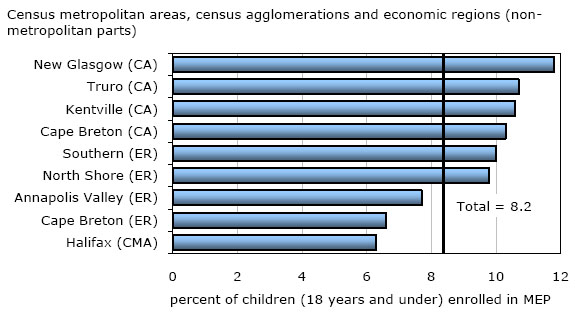
- New Glasgow had the highest proportion of children (18 years and under) enrolled in MEP (12%) (Chart 7). Halifax had the lowest proportion (6%).
- Overall, the census agglomerations in Nova Scotia (Cape Breton, Truro, New Glasgow and Kentville) had a higher proportion of cases assigned (20%) than Halifax or the non-metropolitan areas (both at 15%).
- The proportion of cases where the recipient received a payment in March 2010 ranged from 71% in the North Shore economic region (non-metropolitan parts) to 76% in both Halifax and New Glasgow.
Chart 7
Proportion of children enrolled in Maintenance Enforcement Program (MEP), metropolitan and non-metropolitan areas, Nova Scotia, as of March 31, 2010
Note: Metropolitan areas consist of one or more neighbouring municipalities situated around a major urban core. A census metropolitan area (CMA) must have a total population of at least 100,000 of which 50,000 or more live in the urban core. A census agglomeration (CA) must have an urban core population of at least 10,000. An economic region (ER) is a grouping of complete census divisions created as a standard geographical unit for analysis of regional economic activity. For the purpose of this article, all ERs cover only areas outside of census metropolitan areas and census agglomerations. Population estimates at July 1st 2009. Estimates are preliminary postcensal for 2009. Statistics Canada, Canadian Centre for Justice Statistics, population estimates produced by author.
Source: Statistics Canada, Survey of Maintenance Enforcement Programs, 2009/2010.
Payors
- As of March 31, 2010, there were 13,220 cases enrolled in Nova Scotia, where the payor had a known address in the province.
- Median regular payment due in March 2010 for one child cases was higher in Halifax ($239) than the rest of the province ($200).
- Collection rates varied little between communities. The collection rate for all areas was 87%. Annapolis Valley economic region (non-metropolitan parts) had the highest rate (89%) (Map 3). The collection rate in Halifax was the provincial average (87%).
- In 2009/2010, the median amount collected from payors and other sources over the fiscal year was $2,996. The Cape Breton economic region (non-metropolitan parts) had the highest median amount ($3,552), followed by Halifax ($3,331).
Fact sheet: New Brunswick
Beneficiaries
- As of March 31, 2010, there were 12,200 cases enrolled in New Brunswick, where the recipient had a known address in the province.
- The proportion of children 18 years and under enrolled in a MEP in New Brunswick ranged from 12% in Campbellton to 7% in Fredericton (Chart 8).
- In March 2010, 76% of all cases enrolled had received a regular payment. The highest proportion of cases receiving a payment was in Miramichi and Campbellton with 83%. The proportion of recipients receiving payment was higher in Saint John (79%) than Moncton (71%).
Chart 8
Proportion of children enrolled in Maintenance Enforcement Program (MEP), metropolitan and non-metropolitan areas, New Brunswick, as of March 31, 2010
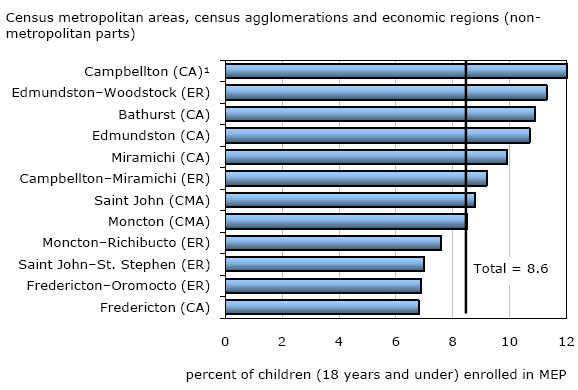
1. New Brunswick part only.
Note: Metropolitan areas consist of one or more neighbouring municipalities situated around a major urban core. A census metropolitan area (CMA) must have a total population of at least 100,000 of which 50,000 or more live in the urban core. A census agglomeration (CA) must have an urban core population of at least 10,000. An economic region (ER) is a grouping of complete census divisions created as a standard geographical unit for analysis of regional economic activity. For the purpose of this article, all ERs cover only areas outside of census metropolitan areas and census agglomerations. Population estimates at July 1st 2009. Estimates are preliminary postcensal for 2009. Statistics Canada, Canadian Centre for Justice Statistics, population estimates produced by author.
Source: Statistics Canada, Survey of Maintenance Enforcement Programs, 2009/2010.
Payors
- As of March 31, 2010, there were 11,420 cases enrolled in New Brunswick, where the payor had a known address in the province.
- Median regular payment due for one child cases varied between areas in March 2010, from $229 in Fredericton-Oromocto economic region (non-metropolitan parts) to $163 in Miramichi.
- The collection rate for all cases was 89% (Map 4). The collection rate was higher in Saint John (93%) than in Moncton (82%). Overall, collection rates were highest in the Campbellton-Miramichi economic region (includes all metropolitan and non-metropolitan areas) at 95%, compared to the rest of the province (88%).
Fact sheet: Saskatchewan
Beneficiaries
- As of March 31, 2010, there were 7,065 cases enrolled in Saskatchewan, where the recipient had a known address in the province.
- Moose Jaw had the highest proportion of children (18 years and under) enrolled in MEP (5%) (Chart 9). The Swift Current-Moose Jaw economic region (non-metropolitan parts) had the lowest proportion (2%).
- The proportion of cases where the recipient received a payment in March 2010 ranged from 63% in Swift Current to 77% in Yorkton. Both Regina (74%) and Saskatoon (75%) were above the provincial average of 73%.
Chart 9
Proportion of children enrolled in Maintenance Enforcement Program (MEP), metropolitan and non-metropolitan areas, Saskatchewan, as of March 31, 2010
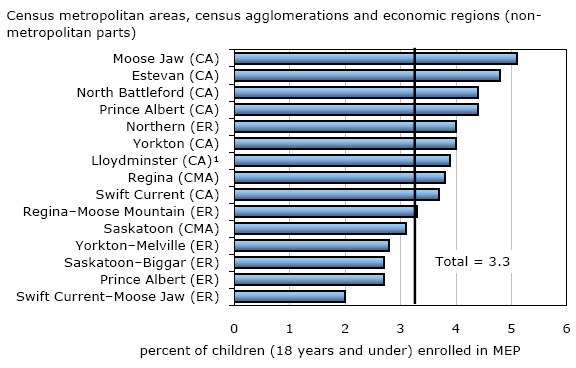
1. Saskatchewan part only.
Note: Metropolitan areas consist of one or more neighbouring municipalities situated around a major urban core. A census metropolitan area (CMA) must have a total population of at least 100,000 of which 50,000 or more live in the urban core. A census agglomeration (CA) must have an urban core population of at least 10,000. An economic region (ER) is a grouping of complete census divisions created as a standard geographical unit for analysis of regional economic activity. For the purpose of this article, all ERs cover only areas outside of census metropolitan areas and census agglomerations. Population estimates at July 1st 2009. Estimates are preliminary postcensal for 2009. Statistics Canada, Canadian Centre for Justice Statistics, population estimates produced by author.
Source: Statistics Canada, Survey of Maintenance Enforcement Programs, 2009/2010.
Payors
- As of March 31, 2010, there were 6,315 cases enrolled in Saskatchewan, where the payor had a known address in the province.
- Median regular payment due in March 2010 for one child cases was lowest in Prince Albert ($202) and highest in Lloydminster ($337). Median payment due was slightly higher in Saskatoon ($258) than in Regina ($250).
- The collection rate for all cases was 92% in 2009/2010. Collection rates were highest in Prince Albert (97%) (Map 5). Collection rates were nearly the same in Regina (92%) and Saskatoon (94%).
- In 2009/2010, the median amount collected from payors and other sources was $3,361. Estevan had the highest median amount collected ($4,407). Median amount collected was slightly higher in Saskatoon ($3,600) than in Regina ($3,324).
Fact sheet: Alberta
Beneficiaries
- As of March 31, 2010, there were 35,805 cases enrolled in Alberta, where the recipient had a known address in the province.
- Wetaskiwin had the highest proportion of children (18 years and under) enrolled in MEP (9%) (Chart 10). Canmore had the lowest proportion (2%).
- Overall, the 12 Census agglomerations had slightly more children enrolled (6%) than census metropolitan areas (4%) and the non-metropolitan areas (5%).
- The proportion of cases where the recipient received a payment in March 2010 ranged from 64% in the Wood-Buffalo-Cold Lake economic region (non-metropolitan parts) to 78% in Cold Lake. The proportion of recipients receiving payment was slightly higher in Edmonton (72%) than Calgary (68%).
Chart 10
Proportion of children enrolled in Maintenance Enforcement Program (MEP), metropolitan and non-metropolitan areas, Alberta, as of March 31, 2010
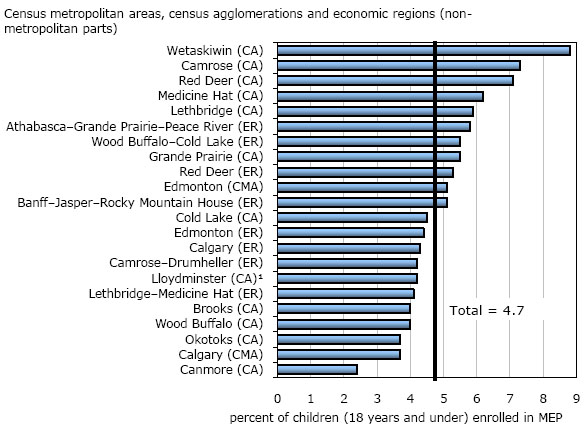
1. Alberta part only.
Note: Metropolitan areas consist of one or more neighbouring municipalities situated around a major urban core. A census metropolitan area (CMA) must have a total population of at least 100,000 of which 50,000 or more live in the urban core. A census agglomeration (CA) must have an urban core population of at least 10,000. An economic region (ER) is a grouping of complete census divisions created as a standard geographical unit for analysis of regional economic activity. For the purpose of this article, all ERs cover only areas outside of census metropolitan areas and census agglomerations. Population estimates at July 1st 2009. Estimates are preliminary postcensal for 2009. Statistics Canada, Canadian Centre for Justice Statistics, population estimates produced by author.
Source: Statistics Canada, Survey of Maintenance Enforcement Programs, 2009/2010.
Payors
- As of March 31, 2010, there were 35,230 cases enrolled in Alberta, where the payor had a known address in the province.
- Median regular payment due in March 2010 for one child cases was lowest in Lethbridge and Wetaskiwin ($250) and highest in Wood Buffalo ($441). Median payment due was slightly higher in Edmonton ($300) than in Calgary ($288).
- The collection rate for all cases was 85% in 2009/2010. Cold Lake was the area with the highest collection rate at 100% (Map 6). Collection rates were at 85% for both Edmonton and Calgary.
- In 2009/2010, the median amount collected from payors was $3,984. Wood Buffalo had the highest median amount ($6,277). Median amount collected was slightly higher in Edmonton ($4,078) than in Calgary ($3,900).
Fact sheet: Yukon end the Northwest Territories
Beneficiaries
- As of March 31, 2010, there were 375 cases enrolled in Yukon and 610 cases enrolled in the Northwest Territories, where the recipient had a known address in the territory.
- The Fort Smith region (excluding Yellowknife) had the highest proportion of children (18 years and under) enrolled in MEP (7%) (Chart 11). The parts of the Yukon outside of Whitehorse had the lowest (5%).
- A large number of cases were enforced by another jurisdiction, particularly in Whitehorse (43%) and Yellowknife (39%)
Chart 11
Proportion of children enrolled in Maintenance Enforcement Program (MEP), metropolitan and non-metropolitan areas, Yukon and the Northwest Territories, as of March 31, 2010
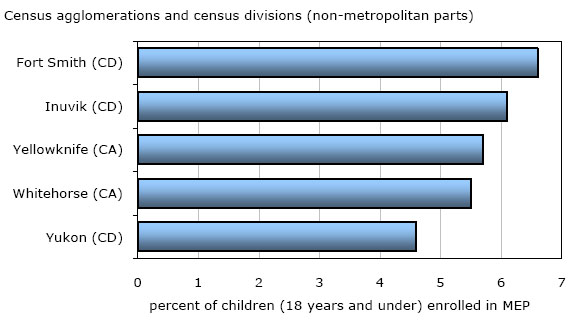
Note: Metropolitan areas consist of one or more neighbouring municipalities situated around a major urban core. A census metropolitan area (CMA) must have a total population of at least 100,000 of which 50,000 or more live in the urban core. A census agglomeration (CA) must have an urban core population of at least 10,000. A census division (CD) is a group of neighbouring municipalities joined together for the purposes of regional planning and managing common services (such as police or ambulance services). These groupings are established under laws in effect in certain provinces of Canada. For the purpose of this article, all CDs cover only areas outside of census metropolitan areas and census agglomerations. Population estimates at July 1st 2009. Estimates are preliminary postcensal for 2009. Statistics Canada, Canadian Centre for Justice Statistics, population estimates produced by author.
Source: Statistics Canada, Survey of Maintenance Enforcement Programs, 2009/2010.
Payors
- As of March 31, 2010, there were 350 cases enrolled in Yukon and 595 cases enrolled in the Northwest Territories, where the payor had a known address in the territory (Map 7).
- Median regular payment due in March 2010 for one child cases was lowest in the Yukon region (excluding Whitehorse) ($265) and highest in the Inuvik region ($418).
Description of Methodology
Survey of Maintenance Enforcement Programs
The Survey of Maintenance Enforcement Programs (SMEP) is currently being implemented by the Canadian Centre for Justice Statistics (CCJS) at Statistics Canada. The SMEP gathers information on maintenance enforcement cases, and on some of the key characteristics associated with those cases. This includes the number of cases enrolled and the age and sex of the recipients and payors of support. In addition, survey data provide information on financial matters, the processing of payments, and the tracing and enforcement actions taken by Maintenance Enforcement Programs (MEPs).
Currently eight provinces and territories report data to the SMEP which cover 18% of the population: (Newfoundland and Labrador, Prince Edward Island, Nova Scotia, New Brunswick, Saskatchewan, Alberta, Yukon and the Northwest Territories). Quebec, Ontario and British Columbia report to the Maintenance Enforcement Survey (MES), which is the older aggregate data survey.
Geocoding
The SMEP collects residential postal codes of the recipient in each case enrolled. Children involved with the case are assumed to reside with the recipient. The Postal Code Conversion File Plus (PCCF+), version 5g, was used to convert postal codes for recipients into standard geographic codes for locating recipients by census metropolitan areas and census agglomerations and economic regions (non-metropolitan parts).
A census metropolitan area consist of one or more neighbouring municipalities situated around a major urban core and must have a total population of at least 100,000 of which 50,000 or more live in the urban core. A census agglomeration must have an urban core population of at least 10,000. An economic region (ER) is a grouping of complete census divisions created as a standard geographical unit for analysis of regional economic activity. For the purpose of this article, all ERs cover only areas outside of census metropolitan areas and census agglomerations. When the association between the postal code and census geography is not unique, the PCCF+ allows for a proportional allocation based on the population count.
Detailed data tables
References
Robinson, Paul. 2009. "Profile of child support beneficiaries." Statistics Canada Catalogue no. 85-002-X.
Statistics Canada. 2002. "Maintenance Enforcement Programs in Canada: Description of Operations, 1999/2000." Statistics Canada Catalogue no. 85-552-X.
Notes
- Excludes a small number of Non-Interjurisdictional Support Order and Interjurisdictional Support Order-out cases where the recipient is known to reside outside the jurisdiction. A Non-ISO is where only one MEP manages the case. ISO-out cases are cases that have been sent to a MEP in another jurisdiction for enforcement.
- In New Brunswick, the recipient's sex was unknown in more than two-thirds of cases (68%). Of the recipients whose sex was known, 95% were women. In each of the other jurisdictions, the recipient's sex was known in 98% of cases.
- Alberta is the only jurisdiction where more than 10% of total payments due are other types of payment (event-driven payments, scheduled arrears payments and penalties).
- In this analysis, the 2005 median total income from the 2006 Census of Population for males, aged 35 to 54, living in the area is used. This particular group was selected as about 75% of all support payors fall within this demographic.
- A positive correlation was found between the median income of males, aged 35 to 54 and median amount of regular monthly child support due. The weighted correlation coefficient for all areas was significant at the 99.9% level.
- Date modified: