
Criminal victimization in Canada, 2014

Archived Content
Information identified as archived is provided for reference, research or recordkeeping purposes. It is not subject to the Government of Canada Web Standards and has not been altered or updated since it was archived. Please "contact us" to request a format other than those available.
by Samuel Perreault
[Highlights] [Full article in PDF]
- Decrease in victimization reported by Canadians
- Violent victimization declines
- Decrease in all types of household victimization measured by the GSS
- Newfoundland and Labrador and Quebec reported the lowest rates of violent victimization among the provinces
- Household victimization rates lowest in the Atlantic provinces
- Halifax and Winnipeg recorded the highest rates of violent victimization among the census metropolitan areas
- Household victimization rates higher in western CMAs
- Characteristics of violent victimization
- Characteristics of household victimization
- Reporting victimization to police
- Summary
- Detailed data tables
- References
- Survey description
- Notes
Criminal victimization has serious impacts on the well-being of victims, their families and friends, their community and on society as a whole (Justice Canada 2013). Impacts can be both direct and indirect and can include financial, physical, psychological as well as emotional consequences. Overall, crime can impact a community’s sense of well being, and can result in heightened costs for policing, victim services and additional prevention measures adopted by businesses and communities.
In addition to collecting police-reported data annually through the Uniform Crime Reporting Survey (UCR), every five years Statistics Canada conducts the General Social Survey (GSS) on Victimization which asks Canadians to self-report victimization for eight offence types.Note 1 Data from the GSS inform us on the victimization experiences of Canadians aged 15 years and older, including incidents not brought to the attention of the police. This information is used by various justice stakeholders to guide victim services, policing, family violence initiatives, and crime prevention programs (Government of Canada 2012).
This Juristat article presents the first results from the 2014 GSS on Victimization. The analysis provides insight on the nature and extent of criminal victimization in the 10 provinces.Note 2, Note 3 The report also examines the factors associated with the risk of being the victim of a crime, the consequences of victimization, and the reporting of incidents to police. While the rates presented in the first part of this report include data on spousal violence, the sections on the characteristics of incidents, consequences of victimization and reporting to police exclude data on spousal violence. Data on spousal violence were collected using a different methodology and will be analysed in a separate report.
Text box 1
Definition of criminal victimization in Canada
The GSS on Victimization surveyed Canadians on their experiences with eight types of offences, which are:
Violent victimization: Sexual assault, robbery or physical assault.
- Sexual assault: Forced sexual activity, attempted forced sexual activity, unwanted sexual touching, grabbing, kissing or fondling, or sexual relations without being able to give consent.
- Robbery: Theft or attempted theft in which the offender had a weapon or there was violence or the threat of violence against the victim.
- Physical assault: An attack (victim hit, slapped, grabbed, knocked down, or beaten), a face-to-face threat of physical harm, or an incident with a weapon present.
Theft of personal property: Theft or attempted theft of personal property such as money, credit cards, clothing, jewellery, purse or wallet. Unlike robbery, the offender does not confront the victim.
Household victimization: Break and enter, theft of motor vehicle or parts, theft of household property or vandalism.
- Break and enter: Illegal entry or attempted entry into a residence or other building on the victim’s property.
- Theft of motor vehicle or parts: Theft or attempted theft of a car, truck, van, motorcycle, moped or other vehicle, or part of a motor vehicle.
- Theft of household property: Theft or attempted theft of household property such as liquor, bicycles, electronic equipment, tools or appliances.
- Vandalism: Wilful damage of personal or household property.
Decrease in victimization reported by Canadians
In 2014, just under one in five Canadians aged 15 years and older (approximately 5.6 million people) reported that they or their household had been the victim of at least one of the eight crimes measured by the GSS in the 12 months preceding the survey. This proportion is down from 2004, when just over a quarter of Canadians reported having been a victim of a crime.
Canadians reported a total of 6.4 million criminal incidents in 2014. The majority (65%) of those incidents were non-violent. Theft of personal property was the crime most frequently reported by Canadians to the GSS, representing one-third (34%) of all victimization incidents. Physical assault, the most frequent violent crime, followed at 22%. This was followed by theft of household property (12%), sexual assault (10%), vandalism (9%), break and enter (7%), theft of motor vehicle or parts (4%) and robbery (3%).
Most Canadians who had been victimized reported only a single incident. However, more than one-third (37%) of victims reported having been the target of at least two victimization incidents in the preceding 12 months.
Violent victimization declines
Violent victimization, which includes sexual assault, robbery and physical assault, was lower in 2014 than 10 years ago. Just over 2.2 million violent incidents were reported by Canadians in 2014, for a rate of 76 violent incidents per 1,000 people aged 15 years and older. This rate is 28%Note 4 lower than in 2004 and represents the first decline since 1999.Note 5 (Table 1, Chart 1).

Among the different types of violent crime, robbery showed the most significant decrease from 2004, falling by 39%.Note 6 Physical assault was next, with a decrease of 35%. Sexual assault, at 22 incidents per 1,000 people, was the only crime for which the victimization rate remained relatively stable over the past decade. Furthermore, sexual assault was the only violent crime type for which the victimization rate remained relatively stable since 1999, while the 2014 rates for both physical assault and robbery were significantly lower than in 1999.
In 2014, a question was added to the GSS to take into account sexual assaults in which the victim was not able to consent to sexual activity because, for example, he or she was drugged, intoxicated, manipulated or forced in ways other than physically. This type of sexual assault represented 9% of all sexual assaults reported by Canadians, while forced sexual activity accounted for 20%. The remaining 71% of sexual assaults involved sexual touching. Without the addition of this new question, the rate of sexual assaults would have been 20 incidents per 1,000 people, still a rate not significantly different from that recorded in 2004.
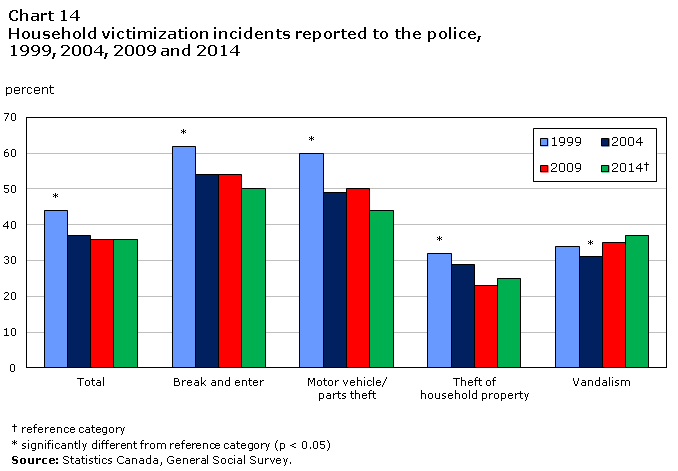
Decrease in all types of household victimization measured by the GSS
The rate of household victimization, which includes break-ins, motor vehicle/parts theft, theft of household property and vandalism, rose steadily between 1993 and 2004 until stabilizing between 2004 and 2009. In 2014, just over two million incidents of household victimization were reported by victims for a rate of 143 incidents per 1,000 households. The 2014 rate was 42% lower than the rate reported 10 years earlier (Table 1, Chart 2).
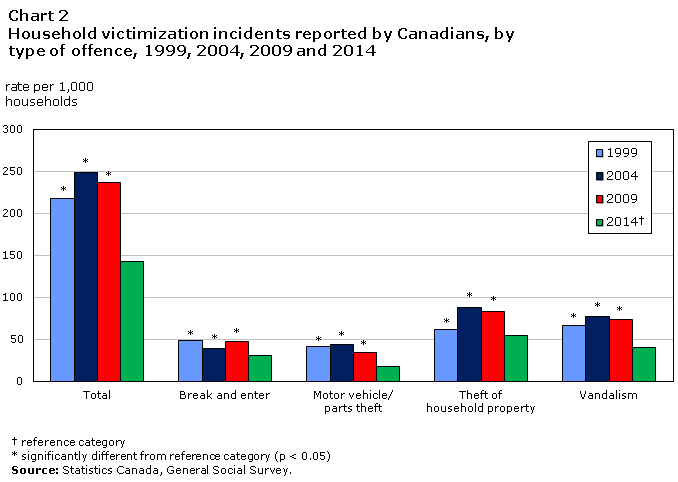
Victimization rates for all household crimes were lower in 2014 than in 2004, with theft of motor vehicle or parts undergoing the largest decrease (-59%), followed by vandalism (-49%), theft of household property (-39%) and break-ins (-21%).
Text box 2
Comparability of 2014 GSS data to previous GSS cycles
The 2014 GSS used a slightly different sample design than previous GSS cycles. In the past, only those households with a landline telephone could have been selected for the survey. The increased use of cell phones by Canadians, as well as the increase of households with no landline, made it necessary to include cell phones in the sample frame to ensure the sample was as representative of the Canadian population as possible.
Another change implemented with the 2014 GSS was the different placement from previous cycles of numerous reminders to respondents as to the reference period for all of the questions, specifically the reminder that the questions were about the preceding 12 months. The goal here was to limit the “telescoping” effect. Telescoping occurs when a respondent shares an incident that took place outside the reference period, whether because the respondent was inattentive when the reference period was mentioned or because he or she wants to share a victimization experience despite it not falling within the reference period. Although the results obtained in 2014 are stronger, it is noteworthy to keep this change in mind when comparing the 2014 data to previous GSS victimization cycles.
Comparability of GSS data and police-reported data
Although the data from the GSS on Victimization and the Uniform Crime Reporting Survey (UCR) both capture information on crime in Canada, the two surveys have many differences including survey type, scope, coverage and source of information. As such, numbers from these two surveys should not be directly compared and trends should be compared with caution.
The GSS is a sample survey which, in 2014, collected data from about 33,000 non-institutionalized individuals aged 15 years and older living in the 10 provinces. The GSS collects data on eight types of offences but excludes crimes targeting businesses or institutions. One of the main advantages of the GSS is that it captures information on criminal incidents that do not come to the attention of the police, which is sometimes referred to as the “dark figure” of crime (see the Survey description section for more information on the GSS). In comparison, the UCR is an annual census of all offences under the Criminal Code and certain other federal laws that come to the attention of the police and are reported by them to Statistics Canada.
Despite these important methodological differences, it is notable that the GSS data and those of the UCR mostly show similar trends over the 10-year period between 2004 and 2014. For example, the GSS shows a 28% decline in the rate of violent victimization and a 42% decline in the rate of household victimization over this period. In comparison, according to the UCR there was a 26% decrease in the rate of violent crimes and a 40% decrease in the rate of crime against property over the same time period.
Newfoundland and Labrador and Quebec reported the lowest rates of violent victimization among the provinces
Among the provinces, only Newfoundland and Labrador (55 incidents per 1,000 population) and Quebec (59 per 1,000) recorded violent victimization rates significantly lower than the average for the 10 provinces (76 per 1,000). However, the significant decreases in the violent victimization rates in Alberta (-51%), Nova Scotia (-40%), British Columbia (-35%) and Ontario (-27%) certainly contributed the most to the overall decline in violent victimization between 2004 and 2014 (Table 2, Chart 3).Note 7

In contrast, the drop in the rate of violent victimization was not statistically significant in Manitoba, the province with the highest rate of violent victimization in 2014 (108 incidents per 1,000 population).
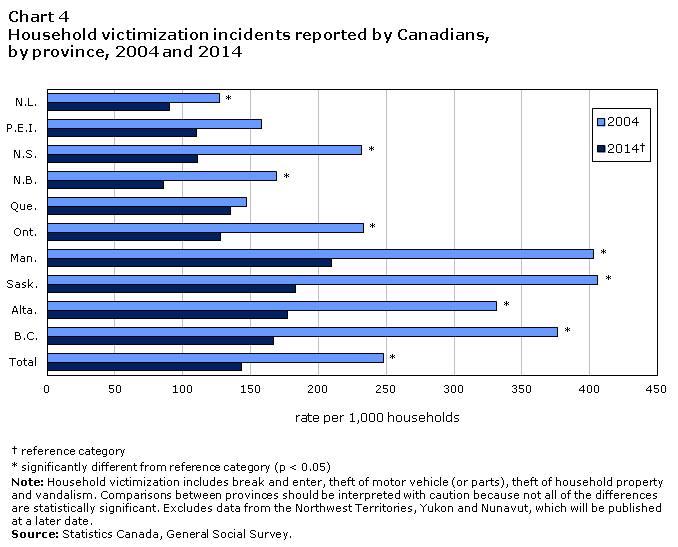
Household victimization rates lowest in the Atlantic provinces
As was the case in previous GSS cycles on victimization, household victimization rates were generally lower in the eastern provinces of the country than in the west. All of the Atlantic provinces and Ontario recorded household victimization rates lower than the provincial average, while the opposite was observed among rates for all of the Prairie provinces and British Columbia (Table 2).
All provinces, except Prince Edward Island and Quebec, recorded a statistically significant decline in the rate of household victimization between 2004 and 2014 (Chart 4).
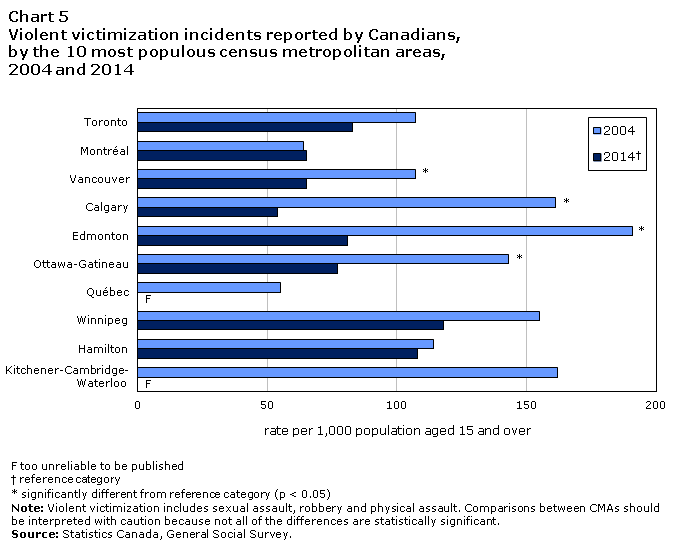
Halifax and Winnipeg recorded the highest rates of violent victimization among the census metropolitan areas
Overall, the rate of violent victimization in census metropolitan areas (CMAs)Note 8 (78 incidents per 1,000 population), that is population centres with at least 100,000 inhabitants, was higher than the rate recorded in census agglomerations (CAs)Note 9 (61 per 1,000), that is, communities with between 10,000 and 100,000 inhabitants. Regions outside the CMAs and CAs reported rates (81 per 1,000) similar to those of the CMAs (Table 3).
Among the CMAs with a releasable violent victimization rate, Halifax recorded the highest rate, despite the fact that its rate dropped 44% from 229 incidents per 1,000 population in 2004 to 129 in 2014.Note 10 Winnipeg had second highest rate, with 118 incidents per 1,000 population. Although Saskatoon also recorded a relatively high rate, the difference compared to the national average was not statistically significant.
In contrast, the Calgary CMA, which enjoyed a 66% decrease in its rate of violent victimization between 2004 and 2014, recorded the lowest rate (54 per 1,000) of all CMAs with a releasable violent victimization rate (Chart 5).
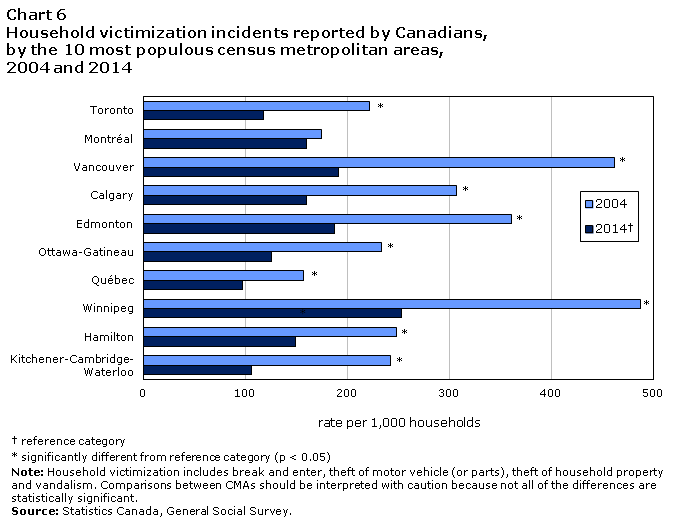
Household victimization rates higher in western CMAs
Unlike violent victimization, the rate of household victimization in the CMAs (152 per 1,000) was relatively similar to that recorded in the CAs (139 per 1,000). Instead, it was the regions outside the CMAs and CAs that, in general, recorded the lowest rate of household victimization (108). All CMAs in the Atlantic provinces, Quebec and Ontario with releasable household victimization rates recorded similar or lower rates than the national average (143), with the Québec CMA recording the lowest rate (97). In contrast, all western CMAs with releasable household victimization rates, with the exception of Calgary, Kelowna and Victoria, recorded rates higher than the national average (Table 3).
The majority of CMAs with reliable estimates for 2004 and 2014 saw rates of household victimization drop during this period. Of the 10 most populous CMAs, Montréal was the only one for which the rate remained relatively unchanged (Chart 6).
Characteristics of violent victimization
The risk of being a victim of a violent crime is not the same for everyone. Lifestyle, the places people frequent or the areas in which they live can expose people to a higher risk of being the victim of a crime (Lilly 2014).
Several characteristics have been shown to be associated with higher rates of victimization (Perreault and Brennan 2010). Some of these characteristics can be interrelated: for example, young people may have a higher rate of victimization than older people, and students may have higher rates of victimization than those who are employed. However, as has been noted in previous research, being a student may not be associated with a higher risk of violent victimization when other factors are controlled for, mainly age (Mihorean et al. 2001).
Using the 2014 GSS data, a multivariate analysis was conducted to determine which factors had an impact on the risk of violent victimization (Model 1). The following section highlights those characteristics that were found to be associated with a higher risk of violent victimization after all other risk factors measured by the GSS were taken into account.
Women were at higher risk than men of being victims of a violent crime
In previous GSS cycles on victimization, men and women showed relatively similar rates of violent victimization. However, in 2014, women recorded a higher rate (85 incidents per 1,000 women) than men (67 per 1,000) (Table 4).
This finding is primarily due to the fact that the sexual assault rate—a crime in which the majority of victims are women—remained stable over the past decade, while the rates for robbery and physical assault—in which the majority of victims are men—dropped significantly since 2004. However, it should be noted that, overall, the rates of violent victimization between 2004 and 2014 declined for both women (from 102 to 85 incidents per 1,000 women) and men (from 111 to 67 incidents per 1,000 men).
When all other risk factors were taken into account, women maintained a risk of violent victimization that was about 20% higher than men. In other words, the higher rates of violent victimization among women could not be completely explained by the other risk factors measured by the GSS.
Age was the key risk factor in violent victimization
As has been observed in previous GSS cycles, in 2014 age was once again the key factor associated with violent victimization. The rate of violent victimization was highest among people aged 20 to 24 (170 incidents per 1,000 population) and then dropped considerably beginning at age 30 (Chart 7).
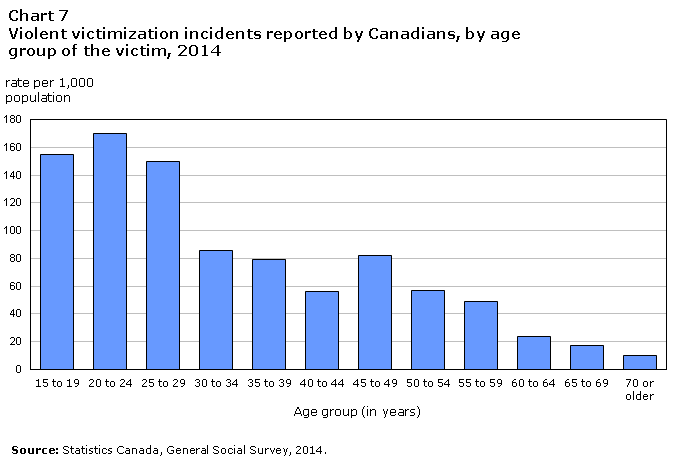
Age is often associated with a lifestyle that involves greater exposure to potential offenders or risky situations wherein the risk of experiencing violence is higher (Lilly 2014; Perreault and Brennan 2010; Cohen and Felson 1979). For example, the 2014 GSS showed that people aged 20 to 24 were more likely to frequently engage in evening activities or to use drugs. Even taking all other risk factors into account, young people aged 20 to 24 recorded a risk of violent victimization six times higher than people aged 65 and older.Note 11
Drug use, binge drinking and the frequency of evening activities were associated with the risk of violent victimization
Among various lifestyle characteristics, drug useNote 12 was the factor with the greatest impact on the risk of violent victimization, and that risk varied with frequency of use and type of drug. People who stated that they used drugs during the month preceding the survey recorded a rate of victimization more than four times higher than non-users (256 incidents per 1,000 population compared to 62). The rate of violent victimization was 436 incidents per 1,000 population among people who reported using cannabis daily and 610 among people who used drugs other than cannabis (Table 5).
Alcohol consumption was also linked to a higher risk of violent victimization. For example, people who reported engaging in at least one binge drinking episode—that is, at least five alcoholic drinks on a single occasion—during the month preceding the survey recorded a violent victimization rate more than twice as high as those who did not do so (127 incidents per 1,000 population compared to 58). However, people who drink alcohol frequently but not to the extent that their consumption would be considered binge drinking did not report higher than average rates of violent victimization.
The frequency of evening activities was also associated with the risk of violent victimization. People who reported more than 20 evening activities per month recorded a rate of victimization about four times that of people who never went out in the evening (141 incidents per 1,000 population compared to 34). Evening activities can include going out for work, for school, for shopping, to visit friends, to go to the cinema, to go to restaurants or to go to bars, among other activities. The type of activity made a difference. For example, people who reported more than 10 evenings out in a bar or pub had an even higher rate of violent victimization, at 250 incidents per 1,000 population.
Mental health was associated with the risk of violent victimization
Mental health was among the main factors associated with the risk of violent victimization in 2014. Altogether, people who reported that their daily activities were limited by a mental health-related disability, a learning or a developmental disability or who self-assessed their mental health as being poor or fair recorded a rate of violent victimization more than four times higher than people who assessed their mental health as excellent or very good (230 incidents per 1,000 population compared to 53).
People who reported a mental or psychological disability or self-assessed their mental health as being poor or fair often had other characteristics associated with a higher risk of violent victimization, which may partially explain their overall higher victimization rates. For example, according to the 2014 GSS these individuals were more likely to use drugs or have a history of homelessness. Taking all risk factors into account, people who reported a mental or psychological disability or who self-assessed their mental health as being poor or fair recorded a risk of violent victimization about 2 times higher than people who self-assessed their mental health as excellent or very good (Model 1).
It should be noted that a mental health-related disability or a poor self-assessed mental health, could sometimes also be the result of the victimization. For example, among victims reporting a mental health-related disability or self-assessed their mental health as poor, 31% reported that their victimization caused them depression, anxiety attacks or symptoms related to potential post-traumatic stress.Note 13 In other words, for at least some of the people suffering from a mental health condition, it cannot be determined if this problem existed prior to the victimization or was a consequence of it.
Text box 3
Child maltreatment
Several studies show a link between abuse experienced during childhood and both an increased risk of victimization in adulthood (Parks 2011; Reid 2009; Desai 2002) and an increased likelihood of having contact with police (Boyce 2015). For the first time, the 2014 GSS included detailed questions about child maltreatment.
Approximately one-third of Canadians (30%) reported being victims of some form of abuse by an adult at least once before the age of 15. More specifically, 22% reported experiencing physical abuse,Note 14 3% suffered sexual abuse,Note 15 and 5% experienced both physical and sexual violence.
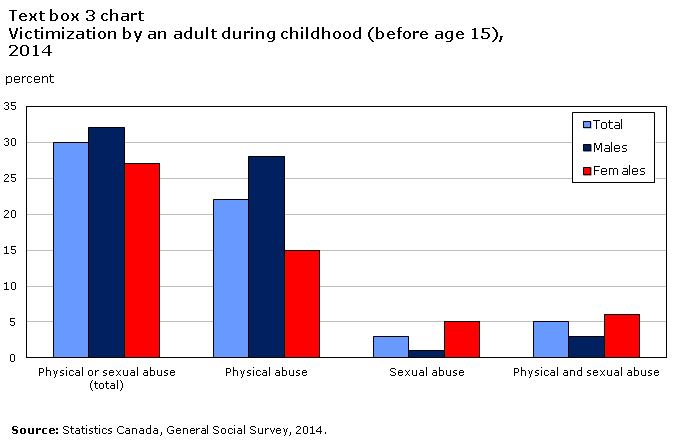
Description for Text box 3 chart
In most cases of physical abuse, the offenderNote 16 was a family member, generally the father (35%) or mother (23%). In cases of sexual abuse, the offender was often also a member of the immediate familyNote 17 (18%) or extended family (20%), though many victims identified a stranger (21%), acquaintance (12%), neighbour (8%), friend or teacher (6% each). However, among those victims of multiple incidents of sexual abuse,Note 18 a member of the immediate or extended family (65%) was more commonly identified as the perpetrator of the most serious incident of sexual abuse.
The majority of self reported cases of child maltreatment (93%) never came to the attention of authorities, either the police or child protective services. However, the probability of reporting the abuse increased with the severity and frequency of the abuse. For example, 27% of people who were, before the age of 15, sexually assaulted more than 10 times stated that they had spoken about the abuse to authorities.
People who suffered child maltreatment were more likely to be victims of a violent crime
Victimization during childhood is another factor that increased the risk of being a victim of a violent crime as an adult. Overall, people who experienced child maltreatment recorded a rate of violent victimization more than double that of people who did not experience such abuse (125 per 1,000 compared to 55). Both physical and sexual abuse experienced during childhood were associated with higher rates of violent victimization (Table 5).
Child maltreatment includes being slapped, hit on the head or pushed, as well as more serious actions such as being punched, kicked or forced into unwanted sexual activity. All of these forms of childhood abuse—even those that might be considered to be less serious—were associated with higher rates of violent victimization (Table 5).
Moreover, people who themselves were never directly abused as children, but who witnessed violence by one of their parents toward another adult, also recorded higher rates of violent victimization in 2014 (97 incidents per 1,000, compared to 53 per 1,000 among those who did not experience child maltreatment and did not witness violence by one of their parents).
Child maltreatment is associated with several other risk factors for violent victimization in adulthood. For example, those respondents that reported experiencing child maltreatment were more likely to report using drugs (10% compared to 6%) and having a mental health condition (16% compared to 8%) than respondents who did not experience abuse as a child. Even when all risk factors were taken into account, the risk of victimization remained higher for people who experienced child maltreatment (Model 1).
People with a history of homelessness were more likely to report being a victim of a violent crime
People with a history of homelessness—those who have ever been homeless or have had to live with someone else or in their vehicle because they had nowhere else to go—reported higher violent victimization rates than people without such a history. For example, people who had been homeless at some point in their lifetime reported a victimization rate five times higher than people who had never been homeless (358 incidents per 1,000 population compared to 71) (Table 5).
People with a history of homelessness were also more likely to have lived in neighbourhoods with weak social cohesion, experienced child maltreatment, used drugs, and had reported experiencing a mental health condition, which partly—but not completely—explain their higher violent victimization rates (Model 1).
The risk of violent victimization was higher among people residing in a neighbourhood with low social cohesion
Low social cohesion was found to be associated with a higher risk of violent victimization. Strong social cohesion generally refers to a neighbourhood where people know each other, help each other and share common values (Charron 2009; Forrest and Kearns 2001).
Low social cohesion seems to be associated with higher levels of crime, particularly due to lesser social control and collective efficacy in the neighborhood (Sampson 2012; Charron 2009). For example, in 2014, lower rates of violent victimization were observed among people who considered their neighbourhood a place where people help each other (69 incidents per 1,000 population) than among people who believed the opposite (136 incidents per 1,000 population) (Table 6).
Moreover, the presence of social disorder—such as litter, noisy neighbours, people being drunk or using drugs in public places—can be considered a sign of social disorganization (Brown et al. 2004). People who reported the presence of social disorder in their neighbourhood recorded a rate of violent victimization almost three times higher than people who did not perceive social disorder (109 incidents per 1,000 compared to 40). Even when all risk factors were taken into account, the presence of social disorder and the lack of help between neighbours continued to be key risk factors for violent victimization (Model 1).
Homosexuals and bisexuals recorded high victimization rates
Canada has a very diverse population and governments have adopted various laws to protect its minority groups. For example, there are provisions under article 718.2 of the Criminal Code for more severe sentences for hate-motivated crimes. Both police-reported data and data collected through the GSS show that these crimes most often involve minority groups (Allen 2015). As such, monitoring violent victimization among different minority groups could help the development of targeted prevention programs or victim services.
Among the minority groups covered by article 718.2 of the Criminal Code, people self-identifying as homosexual or bisexual recorded the highest violent victimization rate at 207 incidents per 1,000 population, compared to 69 per 1,000 for heterosexuals, according to the 2014 GSS. People with disabilities also had an above-average victimization rate (123), and while this category includes all types of disabilities, physical and mental, these higher rates appear to be specifically the result of the high victimization rates among those with a mental or learning disability. It should be noted, however, that all of these rates include crimes motivated by hate as well as those that are not motivated by hate. Consequently, these higher rates may also be related to other factors (Chart 8).
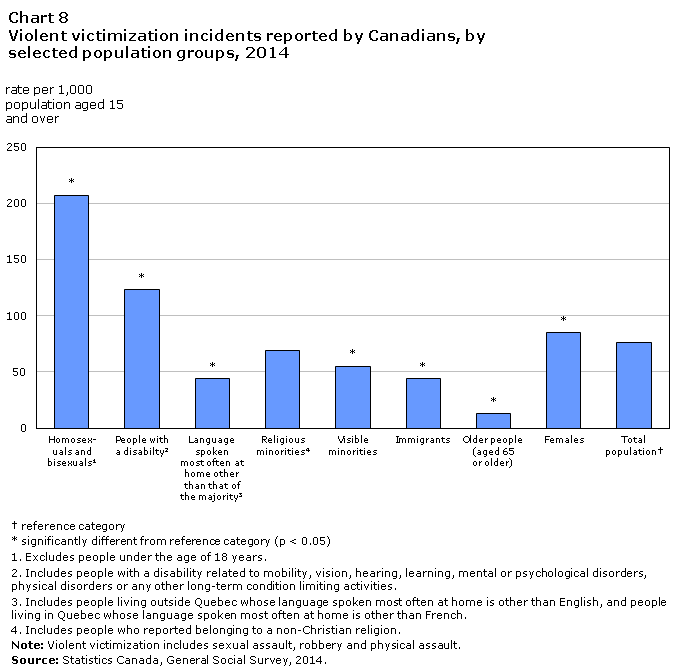
Immigrants and members of a visible minority, religious minority or persons whose language most often spoken at home differed from that of the majority in their province all posted victimization rates similar to or lower than the average.
Aboriginal people, in particular women, were more likely to be victims
Data from various sources show that Aboriginal people are overrepresented as both offenders and victims of crime (Statistics Canada 2015; Royal Canadian Mounted Police 2014; Perreault 2011). The 2014 GSS data confirm this trend. Close to one in three (30%) Aboriginal peopleNote 19 reported that they or their household had been the victim of at least one of the eight crimes measured by the GSS in the 12 months preceding the survey, down from 38% in 2009.Note 20 In comparison, fewer than one in five (19%) non-Aboriginal people reported that they or their household had been victimized, down from 27% in 2009.
The differences between Aboriginal and non-Aboriginal people were most pronounced for break-ins and sexual assaults, with the rates for Aboriginals being more than double those for non-Aboriginals (Chart 9).
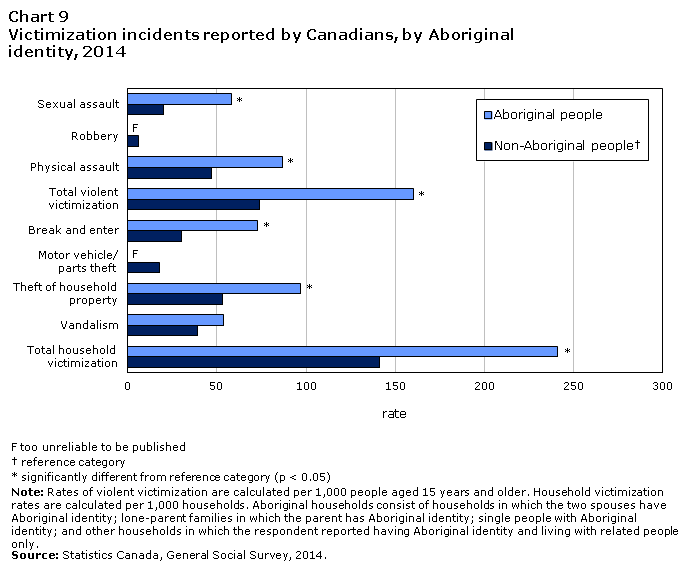
Violent victimization rates were especially high among Aboriginal females. For example, they recorded a sexual assault rate of 115 incidents per 1,000 population, much higher than the rate of 35 per 1,000 recorded by their non-Aboriginal counterparts.
Relative to their non-Aboriginals counterparts, Aboriginal people were more likely to have certain characteristics associated with a higher risk of violent victimization. In particular, they were about 1.4 times more likely to report having been victims of childhood maltreatment, about twice as likely to report a mental health condition, 2.3 times as likely to use drugs, and 2.5 times more likely to have a history of homelessness. The Aboriginal population is also younger (on average) than the non-Aboriginal population.
When all risk factors measured by the GSS were controlled for, Aboriginal identity itself did not stand out as a characteristic linked to the risk of victimization. Instead, the higher victimization rates among Aboriginal people, overall, appeared to be related to the increased presence of risk factors among this group than among non-Aboriginals (Model 1).
However, the same analysis carried out specifically for women revealed that, in 2014, Aboriginal identity itself remained a key risk factor for victimization among women, even when controlling for the presence of other risk factors. In other words, higher rates among Aboriginal females could not completely be explained by the factors measured in this analysis; so factors other than those measured may be at play.
One-quarter of violent incidents took place at the victim’s place of workNote 21
Only a small proportion of the violent crime took place on the street or in a public place. According to the 2014 GSS, violent incidents, other than those related to spousal violence, happened most often in a private residence (34%), often the victim’s home, or in a commercial or institutional establishment (39%) such as a bar or restaurant, shopping mall, school, hospital, office building or factory (Table 7).
Some of these locations, where violent incidents occurred, may also have been the victim’s place of work. In 2014, this was the case in just over one-quarter (27%) of incidents of violent victimization. One-third of incidents that occurred in the victim’s place of work involved a victim working in the fields of education, law, social and community services (18%) or health (15%), despite these occupations representing smaller proportions of the working population (12% and 6% respectively, according to the GSS). Similarly, one-quarter of violent incidents that occurred in the victim’s place of work involved a victim working on a rotating (21%) or night shift schedule (4%), while respectively 9% and 2% of the working population actually work on these types of schedules.
The majority of offenders were male and, on average, in their early thirties
As was observed in previous cycles of the GSS, and in keeping with police-reported data, offenders were generally male (86% of violent incidents). Sexual assaults were more likely to be committed by a male offender (94%) than were physical assaults (82%) (Table 7).
According to victims, those persons committing the violent crimes against them were perceived to be, on average, aged 34 years old. However, the average age of the offenders was slightly lower when the victims themselves were young. For example, in incidents involving a victim between the ages of 15 and 24 years, the perceived average age of the offender was 24 years.
Most victims knew their attacker
Although the fear of being the victim of a crime is often linked to a fear of being attacked by a stranger (Wilcox 2006; Garofalo 1979), victims often know their attacker. The offender was a stranger in just under half (48%) of violent incidents, after excluding incidents of spousal abuse.Note 22 Robbery was the crime most likely to be committed by a stranger (63% of robberies) while sexual assault was the least likely to be (44% of sexual assaults) (Table 7).
Most violent incidents did not involve weapons and did not result in physical injury
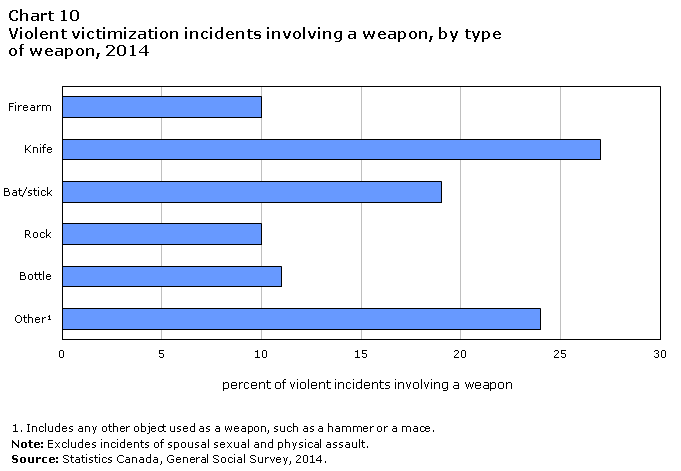
The majority of violent incidents reported by victims in 2014, excluding incidents of spousal violence, involved neither a weapon nor an injury. A weapon was present in just over one-quarter (26%) of violent incidents, a similar proportion to that recorded in 2004. The most frequently used weapon was a knife (27% of incidents involving a weapon), followed by a bat/stick (19%), a bottle (11%) or a firearm (10%) (Chart 10).
Violent incidents resulting in injury were less frequent than incidents involving a weapon. Just under one in five (19%) incidents caused an injury and a minority (3%) required medical attention. The proportion of violent incidents causing physical injury in 2014 was down from that recorded in 2004 (25%).
Causing injury or the presence of a weapon are two elements that can be used to measure the seriousness of a violent crime. In particular, these criteria are used to classify the different levels of physical assault and sexual assault under the Criminal Code.
About one in seven victims of violent crime have experienced symptoms consistent with suspected post-traumatic stress disorder
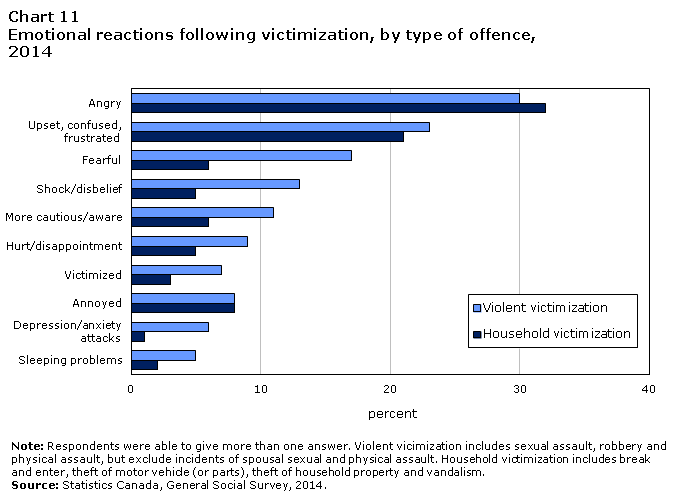
Anger was the most frequent emotional reaction to violence cited by victims (30%). Some victims also reported experiencing depression or anxiety attacks (6%) or sleeping problems (5%) as a result of the incident. However, just over one-quarter (26%) of victims said that they were hardly or not at all affected (Chart 11).
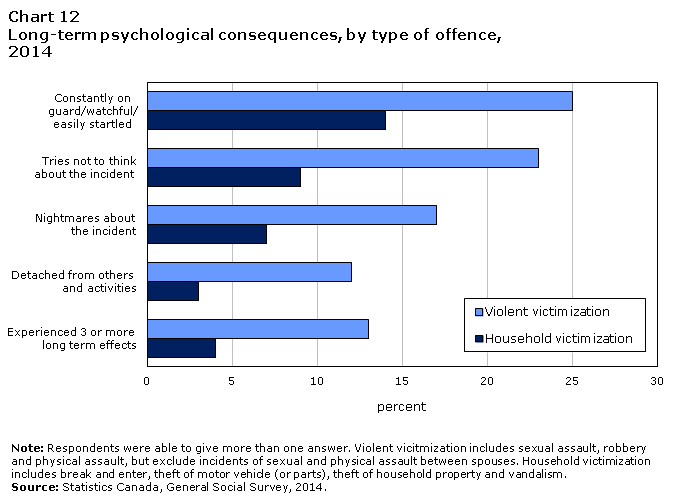
In 2014, victims who reported being emotionally affected by the incident were asked four subsequent questions about the long-term effects of victimization based on the Primary Care Post-Traumatic Stress Disorder (PTSD) Screen (see Text box 4). Although it is not possible to diagnose PTSD based on the results of these questions, they do inform us about the long-term effects of victimization. Just over one-third (35%) of victims of violent crime reported feeling at least one of these four long-term effects and just under one in seven (13%) reported feeling at least three of these effects, which fits the criteria indicating that PTSD is suspected. Being constantly on guard and easily startled was the long-term effect mentioned most often by victims (25% of violent incidents) (Chart 12).
Text box 4
Post-Traumatic Stress Disorder
Some research to date has found that victims of violence may experience Post Traumatic Stress Disorder (PTSD), which can affect individuals that have experienced physical and/or psychological trauma, and is characterized by feelings of detachment, being constantly on guard, nightmares and avoidance behaviors. Studies of those affected have found that PTSD is associated with impaired physical health, decreased quality of life and increased mortality (Prins et al. 2003).
Victims were asked whether they had experienced the following as a result of their victimization:
- In the past month have you:
- Had nightmares about it or thought about it when you did not want to?
- Tried hard not to think about it or went out of your way to avoid situations that reminded you of it?
- Felt constantly on guard, watchful or easily startled?
- Felt numb or detached from others, activities or your surroundings?
These new questions included in the GSS are from the Primary Care PTSD Screen (PC-PTSD) tool, a front-line assessment tool used to identify individuals who should be referred to further psychological and psychiatric treatment for the disorder (Prins et al. 2003). The tool is designed to assess whether an individual demonstrates key affects related to the core PTSD symptoms of re-experiencing, numbing, avoidance and hyperarousal. If an individual answers ‘yes’ to any three of the four questions, the presence of PTSD is suspected. It is crucial to note that the PC-PTSD is not a diagnostic tool, and a suspicion of PTSD is not the same as a diagnosis. In a clinical setting, a positive score on the PC-PTSD would indicate that the patient should be referred for more in-depth assessment and possible diagnosis.
One-quarter of violent crime victims had to take time off from their daily activities
One-quarter of victims of violent crime were unable to continue their daily activities for at least one day, because they needed to receive care for an injury, regroup emotionally, replace stolen property, take legal action or for some other reason. The median time that victims were absent from their daily activities was two days, but since a minority of victims had to be absent for a considerable length of time (3% of victims were absent at least 60 days), the average length of absence was 23 days.
Financial loss is another consequence incurred by victims of violent crime. Robbery was the violent crime that resulted most often in financial loss (55%). In close to one out of five robberies (19%), the loss was $1,000 or more.
Characteristics of household victimization
As with violent victimization, certain characteristics are related to whether a household is more or less likely to be the target of a crime. A multivariate analysis was also carried out to identify which factors were associated with the risk of household victimization (Model 2).
Low social cohesion was associated with a higher risk of household victimization
As was the case for violent victimization, low social cohesion in a neighbourhood was associated with a higher risk of household victimization. For example, the rate of household victimization was almost triple when neighbourhood social disorder was present than when it was not (209 per 1,000 households compared to 70 per 1,000). As mentioned earlier, social disorder can be considered as a sign of low social cohesion (Brown et al. 2004). When all risk factors were taken into account, households residing in a neighbourhood with social disorder still recorded a risk of victimization about three times higher than others (Table 6, Table 8 and Model 2).
Households residing in apartments or condos were less likely to be victimized by household crime
Households residing in an apartment or condo recorded a lower risk of household victimization than people residing in single detached homes, and this was especially true for those residing in a building with 5 or more floors. When all risk factors measured by the GSS were taken into account, households residing in an apartment building with 5 or more floors recorded a risk that was about 60% lower than households residing in a single detached home. As for households residing in an apartment or condo in a building with fewer than 5 floors, the risk was about 35% lower (Model 2).
Although, in general, apartments and condos tend to be located in CMAs, where victimization rates are higher, this type of housing is likely to provide some protection. First, it may be more difficult for potential offenders to reach the dwelling and, in certain circumstances, a vehicle due to controlled security devices and/or building attendants. Second, there is generally little or no outside space with properties of this type that could be the target of theft or vandalism (Weisel 2004).
In contrast, household victimization rates were higher among tenant households than among households owning their dwelling (165 incidents per 1,000 households compared to 135). The greater victimization risk among households renting their home remained even after taking other risk factors into account.
The size of the household was linked to the risk of victimization
The more members a household had, the greater was its likelihood of becoming the target of a household crime. For example, households consisting of one or two people recorded a household victimization rate of 115 incidents per 1,000 households, compared to a rate of 206 incidents for households with five or more members. When all other factors measured by the GSS were controlled for, each additional household member increased the risk of household victimization by about 13% (Table 6, Table 8 and Model 2).
The size of the household may be an indicator of the quantity of property that it owns. For example, 71% of households with only one member reported owning at least one motor vehicle and 8% had an household income over $100 000. In comparison, these proportions were 92% and 63% respectively among households with five or more members. Property owned is also property that can be stolen or vandalized.
Victims of break-ins were the most likely to experience emotional and psychological consequences
Compared to incidents of violent victimization, crimes targeting households were less likely to result in emotional or psychological consequences. Nevertheless, two-thirds of victims of household crimes reported one form or another of an emotional reaction, most often anger. Victims of break-ins were most likely to have experienced the most serious consequences: 6% stated having had sleeping problems and/or depression and 8% reported experiencing at least three of the long-term effects measured by the Primary Care PTSD Screen.
One incident in five resulted in losses of $1,000 or more
Financial loss was the most frequent result of household crimes in 2014. Most (81%) household victimization incidents led to a financial loss and 19% involved losses of $1,000 or more. Break and enter (24%) and theft of motor vehicle or parts (21%) were the incidents most likely to result in losses of $1,000 or more.
Text box 5
Theft of personal property
Theft of personal property was the crime most frequently reported by Canadians among the eight offences measured by the GSS in 2014. Slightly more than one in 20 Canadians (6%) had been a victim during the 12 months preceding the survey. Just over two million thefts of personal property were reported, a number higher than all households crimes combined (Table 1).
The personal characteristics associated with higher levels of theft of personal property were often the same as those for violent crimes, although the impact of these characteristics was generally less significant than in the case of violent offences. For example, as was the case for rates of violent victimization, the rate of theft of personal property varied with age, but did not really begin to decline until age 45. High household income and living in a CMA were among the characteristics specifically associated with higher rates of theft of personal property.
In 2014, according to the GSS, the property stolen most often was money (37% of thefts), a purse or bank or credit cards (16%), clothing and accessories such as jewellery (14%), or electronic equipment (12%). In most cases (59%) the value of the property stolen was less than $200, though it was as high as $1,000 or more in 11% of cases.
Most victims of theft of personal property (64%) were emotionally affected by the incident. Thefts of personal property were brought to the attention of the police in almost one-third of cases (29%) in 2014 (Table 9).
Reporting victimization to police
Most incidents of victimization did not come to the attention of the police
Most incidents of victimization, both violent and non-violent, never came to the attention of the police in 2014. Just under one-third (31%) were reported to the police, either by the victim directly (21%) or in some other way (10%). According to the GSS, the proportion of incidents reported to police in 2014 was slightly lower than that recorded in 2004 (34%) but unchanged from 2009 (Table 9).
In general, the more serious an incident, the greater the likelihood it came to the attention of the police. Thus, robberies, break-ins and thefts of motor vehicle or parts were reported to police at least 44% of the time (Table 9, Chart 13 and Chart 14). Incidents causing injury (45%), those involving a weapon (53%) or those that resulted in financial loss of $1,000 or more (70%) were also more likely to be reported.
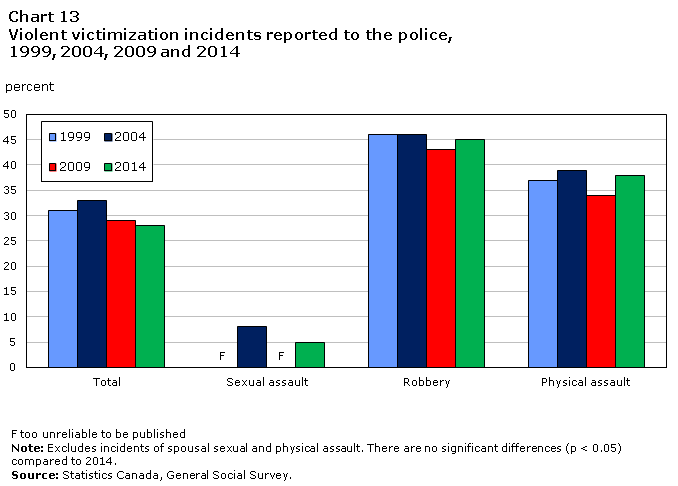
Sexual assault was the notable exception to this trend. Despite being the most serious offence measured by the GSS, only 5% of sexual assaults were brought to the attention of the police in 2014, a proportion not significantly different from that recorded a decade earlier (8%).
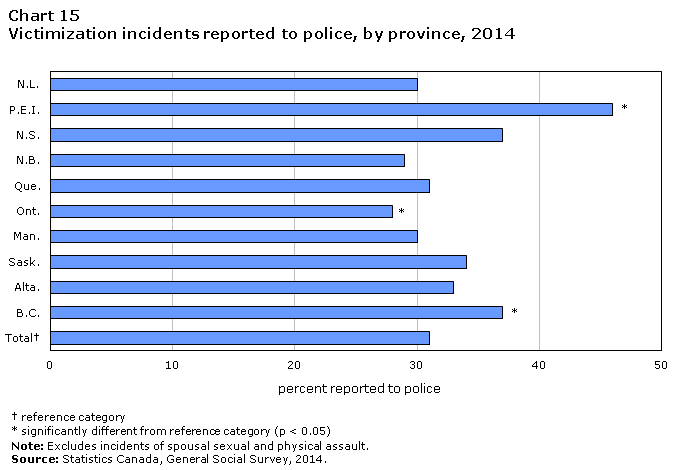
Ontario had the lowest rate of reporting to the police of all provinces
Among the provinces, Ontario recorded the lowest rate of reporting to the police (28%). This difference is based primarily on low reporting rates for household victimization (32% compared to 36% for all provinces), since the rates of reporting violent incidents and thefts of personal property in Ontario were relatively similar to the rates for the provinces as a whole. In contrast, Prince Edward Island (46%) and British Columbia (37%) had the highest rates of reporting incidents to the police. The reporting rates in the other provinces were not statistically different from the national average (Chart 15).
Victims who did not report an incident often felt it was not important enough
The majority (78%) of victims who did not bring the incident to the attention of the police felt that it was, among other reasons, too minor to be worth taking the time to report. In about two in five victimization incidents (43%), this was the main reason the incident was not reported. The trend was the same for all crimes, although the proportions were smaller for violent offences (Table 10).
The reasons for not bringing an incident to the attention of the police varied somewhat depending on the type of crime. For example, a number of violent crime victims felt that it was a personal matter (63%), or did not want to get the offender in trouble (27%) or feared revenge (18%), all reasons that might be related to the fact that many victims knew their attacker. Some 12% of sexual assault victims also stated that they did not want to bring shame or dishonour to their family.
Reasons for not reporting incidents of household victimization to police appeared to be primarily linked to a somewhat low expectation of results. For example, many victims believed that the police would not consider the incident important enough (66%), that they would not be able to identify the perpetrator or find the property stolen (65%), or that there was a lack of evidence for meaningful police action (61%).
Lastly, victims of violent crime and property crime who did not report their victimization to the police gave reasons related to their expectations of the justice system. In particular, 38% of victims believed that the offender would not be adequately punished, 34% believed that the police would not be effective, 25% feared or did not want the hassle of dealing with the court process, and 17% stated they had received unsatisfactory service from the police in the past.
Women more likely than men to make use of victim services
In addition to the police, crime victims may seek assistance from other formal services such as crisis centres, victim services, women’s centres, psychologists or social workers. Victims of household crimes or thefts of personal property rarely turned to these services, but 14% of violent crime victims contacted at least one such source of support, most often a psychologist or social worker. Women who were victims of violence were more than twice as likely as men to make use of one of these services (19% compared to 7%).
A number of victims also confided in other people, such as family, friends, colleagues, clergy members, spiritual advisors, lawyers or doctors. The majority of victims (91%) of a crime, whether violent or property, talked about it after the incident.
Summary
Victimization rates, according to the GSS, in 2014 were lower than those recorded 10 years ago for almost all measured crimes, sexual assault being the only notable exception. In general, victimization rates tended to be lower in the eastern provinces and higher in the western provinces.
In 2014, the GSS included new questions on childhood maltreatment as well as more detailed questions on drug use, homelessness and disabilities, including mental or psychological disabilities. All these factors were found to be strongly associated with the risk of violent victimization, as were binge drinking, low social cohesion and being young. All of these factors also helped to explain higher violent victimization rates among Aboriginal males but could not completely explain higher rates experienced by Aboriginal females.
New questions were also added to the GSS in 2014 to better measure the consequences of victimization, including questions based on the Primary Care Post-Traumatic Stress Disorder Screen (PC-PTSD) tool. These questions revealed that one in seven violent crime victims suffered symptoms consistent with a suspected PTSD.
Less than one in three (31%) criminal incident was reported to the police in 2014. This proportion was slightly lower than that recorded ten years earlier (34%). Among all measured offences, sexual assault was the least likely to be reported to police, with just one in twenty being brought to the attention of the police.
Detailed data tables
Table 1 Victimization incidents reported by Canadians, by type of offence, 1999, 2004, 2009 and 2014
Table 2 Victimization incidents reported by Canadians, by type of offence and province, 2014
Table 3 Victimization incidents reported by Canadians, by census metropolitan area, 2014
Table 10 Reasons for not reporting victimization incidents to the police, by type of offence, 2014
Model 1 Logistic regression: risk of violent victimization, by selected characteristics, 2014
Model 2 Logistic regression: risk of household victimization, by selected characteristics, 2014
References
Allen, M. 2015. “Police-reported hate crime in Canada, 2013.” Juristat. Vol. 35, no. 1. Statistics Canada Catalogue no. 85-002-X.
Boyce, J. 2015. “Mental health and contact with police in Canada, 2012.” Juristat. Vol. 35, no. 1. Statistics Canada Catalogue no. 85-002-X.
Brown, B.B., D.D. Perkins and G. Brown. 2004. “Incivilities, place attachment and crime: Block and individual effects.” Journal of Environmental Psychology. Vol. 24. p. 359- 371.
Charron, M. 2009. “Neighbourhood characteristics and the distribution of police-reported crime in the city of Toronto.” Crime and Justice Research Paper Series. No. 18. Statistics Canada Catalogue no. 85-561-M.
Cohen, L.E. and Felson, M. 1979. “Social change and crime rate trends: A routine activity approach.” American Sociological Review. Vol. 44, no 4. p. 588-608.
Desai, S., Arias, I., Thompson, M. P. and K. C. Basile. 2002. “Childhood victimization and subsequent adult revictimization assessed in a nationally representative sample of women and men.” Violence and Victims. Vol. 17, no. 6. p. 639-653.
Forrest, R. and A. Kearns. 2001. “Social cohesion, social capital and the neighborhood.” Urban Studies. Vol. 38. p. 2125-2143.
Garofalo, J. and J. Laub. 1979. “Fear of crime: Broadening our perspective.” Victimology. Vol. 3, no. 3-4. p. 242-253.
Government of Canada. 2012. Government response to the report “The state of organized crime (March 2012).” From the Standing committee on Justice and Human Rights. (accessed September 2, 2015).
Justice Canada. 2013. “Victims rights: Enhancing criminal responses to better meet the needs of victims of crime in Canada.” Consultation on Victims Bill of Rights. Discussion paper. (accessed September 2, 2015).
Lilly, J.R., Cullen, F.T. and Ball, R.A. 2014. Criminological Theory, Context and Consequences. Sage publications. London.
Mihorean, K., Besserer, S., Hendrick, D., Brzozowski, J., Trainor, C. and Ogg, S. 2001. A Profile of Criminal Victimization: Results of the 1999 General Social Survey. Statistics Canada Catalogue no. 85-553-XIE.
Parks, S.E., Kim, K.H., Day, N.L., Garza, M.A. and C.A. Larkby. 2011. “Lifetime self-reported victimization among low-income, urban women: The relationship between childhood maltreatment and adult violent victimization.” Journal of Interpersonal Violence. Vol. 6, no. 6 p. 1111-1128.
Perreault, S. 2011. “Violent victimization of Aboriginal people in the Canadian provinces, 2009.” Juristat. Vol. 31, no. 1. Statistics Canada Catalogue no. 85-002-X.
Perreault, S. and S. Brennan. 2010. “Criminal victimization in Canada, 2009.” Juristat. Vol. 30, no. 2. Statistics Canada Catalogue no. 85-002-X.
Prins, A., Ouimette P., Kimberling, R., Cameron, R.P., Hugelshofer, D.S., Shaw-Hegwer, J., Thraikill, A., Gusman, F.D. and J.I. Sheikh. 2003. “The Primary Care PTSD screen (PC-PTSD): Development and operating characteristics.” Primary Care Psychiatry. Vol. 9, no. 1. p. 9-14.
Reid, J. A. and C. J. Sullivan. 2009. “A model of vulnerability for adult sexual victimization: The impact of attachment, child maltreatment and scarred sexuality.” Violence and Victims. Vol. 24, no. 4. p. 485-501.
Royal Canadian Mounted Police (RCMP). 2014. Missing and Murdered Aboriginal Women: A National Operational Overview.
Sampson, R. J. 2012. The Great American City: Chicago and the Enduring Neighborhood Effect. University of Chicago Press.
Statistics Canada. 2015. “Adult correctional statistics in Canada, 2013/2014.” Juristat. Vol. 35, no. 1. Statistics Canada Catalogue no. 85-002-X.
Weisel, D. L. 2004. “Burglary of single-family houses.” Problem-Oriented Guides for Police Problem-Specific Guides Series. No. 18. Office of community oriented policing services, U.S Department of Justice.
Wilcox, P., Jordan, C. E. and A.J. Pritchard. 2006. “Fear of acquaintance versus stranger rape as a “Master Status”: Towards refinement of the “Shadow of Sexual Assault.” Violence and Victims. Vol. 21, no. 3. p. 355-370.
Survey description
In 2014, Statistics Canada conducted the victimization cycle of the General Social Survey (GSS) for the sixth time. Previous cycles were conducted in 1988, 1993, 1999, 2004 and 2009. The purpose of the survey is to provide data on Canadians’ personal experiences with eight offences, examine the risk factors associated with victimization, examine rates of reporting to the police, assess the nature and extent of spousal violence, measure fear of crime, and examine public perceptions of crime and the criminal justice system.
This report is based on Cycle 28 of the General Social Survey (GSS) on Victimization conducted in 2014. The target population was persons aged 15 and over living in the 10 Canadian provinces, except for people living full-time in institutions. In 2014, the survey was also conducted in the three territories using a different sampling design; the results for these regions will be available in a separate report to be released in 2016.
Once a household was selected and contacted by phone, an individual 15 years or older was randomly selected to respond to the survey. An oversample of immigrants and youth was added to the 2014 GSS for a more detailed analysis of these groups.
In 2014, the sample size was 33,127 respondents. Of that number, 2,787 were from the oversample.
Data collection
Data collection took place from January to December 2014 inclusively. Responses were obtained by computer-assisted telephone interviews (CATI). Respondents were able to respond in the official language of their choice.
Response rates
The overall response rate was 52.9%, down from 61.6% in 2009. Non-respondents included people who refused to participate, could not be reached, or could not speak English or French. Respondents in the sample were weighted so that their responses represent the non-institutionalized Canadian population aged 15 and older.
Data limitations
As with any household survey, there are some data limitations. The results are based on a sample and are therefore subject to sampling errors. Somewhat different results might have been obtained if the entire population had been surveyed. This article uses the coefficient of variation (CV) as a measure of the sampling error. Estimates with a high CV (over 33.3%) were not published because they were too unreliable. In these cases, the symbol “F” is used in place of an estimate in the figures and data tables. Estimates with a CV between 16.6 and 33.3 should be used with caution and the symbol “E” is used. Where descriptive statistics and cross-tabular analyses were used, statistically significant differences were determined using 95% confidence intervals.
Notes
- Date modified: