
Publications
Aboriginal Peoples Survey, 2012
Inuit health: Selected findings from the 2012 Aboriginal Peoples Survey
Inuit health: Selected findings from the 2012 Aboriginal Peoples Survey

Archived Content
Information identified as archived is provided for reference, research or recordkeeping purposes. It is not subject to the Government of Canada Web Standards and has not been altered or updated since it was archived. Please "contact us" to request a format other than those available.
by Susan Wallace
![]()
- Introduction
- Health outcomes
- Health behaviours
- Social determinants of health
- Conclusions and future research
- Appendix A
- Notes
- References
Introduction
This paper provides basic health indicators for the Inuit population, as well as selected social determinants of health, based on results of the Aboriginal Peoples Survey 2012–Education and Employment. Topics covered include health status, chronic conditions, health behaviours, obesity, access to health care, food insecurity, housing, and culture and language.
About this study
Unless otherwise indicated, the data pertain to the Inuit population aged 15 and older. Data are presented for the total Inuit population, for those living in Inuit Nunangat (the Inuit homeland) and its four component regions, and for Inuit living outside Inuit Nunangat. The analysis in this report is based on a sample of 3,668 Inuit. Reported differences between Inuit living inside and outside Inuit Nunangat are statistically significant (p > 0.05). Direct comparisons are not made between the Inuit regions; however, 95% confidence intervals are shown in all charts. Where available and appropriate, comparable data are presented for the total population of Canada, and all differences are statistically significant unless otherwise stated.
Two estimates were considered to be significantly different from one another if their 95% confidence intervals did not overlap. This is a conservative approach, because statistical tests of significance can detect differences even when confidence intervals overlap. However, when comparing results from two different surveys, such as the 2012 APS and the 2012 Canadian Community Health Survey or the 2001 APS and 2012 APS, this approach is not considered conservative.
Responses of don't know, refusal, and not stated were excluded from the denominators in the calculation of estimates for 2012 and 2001.
Differences between the 2001 and 2012 Aboriginal Peoples Surveys are statistically significant unless otherwise stated. Readers should note that the two surveys used different methodologies. In addition, the 2001 survey did not include the community of Hopedale, Newfoundland and Labrador (Nunatsiavut). More information is available in the Aboriginal Peoples Survey, 2012: Concepts and Methods Guide and the 2001 APS Concepts and Methods Guide.
Estimates with coefficients of variation greater than 16.6% but less than or equal to 33.3% should be interpreted with caution; these are noted (E) throughout the report. Estimates with coefficients of variation greater than 33.3% were suppressed.
Sampling weights were applied to all analyses to account for the sample design, non-response and known population totals. A bootstrapping technique was used when calculating estimates of variance.
For information on survey design, target population, survey concepts and response rates, consult http://www.statcan.gc.ca/APS or the Aboriginal Peoples Survey, 2012: Concepts and Methods Guide.
Inuit population
Inuit are the original inhabitants of the Arctic, where they have lived for thousands of years and where they have developed a unique culture with distinct beliefs and practices (Inuit Tapiriit Kanatami, 2014a).
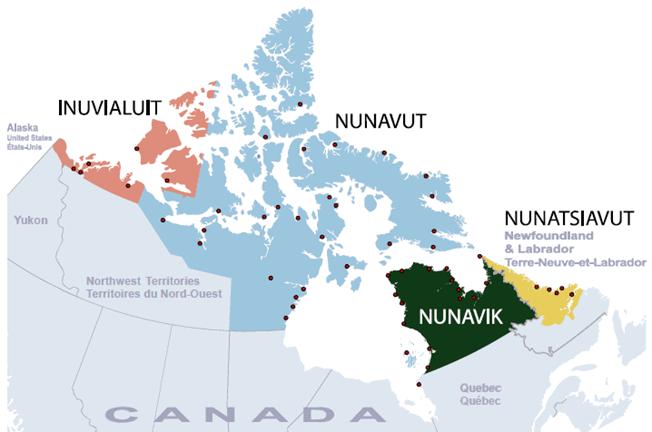
According to the National Household Survey, the Inuit population of Canada totalled just under 60,000 in 2011 (Table 1), an increase of 18% from 2006. Nearly three-quarters (73%) of Inuit lived in Inuit Nunangat, which is comprised of four regions: Nunatsiavut (Labrador); Nunavik (northern Quebec); Nunavut; and the Inuvialuit region (Northwest Territories).Note 1
The Inuit population is young, with a median age of 23 years in 2011 versus 40 years for Canadians overall. The median age of Inuit in Inuit Nunangat was slightly younger, at 22 years; those living outside Inuit Nunangat were older, with a median age of 26 years.Note 2
| Inuit region | ||||||||||||||
|---|---|---|---|---|---|---|---|---|---|---|---|---|---|---|
| Total | Inuit Nunangat | Nunatsiavut | Nunavik | Nunavut | Inuvialuit region | Outside Inuit Nunangat | ||||||||
| Age group and median age | number | percent | number | percent | number | percent | number | percent | number | percent | number | percent | number | percent |
| Total Population | 59,440 | 100 | 43,460 | 100 | 2,325 | 100 | 10,750 | 100 | 27,070 | 100 | 3,310 | 100 | 15,985 | 100 |
| Under 15 years | 20,160 | 34 | 15,380 | 35 | 570 | 25 | 3,975 | 37 | 9,910 | 37 | 925 | 28 | 4,780 | 30 |
| 15 years of age or older | 39,280 | 66 | 28,080 | 65 | 1,755 | 75 | 6,775 | 63 | 17,160 | 63 | 2,385 | 72 | 11,205 | 70 |
| 15 to 24 years | 11,950 | 20 | 9,005 | 21 | 445 | 19 | 2,305 | 21 | 5,595 | 21 | 660 | 20 | 2,950 | 18 |
| 25 to 54 years | 21,485 | 36 | 15,330 | 35 | 960 | 41 | 3,665 | 34 | 9,405 | 35 | 1,300 | 39 | 6,150 | 38 |
| 55 years or older | 5,855 | 10 | 3,750 | 9 | 350 | 15 | 805 | 7 | 2,160 | 8 | 435 | 13 | 2,105 | 13 |
| Median Age (years) | 23 | 22 | 29 | 21 | 21 | 26 | 26 | |||||||
| Source: Statistics Canada, National Household Survey, 2011. | ||||||||||||||
Compared with the population of Canada overall, Inuit face challenges in terms of physical and mental health and well-being (Gionet and Roshanafshar, 2013; Garner, Carrière, and Sanmartin, 2010).Note 3 Evidence of this health gap includes shorter life expectancy (Peters, 2013; Gionet and Roshanafshar, 2013) and higher infant mortality rates (Zhong-Cheng, Senécal, Simonet, Guimond, Penney and Wilkins, 2010).
According to the World Health Organization, health is strongly influenced by “the conditions in which people are born, grow, live, work and age, including the health system” (World Health Organization, 2013). It is not within the scope of this report to present all the social, economic, cultural and environmental conditions that are relevant for Inuit health, but a number of them are of specific concern, namely, health care access (Health Council of Canada, 2012; Archibald and Grey, 2000; O’Neil, Koolage, and Kaufert, 1988), food security (Chan, Fedliuk, Hamilton, Rostas, Caughey, Khnlein, Egeland and Loring, 2006; Lambden , Receveur, Marshall and Kuhnlein, 2006; Willows, 2005), housing (Tait, 2008; Young and Mollins, 1996), and culture and language (Loppie Reading and Wien, 2009; Richmond, Ross and Egeland, 2007; Kirmayer, Brass & Tait, 2000). Furthermore, income is generally regarded as the key social determinant of health (Tjepkema, Wilkins, Long, 2013; Commission on Social Determinants of Health, 2008; Auger, Raynault, Lessard and Choinière, 2004).
Health outcomes
Excellent or very good self-reported health
Self-reported health is a general measure of well-being that has been proven to be a reliable indicator of health across cultures and socio-economic circumstances (Burström, and Fredlund 2001; DeSalvo, Bloser, Reynolds, He and Muntner, 2005; Rohrer, Arif, Denison, Young and Adamson, 2007). According to the 2012 Aboriginal Peoples Survey (APS), 45% of Inuit reported excellent or very good health (Chart 1) while the comparable figure for the total population of Canada was 63% (Canadian Community Health Survey, 2012). A further 38% of Inuit reported good health, and 18%, fair or poor health.Note 4 Between 2001 and 2012, the percentage of Inuit who reported excellent or very good health fell from 56% to 45%.
In 2012, Inuit living in Inuit Nunangat were less likely to report excellent or very good health (40%) than were those who did not live in Inuit Nunangat (56%).

The prevalence of self-reported excellent or very good health tends to decline with advancing age. Whereas 54% of 15- to 19-year-old Inuit in Inuit Nunangat reported excellent or very good health, the percentage was 21% among those aged 55 and older (Chart 2). Outside Inuit Nunangat, more than two-thirds of Inuit in the 15-to-34 age range reported excellent or very good health, compared with 36%E of those aged 55 and older.
Chronic conditions
The APS defined a “chronic condition” as a long-term condition that is expected to last or has already lasted at least six months, and that was diagnosed by a health professional. In 2012, 43% of Inuit (47% of women and 39% of men) reported at least one chronic condition. Half of them had just one condition; 26% had two conditions; and the remaining 25%, three or more.
About a third (37%) of Inuit in Inuit Nunangat reported having been diagnosed with a chronic condition, compared with more than half (56%) of those living outside Inuit Nunangat (Chart 3).Note 5 These results must be interpreted cautiously. Reporting a chronic condition is contingent on having seen or talked to a health care professional. Because of limited access to health care providers in Inuit Nunangat (Gionet and Roshanafshar, 2013), the number of chronic conditions “diagnosed” and the number actually experienced by the Inuit may differ (see Access to Health Care, below). As well, some Inuit with serious conditions may leave Inuit Nunangat to obtain better access to medical care (Tjepkema, 2010; Institute of Urban Studies, 2004).
The likelihood of reporting a chronic condition rose with age from 32% of Inuit aged 15 to 24 to 68% of those aged 55 and older. As well, older Inuit were more likely than younger Inuit to report multiple chronic conditions. At age 55 and older, 38% of Inuit who had been diagnosed with at least one chronic condition reported three or more chronic conditions; at ages 15 to 24, the figure was 15%E. Note 6
Most prevalent conditions
The chronic conditions most commonly reported by Inuit were high blood pressure (12%), arthritis (12%), asthma (7%), and mood disorders (7%), such as depression or bipolar disorder (Table 2). Diabetes (excluding gestational diabetes) was reported by 5%. The vast majority (97%) of all cases of diabetes (including gestational diabetes) were Type 2 diabetes.
| Chronic conditions | |||||
|---|---|---|---|---|---|
| High blood pressure | Arthritis | Asthma | Diabetes (excluding gestational diabetes) | Mood disorder | |
| percent | |||||
| Total Inuit population | 12 | 12 | 7 | 5 | 7 |
| Inuit Nunangat | 10 | 9 | 5 | 3Note E: Use with caution | 5Note E: Use with caution |
| Nunatsiavut | 19 | 13 | 5Note E: Use with caution | 5Note E: Use with caution | 5 |
| Nunavik | 9 | 5Note E: Use with caution | 4Note E: Use with caution | 2Note E: Use with caution | 5 |
| Nunavut | 10 | 10 | 5Note E: Use with caution | 4Note E: Use with caution | 5 |
| Inuvialuit Region | 14 | 13 | 7 | 3Note E: Use with caution | 5Note E: Use with caution |
| Outside Inuit Nunangat | 15Note E: Use with caution | 17Note E: Use with caution | 13Note E: Use with caution | 7Note E: Use with caution | 13Note E: Use with caution |
| Total population of Canada (after age standardized) | 4 | 10 | 8 | 4 | 8 |
|
E use with caution Note: When the rates of selected chronic conditions for the total population of Canada are compared to the Inuit population, it is necessary to age-standardize the Canadian population to reflect the younger age structure of the Inuit population. Source: Statistics Canada, Aboriginal Peoples Survey, 2012; Canadian Community Health Survey, 2012. |
|||||
Health behaviours
Smoking cigarettes
The health risks of smoking are well established and include heart disease, oral and lung cancer, emphysema and bronchitis (Health Canada, 2013). In 2012, 16% of the total population of Canada aged 15 and older were daily smokers (Canadian Community Health Survey, 2012). According to the 2012 APS, half (52%) of Inuit aged 15 and older smoked cigarettes daily, and another 9% were occasional smokers (Chart 4).Note 7 The percentages of Inuit men and women who smoked daily, occasionally or not at all did not differ significantly.
Among Inuit in Inuit Nunangat, 63% were daily smokers (Chart 4), and another 10% were occasional smokers. Of the four regions, only Nunatsiavut’s rate of daily smoking (50%) was below that of Inuit Nunangat overall.Note 8 Daily smoking was less prevalent among Inuit living outside Inuit Nunangat—29% were daily smokers, and 8%E were occasional smokers.
Between 2001 and 2012, the prevalence of daily smoking among Inuit overall dropped from 61% to 52%. However, in Inuit Nunangat, the percentage who smoked cigarettes daily in 2012 (63%) was not significantly different from 2001 (66%).
Alcohol consumption
A third of Inuit (36% of women and 29% of men) had not consumed alcohol in the past 12 months. This was not significantly different from 2001. Between 2001 and 2012, the percentage of Inuit who had not consumed alcohol in the past 12 months fell from 41% to 33%.
Inuit living in Inuit Nunangat were more likely than were those living outside Inuit Nunangat to report non-consumption of alcohol: 40% versus 17%. The percentages who had not consumed alcohol in the previous 12 months were below the estimate for Inuit Nunangat as a whole in Nunavik (31%), the Inuvialuit region (31%) and Nunatsiavut (28%). In Nunavut, where a number of communities restrict or prohibit the sale and/or possession of alcohol (Wood, 2010), 46% of Inuit reported that they had not consumed alcohol in the past 12 months.
Heavy drinkingNote 9—five or more drinks on a single occasion at least once a month (Statistics Canada, 2013)—has been linked to health and social problems, including cancer, liver cirrhosis, Fetal Alcohol Spectrum Disorder, motor vehicle accidents, alcohol poisoning, family disruption, crime and violence (Health Canada, 2013). About a quarter (26%) of Inuit aged 15 and older reported heavy drinking—30% of men and 23% of women. In 2012, 18% of the total population of Canada aged 15 and older reported heavy drinking (Canadian Community Health Survey, 2012). In 2001, 26% of Inuit had reported heavy drinking, a percentage not significantly different from 2012.
Heavy drinking was equally prevalent in and outside Inuit Nunangat: 26% and 25%, respectively. The prevalence of heavy drinking varied by region: 47% in Nunatsiavut, 38% in the Inuvialuit region, and 34% in Nunavik, all of which were significantly higher than the estimate for Inuit Nunangat overall. Heavy drinking was reported by 20% of Inuit in Nunavut, significantly below the estimate for Inuit Nunangat overall.
Prevalence of obesity
Links between obesity and chronic conditions such as Type 2 diabetes, hypertension, cardiovascular disease, gallbladder disease and certain types of cancer have been well established (Navaneelan and Janz, 2014).
The APS found that 30% of Inuit aged 18 and over were overweight and 26% were obese, according to their Body Mass Index (BMI), which was calculated using self-reported height and weight.Note 10 Four in ten Inuit aged 18 and over, 42%, were within the category of “normal weight” and 3% were considered underweight. However, it should be noted that there is debate regarding whether standard BMI cut-off points are appropriate for the Inuit population (Charbonneau-Roberts, Saudny-Unterberger, Kuhnlein and Egeland, 2005; Young, Bjerregaard, Dewailly, Risica, Jorgensen and Ebbersson, 2007; Lear, Humphries, Frohlich and Birmingham, 2007).
Among Inuit aged 18 and over living within Inuit Nunangat, 28% of Inuit were overweight and 24% were obese while outside Inuit Nunangat, 32% were overweight and 31% were obese. The differences between Inuit living inside and outside Inuit Nunangat were not statistically significant.
Social determinants of health
According to Inuit Tapiriit Kanatami (2014b), a number of social determinants of health are particularly important for Inuit. Those most obviously associated with health outcomes are health care access, which pertains to the maintenance of health and treatment of illness, as well as food insecurity and housing, which are directly linked to income, a critical determinant of health for most populations (Raphael, 2009). For Inuit in particular, language, social support, and traditional activities are related to health through cultural continuity (Inuit Tapiriit Kanatami, 2014b).
Access to health care
Access to health care is often limited in Inuit communities, many of which are served by a health centre staffed by a nurse or nurse practitioner.Note 11 Moreover, recruitment, retention and training of health personnel are often issues that further hinder access to primary care (Health Council of Canada, 2012). To receive advanced diagnosis and treatment, many Inuit must leave their communities, sometimes for extended periods (Tjepkema, 2010; Institute of Urban Studies, 2004).
Contact with health professionals
Three-quarters (75%) of Inuit had seen or talked to at least one health professional (excluding dental professionals) in the year before their APS interview (Table 3). A larger percentage of women than men had consulted a health professional: 80% versus 68%. Inuit in Inuit Nunangat were less likely to have contacted a health professional in the past year than were those living outside Inuit Nunangat: 70% versus 84%.
Type of health professionals contacted
In the previous year, 59% of Inuit had seen or talked to a medical doctor, and 49% had seen or talked to a nurse (Table 3).Note 12 By comparison, 79% of all Canadians had consulted a medical doctor, and 12% had consulted a nurse (Canadian Community Health Survey, 2012).
Between 2001 and 2012, the percentage of Inuit who had consulted a doctor rose from 50% to 59%; the percentage who had consulted a nurse in 2012 did not differ significantly from 2001.
Inuit in Inuit Nunangat were less likely than those living outside Inuit Nunangat to have seen or talked to a doctor (49% versus 82%), but more likely to have seen or talked to a nurse. In fact, the percentage of Inuit in Inuit Nunangat who had contacted a nurse (58%) exceeded the percentage who had contacted a doctor (49%).
| Type of health professional | ||||||
|---|---|---|---|---|---|---|
| At least one health professional | Medical doctor of any type | Family doctor, general practitioner | Specialist | Nurse | Psychologist, social worker or counsellor | |
| percent | ||||||
| Total Inuit population | 75 | 59 | 54 | 23 | 49 | 17 |
| Total Inuit Nunangat | 70 | 49 | 42 | 20 | 58 | 14 |
| Nunatsiavut | 77 | 47 | 44 | 14 | 69 | 8 |
| Nunavik | 68 | 54 | 49 | 19 | 56 | 14 |
| Nunavut | 69 | 46 | 37 | 21 | 56 | 14 |
| Inuvialuit Region | 80 | 58 | 61 | 26 | 61 | 19 |
| Outside Inuit Nunangat | 84 | 82 | 81 | 70 | 31 | 24 |
| Total Canadian population | See note | 79 | 75 | 31 | 12 | Note ..: not available for a specific reference period |
|
.. not available for a specific reference period Note: The CCHS contains a more exhaustive list of health care professionals than the APS. As such, the indicator of ‘At least one health care professional’ is not comparable across surveys. Source: Statistics Canada, Aboriginal Peoples Survey, 2012; Canadian Community Health Survey, 2012. |
||||||
Regular medical doctor
In 2012, 39% of Inuit aged 15 and older (45% of women and 32% of men) had a regular medical doctor (family doctor, pediatrician or general practitioner); the corresponding figure for the total Canadian population aged 15 and older was 85% (Canadian Community Health Survey, 2012).
Fewer than a quarter (23%) of Inuit in Inuit Nunangat had a regular doctor, compared with 74% of those living outside Inuit Nunangat. The percentages varied by region from 19% in Nunatsiavut, Nunavut and the Inuvialuit region to 37% in Nunavik.
When Inuit who did not have a regular doctor were asked the reason, 65% of those in Inuit Nunangat reported that no doctors were available in the area; outside Inuit Nunangat, this reason was cited by 15%E.
Unmet health care needs
According to the 2012 APS, in the previous year, 14% of Inuit experienced a time when they felt they needed health care but did not receive it; this compared with 10% of the total population of Canada.
In Inuit Nunangat, 14% of Inuit did not receive health care when it was needed; outside Inuit Nunangat, the corresponding figure was 16%E, a difference that was not significant. Unmet health care needs were reported by 9% in Nunavik, a percentage lower than the estimate for Inuit Nunangat as a whole; for the other regions, the percentages did not differ significantly from the estimate for Inuit Nunangat as a whole.
Among Inuit who did not receive care, the most common reasons were that it was not available in the area (25%), and that it was not available at the time required (15%).
Contact with dental professionals
Inuit have limited access to dental care, a situation that has serious consequences for Inuit oral health (Inuit Oral Health Survey Report 2008-2009, 2011). Typically, communities are served by visiting dental professionals (dentists and hygienists) who have time to see only the most serious cases.
According to the 2012 APS, 56% of Inuit had seen a dental professional in the past year (Chart 7). Another 23% had seen a dental professional between one and three years earlier, and for 20%, their last contact had been more than three years earlier (or never).
In Inuit Nunangat, 50% of Inuit had seen a dental professional in the past year, compared with 69% of those living outside Inuit Nunangat.Note 13
Food insecurity
Food security is “when all people, at all times, have physical and economic access to sufficient, safe, and nutritious food to meet their dietary needs and food preferences for an active and healthy life (Food and Agricultural Organization, 1996).” The absence of food security (food insecurity) is a contributing factor to poor health, as it is associated with restricted mobility, multiple chronic conditions, and experiencing major depression and distress (Tarasuk, 2009). Moreover, food insecurity is a well-documented problem among Inuit (Rosol, Huet, Wood, Lennie, Osborne and Egeland, 2011). According to the Northern Food Basket, it costs $360 to $450 a week to provide healthy diet to a family of four living in northern regions, whereas the same basket of goods would cost $200 to $250 in southern Canada (Aboriginal Affairs and Northern Development Canada, 2014).
Food insecurity refers to situations, when, for example, the food that was purchased does not last, and there is not enough money to buy more; a household cannot afford to eat balanced meals; or household members cut the size of their meals or skip meals because there is not enough money for food.
In 2012, 41% of Inuit aged 15 and older lived in households that experienced food insecurity in the past 12 months (Chart 8).Note 14,Note 15 This compared with 8% of the total population of Canada.
More than half (53%) of Inuit in Inuit Nunangat lived in households that experienced food insecurity, compared with 17% of those outside Inuit Nunangat. The prevalence of household food insecurity varied by region: 56% in Nunavut, 55% in Nunavik, 45% in Nunatsiavut and 32% in the Inuvialuit region.
One in five (22%) Inuit reported that in the previous 12 months they had personally been hungry because they could not afford enough food (Chart 8). The figure was 27% for Inuit in Inuit Nunangat, compared with 13%E for those living outside Inuit Nunangat.
HousingNote 16
Poor housing conditions have been linked to health problems such as the spread of infectious diseases and respiratory tract infections in infants, and to social problems such as violence and low achievement in school (Inuit Tapiriit Kanatami, 2007).
More than one person per room is a measure of “crowding.” The 2011 National Household Survey found that 25% of Inuit lived in households with more than one person per room (Chart 9), compared with 3% of the total population of Canada.Note 17 Nonetheless, the percentage of Inuit in homes with more than one person per room was down from 29% in 2001.
In Inuit Nunangat, 33% of Inuit lived in houses with more than one person per room in 2011; among Inuit outside Inuit Nunangat, the figure was 5%. Percentages were highest in Nunavik (43%) and Nunavut (34%); percentages were lower in the Inuvialuit region (15%) and Nunatsiavut (13%), but still more than double the estimate for Inuit living outside Inuit Nunangat.
In 2011, 29% of Inuit, compared with 7% of the total population of Canada (Chart 9), lived in dwellings that needed major repairs to, for example, correct defective wiring or plumbing or structural problems with walls, floors and ceilings. The percentage of Inuit living in homes needing major repairs was higher in 2011 than in 2001 (22%).
More than a third (35%) of Inuit in Inuit Nunangat lived in dwellings that needed major repairs, compared with 15% of those outside Inuit Nunangat. The percentage of Inuit in dwellings needing major repairs ranged from 30% in the Inuvialuit region to 39% in Nunavik.
Culture and language
Inuit health and well-being are strongly tied to culture (Inuit Tapiriit Kanatami, 2014b; Loppie Reading and Wien, 2009; Richmond, Ross and Egeland, 2007). The 2012 APS collected information on a number of aspects of culture including language use, community ties, and traditional activities such as hunting, fishing, trapping and gathering wild plants.
Language
In 2012, 55% of Inuit reported that they could speak an Inuit language very well or relatively well, down from 65% in 2001 (Chart 10). The figure was 75% among Inuit living in Inuit Nunangat, compared 10%E among those outside Inuit Nunangat. The percentages who could speak an Inuit language very well or relatively well ranged from 18% in the Inuvialuit region to 96% in Nunavik.
In most regions, Inuit aged 55 and older were more likely than those aged 15 to 24 to report the ability to speak an Inuit language very well or relatively well: 95% versus 64% in Nunavut; 51% versus 9%E in Nunatsiavut, and 43% versus 11%E in the Inuvialuit region. In Nunavik, the percentages were nearly identical at 96% and 95%.
Family and community
Family and community are central components of Inuit identity and culture (Inuit Tapiriit Kanatami, 2014a). As well, social support and connectedness can contribute to better health outcomes (Richmond, Ross and Egeland, 2007; Chief Public Health Officer, 2008).
Two-thirds of Inuit, 66%, rated their ties with family members in other households as very strong or strong (Chart 11). The percentage reporting very strong or strong ties among family members was higher in Inuit Nunangat (70%) than outside Inuit Nunangat (57%).
Two-thirds (66%) of Inuit reported that in a time of need they would turn only to family members for support; 22% reported they would turn to both family and non-relatives. Fewer than 10% of Inuit would turn only to non-relatives, and 5% reported that they had no one to whom they could turn.Note 18
Hunting, fishing, trapping or gathering
According to the APS, 74% of Inuit (81% of men and 68% of women) had hunted, fished, trapped or gathered wild plants in the 12 months before their interview (Chart 12). Fully 82% of Inuit living in Inuit Nunangat had engaged in these activities, compared with 55% of those outside Inuit Nunangat.
The most common reasons for hunting, fishing, trapping or gathering were for personal or family use (95%), for pleasure (82%), and to share with others in the community (64%). Only 14% of Inuit reported that they engaged in these activities for money or to supplement income.Note 19
Income
Income is one of the most important social determinants of health (Tjepkema, Wilkins, Long, 2013; Commission on Social Determinants of Health, 2008; Auger et al., 2004). People with lower incomes generally experience worse health outcomes, including shortened life expectancy and a higher prevalence of disease (Tjepkema, Wilkins, Long, 2013; Commission on Social Determinants of Health, 2008).
According to the 2011 National Household Survey, the median household income for Inuit in 2010 was $74,021 while the median household income for the total population of Canada $74,777.Note 20, Note 21 In Inuit Nunangat, the household income was $77,935; outside Inuit Nunangat it was $64,215 (see chart 13).
While the median household income for Inuit inside Inuit Nunangat is higher than the median household income for Inuit outside of Inuit Nunangat, as well as for the total population of Canada, the cost of living in the north is substantially higher than that of southern Canada (Aboriginal Affairs and Northern Development Canada, 2014; Rogan, 2003). In addition, according to the NHS, households in Inuit Nunangat are larger than outside Inuit Nunangat. The median household size in Inuit Nunangat is 5 people while for the total population of Canada, the median household size is 3 people. In essence, while the median household income in Inuit Nunangat is higher than the median household income of the total population of Canada, there is actually less income per person than outside Inuit Nunangat.
Conclusions and future research
Conclusions
This report presents an overview of health status, health behaviours, access to health care and selected factors associated with health outcomes for the Inuit population aged 15 and older. A major element of the report is the geographic breakdown, which makes it possible to examine data for Inuit living in Inuit Nunangat (the Inuit homeland) and those living elsewhere. This is an important distinction, as the results for the two groups are generally significantly different.
Fewer than half of Inuit reported excellent or very good health, and those in Inuit Nunangat were less likely to report excellent or very good health than were those living elsewhere. More than four in ten Inuit had been diagnosed with a chronic condition by a health professional. Inuit living outside of Inuit Nunangat were more likely than those living in Inuit Nunangat to report a chronic condition, a difference that is likely associated with differences in access to health care professionals. Daily smoking was reported by 63% of Inuit living in Inuit Nunangat, compared with 29% of those outside Inuit Nunangat. Inuit living in Inuit Nunangat were more likely than were those living outside Inuit Nunangat to report non-consumption of alcohol. However, nearly identical percentages of Inuit living in and outside Inuit Nunangat―about one quarter―reported heavy drinking.
Inuit in Inuit Nunangat were more likely than those outside Inuit Nunangat to have experienced food insecurity and hunger, to live in dwellings needing major repair and with more than one person per room, to speak an Inuit language, and to have hunted, fished, trapped or gathered.
Future research
For Aboriginal people, including Inuit, health is a holistic concept encompassing not only the absence of disease, but also “physical, spiritual, mental, economic, emotional, environmental, social and cultural wellness of the individual, family, and community” (BC Ministry of Health, 2002).
While a number of social determinants of health were described in this report, each determinant could be examined individually through more in-depth analysis. Furthermore, many social determinants of health, both general and specific to Inuit, were not included in this analysis, such as education and livelihoods. Finally, mental health indicators could be explored as health outcomes and as social determinants of health.
In addition, social determinants of health are best understood in a multivariate context that accounts for their interconnections and the ways in which they work together to affect health outcomes.
Future research might also adopt theoretical approaches such as a life course perspective or a gender perspective.
Appendix A
Item non-response rates, by Inuit region, Inuit population aged 15 years and over, 2012
| Inuit Region | ||||||||
|---|---|---|---|---|---|---|---|---|
| Total Inuit population | Inuit Nunangat | Nunatsiavut | Nunavik | Nunavut | Inuvialuit Region | Outside Inuit Nunangat | ||
| Variable | Description | percent | ||||||
| ALC_01 | Alcohol - Drank in past 12 months | 7.4 | 8.4 | 2.4 | 16.0 | 6.7 | 3.6 | 4.9 |
| AlC_03 | Alcohol - Drank in past 12 months- Five or more drinks one occasion - Frequency | 8.9 | 10.3 | 3.5 | 18.9 | 8.3 | 4.9 | 5.7 |
| CC2_01 | Chronic health conditions - Asthma | 6.7 | 7.5 | F | 14.6 | 5.7 | 3.6 | 4.9 |
| CC2_02 | Chronic health conditions - Arthritis | 7.0 | 7.8 | F | 14.9 | 6.2 | 3.5 | 5.0 |
| CC2_03A | Chronic health conditions - High blood pressure | 7.4 | 8.3 | 2.4 | 15.2 | 6.7 | 4.3 | 5.2 |
| CC2_05A | Chronic health conditions - Diabetes | 6.7 | 7.5 | 2.5 | 14.9 | 5.5 | 4.2 | 4.9 |
| CC2_09 | Chronic health conditions - Mood disorder | 7.0 | 7.9 | 2.2 | 15.7 | 5.9 | 4.5 | 4.9 |
| CS_02 | Strength of family ties - Family in different household in same community | 9.6 | 11.3 | 2.8 | 20.4 | 9.5 | 4.9 | 5.7 |
| DABLPRMS | Primary Aboriginal language spoken | 3.3 | 3.6 | F | 7.9 | 2.3 | 2.7 | 2.8 |
| DBMISTD | Body Mass Index - International standard | 15.4 | 19.6 | 4.8 | 28.2 | 19.6 | 5.9 | 5.8 |
| DCHRCON | Chronic health condition status | 8.0 | 9.2 | 2.8 | 17.2 | 7.2 | 5.9 | 5.0 |
| DCOMMSUP | Person to turn to for support | 8.2 | 9.3 | 3.1 | 17.6 | 7.4 | 4.1 | 5.6 |
| DCONSULT | Consulted health professional - Last 12 months | 6.8 | 7.6 | F | 15.9 | 5.3 | 4.9 | 4.9 |
| DFOODSEC | Level of food security in household | 9.3 | 10.9 | 4.0 | 21.1 | 8.4 | 4.5 | 5.4 |
| DSKILSPK | Primary Aboriginal language - Ability level for speaking | 3.4 | 3.6 | 0.4 | 8.1 | 2.3 | 2.5 | 2.8 |
| FS_06 | Food security - Hungry but could not afford food - Past 12 months | 7.4 | 8.4 | 3.1 | 18.2 | 5.7 | 3.8 | 5.2 |
| GH1_01 | Health status - Self-perceived | 6.1 | 6.8 | 2.0 | 13.9 | 4.9 | 3.4 | 4.7 |
| GH2_01 | Regular medical doctor | 6.5 | 7.3 | 1.8 | 14.1 | 5.7 | 3.3 | 4.8 |
| GH2_02A | No regular medical doctor - Reasons - No doctors available in area | 7.9 | 8.9 | 1.9 | 16.1 | 7.3 | 4.9 | 5.4 |
| GH2_03A | Health consultation - Family doctor/general practitioner | 7.4 | 8.4 | 1.8 | 16.0 | 6.5 | 5.5 | 4.9 |
| GH2_03B | Health consultation - Nurse | 7.0 | 7.9 | 1.8 | 16.3 | 5.6 | 4.7 | 4.9 |
| GH2_03C | Health consultation - Psychologist/social worker/counsellor | 6.9 | 7.7 | 2.1 | 16.0 | 5.6 | 3.8 | 4.9 |
| GH2_03D | Health consultation - Other doctor/specialist | 7.3 | 8.2 | 2.5 | 16.2 | 6.2 | 3.5 | 5.0 |
| GH2_04 | Dental professional - Last time visited | 9.5 | 11.4 | 3.3 | 19.8 | 9.7 | 5.5 | 5.3 |
| GH2_06 | Health care needed but not received in past 12 months | 7.7 | 9.0 | 2.4 | 16.4 | 7.4 | 3.9 | 4.9 |
| GH2_07A | Health care not received - Reasons - Not available in area | 8.4 | 9.8 | 2.4 | 17.1 | 8.4 | 4.6 | 4.9 |
| GH2_07B | Health care not received - Reasons - Not available when required | 8.4 | 9.8 | 2.4 | 17.1 | 8.4 | 4.6 | 4.9 |
| LAN_01 | Language - Speak Aboriginal language | 3.2 | 3.4 | F | 7.5 | 2.3 | F | 2.6 |
| LAN_03 | Language - Primary Aboriginal language spoken | 3.3 | 3.6 | F | 7.9 | 2.3 | 2.5 | 2.8 |
| SMK_01 | Smoking - Type of smoker | 6.8 | 7.6 | 2.2 | 15.2 | 5.7 | 3.3 | 4.9 |
| TA_03A | Hunting/fishing/trapping - Did in last year | 5.3 | 5.8 | F | 12.2 | 4.1 | 2.9 | 4.0 |
| TA_04A | Wild plants - Gathered in last year | 5.9 | 6.6 | F | 13.7 | 4.9 | 3.2 | 4.0 |
| F Too unreliable to be published. Source: Aboriginal Peoples Survey, 2012 |
||||||||
Notes
- Inuit of the Western Arctic are known as "Inuvialuit." In this report, the term “Inuit” includes Inuvialuit.
- Data for Inuit outside of Inuit Nunangat, as it represents less than 1% of the Canadian population, should be used with caution because of lower reliability. For additional information, please refer to the Aboriginal Peoples Reference Guide, National Household Survey, 2011.
- The World Health Organization defines health as a state of complete physical, mental and social well-being, not merely the absence of disease or infirmity. World Health Organization, 2013.
- Appendix A contains 2012 APS item non-response rates. For information, consult the Aboriginal Peoples Survey, 2012: Concepts and Methods Guide.
- Because of changes to the chronic conditions content, the overall chronic conditions indicator is not comparable between the 2001 and 2012 Aboriginal Peoples Surveys.
- The estimates for Inuit aged 15 to 24 and 25 to 54 who reported that they had been diagnosed with three or more chronic condition are not significantly different.
- The APS question was “At the present time, do you smoke cigarettes daily, occasionally or not at all?”
- The estimate for the Inuvialuit region is lower than that of Inuit Nunangat, but the difference is not statistically significant.
- Heavy drinking was determined using question ALC_03, which asked “How often in the past 12 months have you had five or more drinks on one occasion?” Response categories were Never, Less than once a month, Once a month, 2 to 3 times a month, Once a week, More than once a week.
- Research demonstrates that self-reported height and weight results in an underestimation of obesity, as respondents tend to overestimate height and underestimate weight (Navaneelan and Janz, 2014; Connor Gorber, Shields, Tremblay and McDowell, 2008).
- Nurse practitioners are registered nurses who have additional education and nursing experience (Canadian Nurses Association, 2014).
- Medical doctor includes family doctors, general practitioners and pediatricians, and specialists such as surgeons, allergists, orthopedists and psychiatrists.
- Data from 2001 are not directly comparable to 2012, as the 2006 question asked if the respondent had seen or talked to a dentist or orthodontist, while the 2012 question asked if the respondent had seen a dental professional.
- The APS collected information on household food insecurity through a series of questions focused on availability of food and the ability to purchase food. Information was not collected on the sharing of country food or initiatives such as community freezers.
- Data on food insecurity were not collected in 2006 or 2001.
- Other measures include the National Occupancy Standard (NOS), developed by the Canadian Mortgage and Housing Corporation, to determine if a dwelling has enough bedrooms for the size and composition of the household (Statistics Canada, 2014).
- Data from the National Household Survey (NHS) rather than the Aboriginal Peoples Survey are used because of reduced sampling variability in the NHS.
- Differences between Inuit Nunangat and outside Inuit Nunangat are not statistically significant.
- Percents do not add to 100% as respondents could identify more than one reason.
- Data from the 2011 NHS are used in place of data from the APS because of a reduced sampling variability in the NHS.
- The median income for a specified group of households is that amount which divides their income size distribution, ranked by size of income, into two halves.
E use with caution
References
Aboriginal Affairs and Northern Development Canada. 2010. Revised Northern Food Basket - Highlights of Price Survey Results for 2006, 2007 and 2008. Accessed April 7, 2014.
Archibald, L. and R. Grey. 2006. Evaluation of Models of Health Care Delivery in Inuit Regions. Ottawa. Inuit Tapiriit Kanatami.
Auger, N., M.-F. Raynault, R. Lessard and R. Choinière. 2004. “Income and health in Canada.” Social Determinants of Health: Canadian Perspectives, First Edition. Toronto. Canadian Scholars’ Press Inc. Edited by Dennis Raphael.
British Columbia Ministry of Health. 2002. “The health and well-being of Aboriginal people in British Columbia.” Provincial Health Officer’s Annual Report 2001. Victoria. British Columbia Ministry of Health.
Burström, B. and P. Fredlund. 2001. “Self rated health: Is it as good a predictor of subsequent mortality among adults in lower as well as in higher social classes?” Journal of Epidemiology and Community Health. 55(11):836-840.
Canadian Dental Association. 2014. Dental Care FAQs. Accessed April 7, 2014.
Canadian Nurses Association. 2014. Nurse Practitioners. Accessed June 24, 2014.
Chan, H. M., K. Fediuk, S. Hamilton, L. Rostas, A. Caughey, H. Kuhnlein, G. Egeland, and E. Loring. 2006. “Food security in Nunavut, Canada: Barriers and recommendations.” International Journal of Circumpolar Health. 65(5):416-431.
Charbonneau-Roberts, G, H. Saudny-Unterberger, H.V. Kuhnlein, and G. M. Egeland. 2005. ”Body mass index may overestimate the prevalence of overweight and obesity among the Inuit.” International Journal of Circumpolar Health. 64(2):163-9.
Chief Public Health Officer. 2008. The Chief Public Health Officer’s Report on the State of Public Health in Canada, 2008. Ottawa. Health Canada.
Commission on Social Determinants of Health. 2008. “Closing the gap in a generation: Health equity through action on the social determinants of health.” Final Report of the Commission on Social Determinants of Health. Geneva. World Health Organization.
DeSalvo, K. B., N. Bloser, K. Reynolds, J. He, and P. Muntner. 2005. “Mortality prediction with a single general self-rated health question: A meta-analysis.” Journal of General Internal Medicine. 21(3)267-275.
Food and Agricultural Organization of the United Nations. 1996. Rome Declaration on World Food Security. Accessed July 21, 2014.
Garner, R., G. Carrière, and C. Sanmartin. 2010. “The health of First Nations living off-reserve, Inuit, and Métis adults in Canada: The impact of socio-economic status on inequalities in health.” Health Research Working Paper Series. Statistics Canada Catalogue no. 82-622-X2010004.
Gionet, L., and S. Roshanafshar. 2013. “Select Health Indicators of First Nations People Living Off Reserve, Métis and Inuit.” Health at a Glance. Statistics Canada Catalogue no. 82-624-X201300111763.
Health Canada. 2013. Health Concerns – Alcohol. Accessed September 23, 2013.
Heath Canada. 2011. Health Concerns – Smoking and Your Body. Accessed September 23, 2013.
Health Canada. 2011. Inuit Oral Health Survey Report 2008-2009.
Health Canada. 2009. Healthy Living – Oral Health. Accessed July 23, 2014.
Health Council of Canada. 2012. Progress Report 2012: Health care renewal in Canada. Toronto.
Institute of Urban Studies. 2004. First Nations/Métis/Inuit Mobility Study: Final report. Winnipeg. University of Winnipeg.
Inuit Tapiriit Kanatami. 2014a. About Inuit. Ottawa. Accessed April 7, 2014.
Inuit Tapiriit Kanatami. 2014b. Social Determinants of Inuit Health in Canada: Discussion Paper (draft). Ottawa.
Inuit Tapiriit Kanatami. 2007. Social Determinants of Inuit Health in Canada: A discussion paper. Ottawa.
Kirmayer, L. J., G. M. Brass, and C. L. Tait. 2000. “The mental health of Aboriginal peoples: Transformations of identity and community.” Canadian Journal of Psychiatry. 45:607-616.
Lambden, J., O. Receveur, J. Marshall, and H. V. Kuhnlein. 2006. “Traditional and market food access in Arctic Canada is affected by economic factors.” International Journal of Circumpolar Health. 65(4):331-340.
Lear, S. A., K. H. Humphries, J. J. Frohlich, and C. Laird Birmingham. 2007. “Appropriateness of current thresholds for obesity-related measures among Aboriginal people.” Canadian Medical Association Journal. 177(12):1499-1505.
Loppie Reading, C., and F. Wien. 2009. Health Inequalities and Social Determinants of Aboriginal People’s Health. British Columbia. National Collaborating Centre for Aboriginal Health.
Navaneelan, T. and T. Janz. 2014. “Adjusting the scales: Obesity in the Canadian population after correcting for respondent bias.” Health at a Glance. Statistics Canada Catalogue no. 82-624-X201400111922.
O’Neil, J. D., W.W. Koolage, and J. M. Kaufert. 1988. “Health communication problems in Canadian Inuit communities.” Arctic Medical Research. 41(supp 1): 374-378.
Peters, P. A. 2013. “An age- and cause-decomposition of differences in life expectancy between residents of Inuit Nunangat and residents of the rest of Canada, 1989 to 2008.” Health Reports. Statistics Canada Catalogue no. 82-003-X, Vol. 24, No. 12.
Richmond, C. A. M., N. A. Ross and G. M. Egeland. 2007. “Social support and thriving health: A new approach to understanding the health of indigenous Canadians.” American Journal of Public Health. 97(9):1827-1833.
Rogan, A. 2003. Addressing the Cost of Living in Nunavut: Discussion Paper Four. Iqaluit. Nunavut Employees Union.
Rohrer, J. E., A. Arif, A. Denison, R. Young, and S. Adamson. 2007. “Overall self-rated health as an outcome indicator in primary care.” Journal of Evaluation in Clinical Practice. 13(6):882-888.
Rosol, R., C. Huet, M. Wood, C. Lennie, G. Osborne, and G. M. Egeland. 2011. “Prevalence of affirmative responses to questions of food insecurity: International Polar Year Inuit Health Survey, 2007–2008.” International Journal of Circumpolar Health. 70(5): 488-497.
Shields, M., S. Connor Gorber and M.S. Tremblay. 2008. “Estimates of obesity based on self-report versus direct measures.” Health Reports. Statistics Canada Catalogue no. 82-003-X, Vol. 19, no. 2.
Statistics Canada. 2014. “Persons per room of private household.” Definitions, data sources and methods. Accessed June 24, 2014.
Statistics Canada. 2013. “Heavy drinking, 2012.” Health Fact Sheets. Statistics Canada Catalogue no. 82-62-X.
Tait, H. 2008. Aboriginal Peoples Survey, 2006: Inuit Health and Social Conditions. Statistics Canada Catalogue no. 89-637-X2008001.
Tarasuk, V. 2009. “Health implications of food insecurity.” Social Determinants of Health: Canadian Perspectives, Second Edition. Edited by Dennis Raphael. Toronto. Canadian Scholars’ Press Inc.
Tjepkema, M., R. Wilkins, and A. Long. 2013. “Cause-specific mortality by income adequacy in Canada: A 16-year follow-up study.” Health Reports. Statistics Canada Catalogue no. 82-003-X, Vol. 24, No. 7.
Tjepkema, M., R. Wilkins, S. Senécal, E. Guimond, and C. Penney. 2010. “Mortality of urban Aboriginal adults in Canada, 1991–2001.” Chronic Diseases in Canada, 31(1), 4-21.
Willows, N. D. 2005. “Determinants of healthy eating in Aboriginal peoples in Canada: The current state of knowledge and research gaps.” Canadian Journal of Public Health. 96(suppl 3):S32-S36.
Wood, D. S. 2011. “Alcohol controls and violence in Nunavut: A comparison of wet and dry communities.” International Journal of Circumpolar Health. 70(1):19-28.
World Health Organization. 2013. Social Determinants of Health. Accessed April 7, 2014.
Young, T.K., P. Bjerregaard, E. Dewailly, P. M. Risica, M. E. Jorgensen, and S. E. O. Ebbersson. 2007. “Prevalence of obesity and its metabolic correlates among the circumpolar Inuit in 3 countries.” American Journal of Public Health. 97(4):691-5.
Young, T. K., and C. J. Mollins. 1996. “The impact of housing on health: An ecological study from the Canadian Arctic.” Arctic Medical Research. 55(2): 52-61.
Zhong-Cheng, L., S. Senécal, F. Simonet, E. Guimond, C. Penney, and R. Wilkins. 2010. Birth Outcomes in the Inuit-inhabited Areas of Canada. Unpublished Statistics Canada supplementary document.
- Date modified: