
Quarterly Demographic Estimates
January to March 2017

Archived Content
Information identified as archived is provided for reference, research or recordkeeping purposes. It is not subject to the Government of Canada Web Standards and has not been altered or updated since it was archived. Please "contact us" to request a format other than those available.
Highlights
- On April 1, 2017, Canada’s population was estimated at 36,591,241.
- Between January 1 and March 31, 2017, Canada’s population grew by 88,144 (+0.2%).
- Canada’s population growth in the first quarter of 2017 was mainly due to international migration (+68,278).
- Nunavut had the highest rate of population growth (+0.5%) during this period.
- During the first quarter of 2017, interprovincial migratory increase remained negative in Alberta for the sixth consecutive quarter, a first since the late 1980s.
Analysis
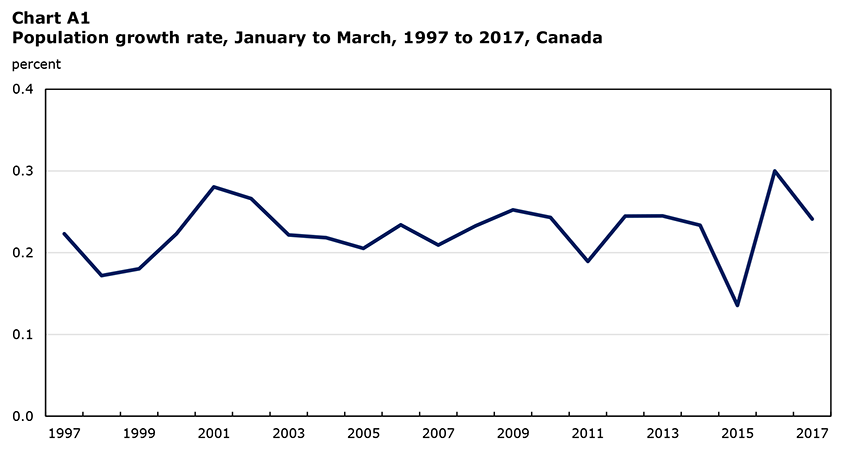
Canada’s population continues to grow at a steady pace
According to preliminary estimates, Canada’s population was estimated at 36,591,241 on April 1, 2017, up 88,144 from January 1, 2017. This population growth was higher than what is generally observed during the first three months of the year (+78,685 on average over the past 10 years). However, population growth during the first quarter of 2017 was lower than during the same quarter the previous year (+108,265), when population growth was particularly strong.
Data table for Chart A1
| year | percent |
|---|---|
| 1997 | 0.22 |
| 1998 | 0.17 |
| 1999 | 0.18 |
| 2000 | 0.22 |
| 2001 | 0.28 |
| 2002 | 0.27 |
| 2003 | 0.22 |
| 2004 | 0.22 |
| 2005 | 0.21 |
| 2006 | 0.23 |
| 2007 | 0.21 |
| 2008 | 0.23 |
| 2009 | 0.25 |
| 2010 | 0.24 |
| 2011 | 0.19 |
| 2012 | 0.24 |
| 2013 | 0.25 |
| 2014 | 0.23 |
| 2015 | 0.14 |
| 2016 | 0.30 |
| 2017 | 0.24 |
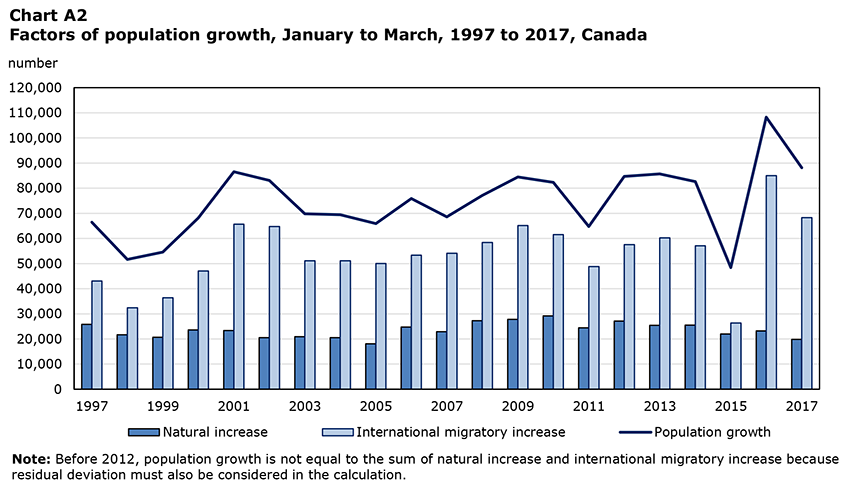
International migration accounts for most of the population growth
Population growth at the national level is based on two factors: natural increase Note 1 and international migratory increase, Note 2 while provincial and territorial population estimates also factor in interprovincial migratory increase.
International migratory increase remained the main driver of population growth, estimated at 68,278 between January 1 and March 31, 2017. The number of immigrants admitted into Canada during this period (+72,788) was the second highest for a first quarter, surpassed only by last year’s record numbers (+86,201). Similarly, the number of non-permanent residents grew by 9,153 during the first quarter of 2017, compared with an increase of 12,488 during the same period in 2016. The components of net emigration (emigration, return emigration and net temporary emigration) remained stable.
According to preliminary estimates, natural increase in the first quarter of 2017 was 19,866, or the difference between 94,851 births and 74,985 deaths.
Data table for Chart A2
| year | Natural increase | International migratory increase | Population growth |
|---|---|---|---|
| number | |||
| 1997 | 25,859 | 43,080 | 66,476 |
| 1998 | 21,687 | 32,449 | 51,674 |
| 1999 | 20,658 | 36,381 | 54,579 |
| 2000 | 23,615 | 47,030 | 68,158 |
| 2001 | 23,364 | 65,652 | 86,555 |
| 2002 | 20,546 | 64,733 | 83,104 |
| 2003 | 20,909 | 51,107 | 69,841 |
| 2004 | 20,531 | 51,112 | 69,445 |
| 2005 | 18,075 | 50,030 | 65,934 |
| 2006 | 24,736 | 53,349 | 75,912 |
| 2007 | 22,941 | 54,104 | 68,582 |
| 2008 | 27,286 | 58,364 | 77,094 |
| 2009 | 27,786 | 65,141 | 84,465 |
| 2010 | 29,194 | 61,556 | 82,289 |
| 2011 | 24,418 | 48,786 | 64,741 |
| 2012 | 27,101 | 57,564 | 84,665 |
| 2013 | 25,445 | 60,272 | 85,717 |
| 2014 | 25,502 | 57,116 | 82,618 |
| 2015 | 22,018 | 26,396 | 48,414 |
| 2016 | 23,239 | 85,026 | 108,265 |
| 2017 | 19,866 | 68,278 | 88,144 |
| Note: Before 2012, population growth is not equal to the sum of natural increase and international migratory increase because residual deviation must also be considered in the calculation. | |||
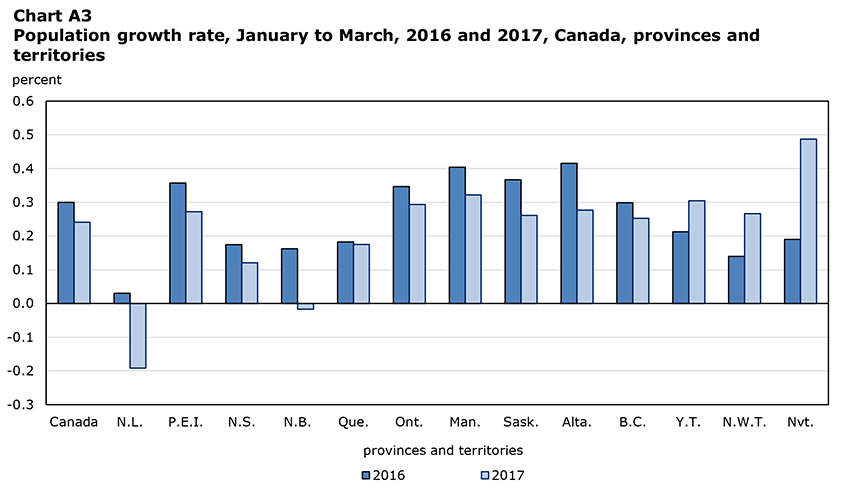
Population growth everywhere except in Newfoundland and Labrador and New Brunswick
During the first quarter of 2017, population growth Note 3 was positive in all provinces and territories, except Newfoundland and Labrador, where the population declined (-0.2%), and New Brunswick, where the population remained relatively stable. Nunavut had the highest rate of population growth (+0.5%) in Canada. Moreover, the population growth rate was 0.3% in Prince Edward Island, Ontario, the Prairies, and British Columbia. Population growth in these provinces was stronger than in all of Canada (+0.2%).
Compared with the same period last year, population growth rates fell slightly in each of the Atlantic provinces and in the Prairies, and remained stable in Quebec, Ontario, and British Columbia. These rates rose in the territories.
Data table for Chart A3
| provinces and territories | 2016 | 2017 |
|---|---|---|
| percent | ||
| Canada | 0.3 | 0.2 |
| N.L. | 0.0 | -0.2 |
| P.E.I. | 0.4 | 0.3 |
| N.S. | 0.2 | 0.1 |
| N.B. | 0.2 | 0.0 |
| Que. | 0.2 | 0.2 |
| Ont. | 0.3 | 0.3 |
| Man. | 0.4 | 0.3 |
| Sask. | 0.4 | 0.3 |
| Alta. | 0.4 | 0.3 |
| B.C. | 0.3 | 0.3 |
| Y.T. | 0.2 | 0.3 |
| N.W.T. | 0.1 | 0.3 |
| Nvt. | 0.2 | 0.5 |
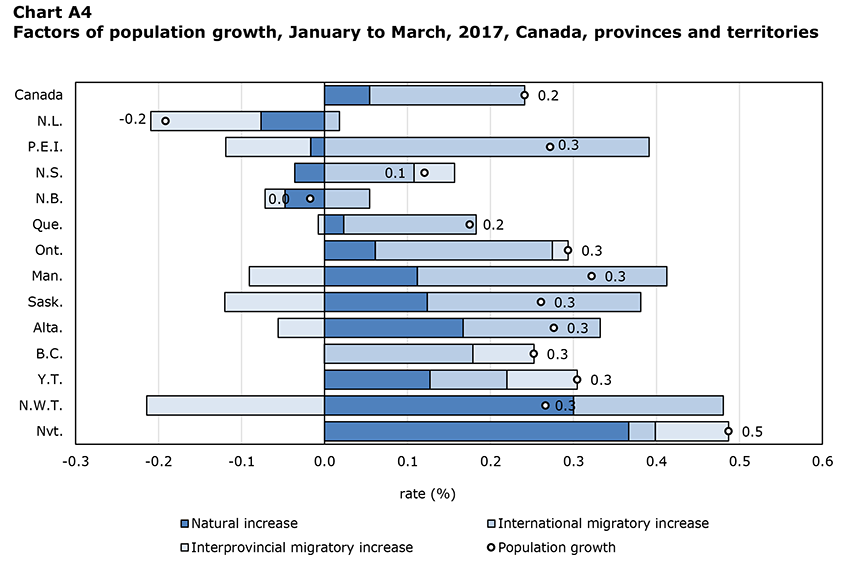
International migration is the main driver of growth in almost all provinces
During the first quarter of 2017, international migratory increase was the main driver of growth in all provinces except Alberta, where natural increase accounted for most of the growth. Growth in the three territories was also mainly attributable to natural increase.
International migratory increase was down slightly compared with the same quarter last year in all provinces, except Prince Edward Island, Quebec, and British Columbia. This was mainly due to lower immigration levels compared with the first quarter of 2016, when most provinces saw a record number of immigrants. Despite this decrease, immigration remained particularly strong in all the provinces during the first quarter of 2017, especially Prince Edward Island, which welcomed a record number of immigrants for a first quarter. In addition, for the January to March period, the number of immigrants arriving in the other Atlantic provinces, Quebec and the Prairie provinces has been exceeded only once in the past—during the same quarter last year.
Interprovincial migration was negative (-2,392) in Alberta for the sixth consecutive quarter, a first since the late 1980s when the province recorded net interprovincial migration losses for 10 consecutive quarters. Alberta’s migratory losses primarily benefitted British Columbia and Ontario. These two provinces continued to post the strongest interprovincial migration growth in absolute numbers (+2,702 in Ontario and +3,526 in British Columbia). The only other province with positive net interprovincial migration was Nova Scotia (+464), which was the highest growth for this province since the second quarter of 2003 (+999). Net interprovincial migration remained negative in Quebec (-633), but it has never come closer to zero since the fourth quarter of 2009 (+15).
Data table for Chart A4
| Natural increase | International migratory increase | Interprovincial migratory increase | Population growth | |
|---|---|---|---|---|
| rate (%) | ||||
| Canada | 0.05 | 0.19 | 0.00 | 0.24 |
| N.L. | -0.08 | 0.02 | -0.13 | -0.19 |
| P.E.I. | -0.02 | 0.39 | -0.10 | 0.27 |
| N.S. | -0.04 | 0.11 | 0.05 | 0.12 |
| N.B. | -0.05 | 0.05 | -0.02 | -0.02 |
| Que. | 0.02 | 0.16 | -0.01 | 0.18 |
| Ont. | 0.06 | 0.21 | 0.02 | 0.29 |
| Man. | 0.11 | 0.30 | -0.09 | 0.32 |
| Sask. | 0.12 | 0.26 | -0.12 | 0.26 |
| Alta. | 0.17 | 0.17 | -0.06 | 0.28 |
| B.C. | 0.00 | 0.18 | 0.07 | 0.25 |
| Y.T. | 0.13 | 0.09 | 0.08 | 0.30 |
| N.W.T. | 0.30 | 0.18 | -0.21 | 0.27 |
| Nvt. | 0.37 | 0.03 | 0.09 | 0.49 |
| Population | Population growth for the first quarter | ||||
|---|---|---|---|---|---|
| 2016 | 2017 | ||||
| number | rate (%) | number | rate (%) | ||
| Canada | 36,591,241 | 108,265 | 0.3 | 88,144 | 0.2 |
| N.L. | 528,683 | 161 | 0.0 | -1,013 | -0.2 |
| P.E.I. | 149,790 | 527 | 0.4 | 407 | 0.3 |
| N.S. | 953,173 | 1,653 | 0.2 | 1,149 | 0.1 |
| N.B. | 757,641 | 1,226 | 0.2 | -130 | 0.0 |
| Que. | 8,371,498 | 15,152 | 0.2 | 14,647 | 0.2 |
| Ont. | 14,135,610 | 48,172 | 0.3 | 41,443 | 0.3 |
| Man. | 1,332,629 | 5,291 | 0.4 | 4,283 | 0.3 |
| Sask. | 1,161,365 | 4,196 | 0.4 | 3,026 | 0.3 |
| Alta. | 4,291,980 | 17,558 | 0.4 | 11,853 | 0.3 |
| B.C. | 4,789,221 | 14,118 | 0.3 | 12,064 | 0.3 |
| Y.T. | 37,808 | 79 | 0.2 | 115 | 0.3 |
| N.W.T. | 44,381 | 62 | 0.1 | 118 | 0.3 |
| Nvt. | 37,462 | 70 | 0.2 | 182 | 0.5 |
- Date modified: