
Canadian Agriculture at a Glance
Innovation and healthy living propel growth in certain other crops

Archived Content
Information identified as archived is provided for reference, research or recordkeeping purposes. It is not subject to the Government of Canada Web Standards and has not been altered or updated since it was archived. Please "contact us" to request a format other than those available.
Skip to text
Text begins
Canadian farms are looking to grow profits by tapping into consumer trends geared toward healthy lifestyles.
With more emphasis placed on health-conscious agricultural products, farm operations are focusing on certain varieties of what’s known as “other crops” to try to meet consumer needs.
Typical field crops include wheat, oats and barley; while, apples, pears and plums are but a few examples of typical census fruit crops. Typical vegetable crops include varieties like sweet corn, tomatoes, and cucumbers.
In contrast, agricultural products such as caraway seed, hemp, lavender and coriander fall under “other field crops”, while examples of “other fruit crops” include agricultural products such as hazelnuts, currants and blackberries. Products such as herbs, rhubarb and melons, in turn, are examples of “other vegetable crops”.
The “other” commodities are collected by the Census program using write-in fields, which are then coded and grouped into similar product classes. This approach may result in the underreporting of some specific fields where producers have reported this production in a non-specific fashion. This article serves to highlight some of the popular “other” agricultural products and their development over the 2011-to-2016 intercensal period.
Other field crops
Known for its gluten-free composition and high protein content, quinoa saw sharp growth in crop area since 2011. Farms reporting quinoa saw total crop area increase in size from 312 acres in 2011 to 11,868 acres in 2016 (Chart 1).
Data table for Chart 1
| Other field crop | 2011 | 2016 |
|---|---|---|
| acres | ||
| Spelt | 10,526 | 15,958 |
| Quinoa | 312 | 11,868 |
| Hops | 97 | 789 |
| Fenugreek | 414 | 2,809 |
| Camelina | 1,161 | 2,703 |
| Hemp | 25,937 | 45,245 |
| Source: Statistics Canada, Census of Agriculture (3438). | ||
While quinoa’s predominant culinary usage is similar to rice, it also appears as an ingredient in pasta, breakfast cereals, snack foods, and baked goods.
The number of farms reporting quinoa also increased dramatically, rising from eight operations in 2011 to 118 in 2016.
During that same period, farms reporting fenugreek, an annual plant whose seeds are used for its medicinal benefits in treating digestive disorders, experienced similar growth. Fenugreek crop area grew almost seven times between 2011 and 2016, pushing total area from 414 acres to 2,809 acres (Chart 1).
An added benefit of fenugreek is its various culinary applications. While its seeds can be used in items such as curries, chutneys or ground into spices, its leaves can also be used in small quantities as flavouring herbs. Also, its seeds can be refined to produce essential oils for confectionary flavouring.
While hops are most normally associated with beer production, this “other field crop” is also used as a medicinal herb to help digestion and reduce tension. The total area of hops under cultivation grew from 97 acres in 2011 to 789 acres in 2016 (Chart 1).
Of note, total beer sales of Canadian products by value (data in thousands of Canadian dollars) steadily increased from $7,331,092 in 2011 to $7,568,616 by 2016.Note 1
Farms reporting “other field crops”, such as camelina and spelt, experienced positive growth as well.
Spelt is a form of wheat and a large proportion of it is grown under organic production methods for specialty markets. Farms reporting spelt crops totalled 15,958 acres in 2016, up from 10,526 acres in 2011 (Chart 1).
While fenugreek experienced a faster area growth than camelina since 2011, the total acreage of the two crops in 2016 was similar. Farms reporting fenugreek crops totalled 2,809 acres, while camelina amassed 2,703 acres in crop area (Chart 1).
Camelina has been garnering attention over the past few years, buoyed by its use as a healthy, edible oil. This oilseed crop is a good source of Omega-3 and Omega-6 fatty acids, which are proven to help lower high-blood pressure and cholesterol.
Camelina usage is not confined to strictly health-related endeavours. It is also utilized as fish food, as a lubricant, and has the potential to be used as a source of biofuel.
Another emerging “other field crop” which has seen strong growth is industrial hemp.
The number of farms reporting industrial hemp has increased from 132 in 2011 to 224 in 2016. During that same period, crop area expanded from 25,937 acres to 45,245 acres (Chart 1).
While both hemp and marijuana come from the same Cannabis Sativa plant, it is important to note that hemp produces low amounts (less than 0.3%) of Tetrahydrocannabino (THC), the ingredient in marijuana which has psychoactive effects.
Contrary to hemp’s association with marijuana, this “other field crop” boasts numerous nutraceutical benefits. Hemp oil contains high amounts of Omega-6 and Omega-3 essential fatty acids that help lower blood pressure and reduce the risk of cardiovascular disease. Hemp seeds, which are small nuts, possess essential amino acids which aid in muscle control, as well as brain and nerve function.
In addition to its medicinal benefits, industrial hemp offers various functional purposes. Hemp fibres are known for their strength and flexibility, making the plant an ideal bio-composite for automotive and aerospace parts. Moreover, hemp fibres are also quite absorbent, which can aid in oil and gas cleanups.
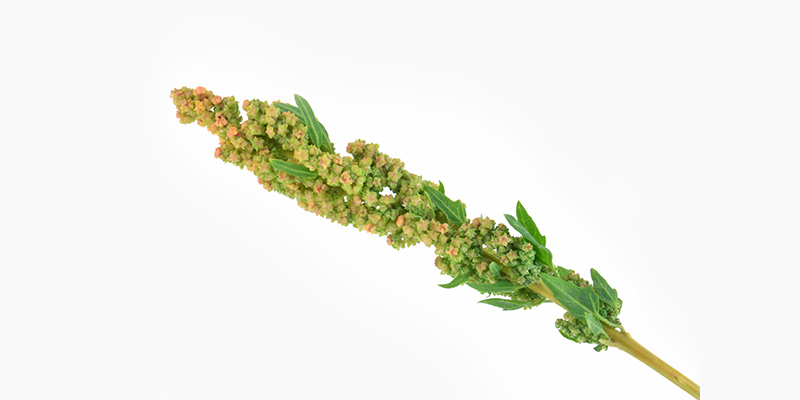
The quinoa plant is a close relative of the weed species lamb’s-quarters. Quinoa plants produce cereal-like seed grains 1.5 to 2 mm in diameter. The quinoa plant can grow 1 to 2 m tall and contains a woody central branch with small hairy leaves.
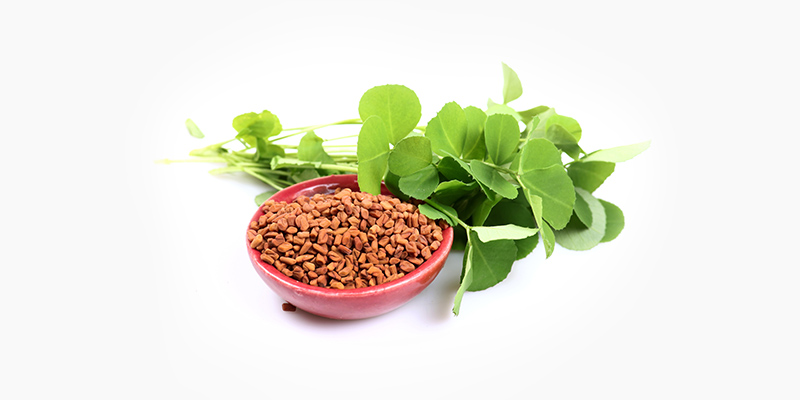
Fenugreek is an annual plant that can be grown as either a seed spice or herb. The plant can grow up to 50 cm tall and its green leaves can grow to span 5 cm. Its irregular, rectangular shaped seeds have a yellowish-brown color and span 4 to 6 mm in length.
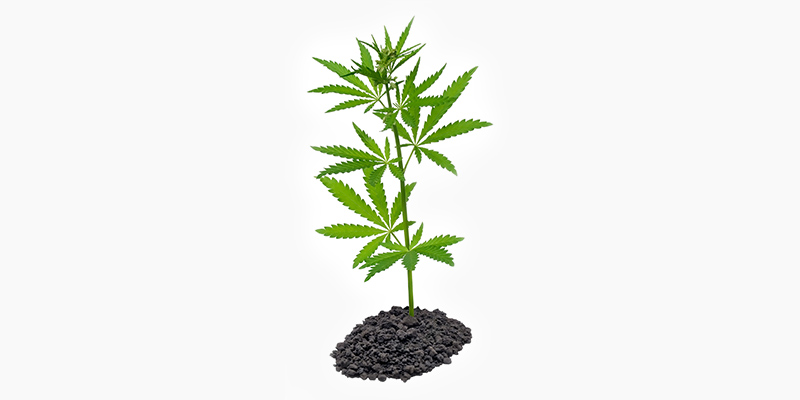
Industrial hemp is a tall, green, annual plant belonging to the Cannabaceae plant family. Its leaves are palmate with up to 11 leaflets. The plant ranges in height from 1.5 to 4 m tall and can produce a tap root from 15 to 30 cm in length. An important distinction between hemp and marijuana is the level of THC. Hemp regulations are administered by Health Canada and must have a THC amount lower than 0.3%.
Other fruit crops
Haskap and other berry crops experienced a substantial increase in the number of producers.
From 2011 to 2016, the number of farms reporting haskaps and other berry crops tripled, increasing to 549 participating farms.
Growth in this “other fruit crop” may be attributed to innovative scientific research, which has helped identify the haskap plant as a viable crop because of its ability to withstand frigid Canadian temperatures.
In addition to its winter hardiness, haskaps can be beneficial to one’s health. Its berries are high in both antioxidants and vitamins.
Another indication of the interest in haskaps and other berries, is its increase in crop area from 2011 to 2016. Farms reporting haskaps and other berries grew from 557 acres in 2011 to a crop area of 1,761 acres in 2016 (Chart 2).
Data table for Chart 2
| Other fruit crop | 2011 | 2016 |
|---|---|---|
| acres | ||
| Haskap and other berries | 556.6 | 1,761.1 |
| Sea buckthorn | 332.7 | 520.3 |
| Gooseberries | 32.0 | 41.9 |
| Kiwi | 63.5 | 57.5 |
| Currants | 504.0 | 427.2 |
| Source: Statistics Canada, Census of Agriculture (3438). | ||
There was also a sizeable increase in the number of farms growing sea buckthorn. Known for its pharmaceutical applications in skin therapy, farms reporting sea buckthorn doubled between 2011 and 2016, to total 126 farms.
Not only was it being grown on more farms, but the area devoted to the crop also rose 56.4% between 2011 and 2016 for a total crop area of 520 acres (Chart 2).
In addition to it medicinal roles sea buckthorn serves a number of food uses. Its berries can produce juices that are high in vitamins and protein, while its leaves can be steeped to produce a nutritional tea.
An emerging “other fruit crop” which is gaining attention is the northern kiwi. A close relative to the fuzzy kiwi (kiwi fruit), this northern variation has proven to be hardy enough to be grown in a Canadian climate.
The number of agricultural operations growing kiwi crops has increased by 25.0% from 2011 to 2016, boosting the total number of farms to 45. The area under cultivation for kiwis decreased slightly, falling from 64 to 58 acres during that same period. Known mainly as a fresh fruit, kiwis are also being utilized for their ornamental qualities (Chart 2).
There was a similar pattern among farms growing currants. The number of producers rose 18.6% between 2011 and 2016 to 350 operations. At the same time, the crop area devoted to currants decreased from 504 acres in 2011 to 427 acres in 2016. Currants are also known for their adaptability, making it hardy enough to be grown in various garden soils (Chart 2).
Gooseberries are also reputed for adaptability and hardiness with its flowers being frost tolerant and its berries being able to withstand sub-zero temperatures. The number of farms reporting gooseberries grew by more than 50.0% between 2011 and 2016, increasing the total farm count to 90. Crop area for farms reporting gooseberries also increased from 32 acres to 42 acres during that same period (Chart 2).
Currants and gooseberries can be used for food products like jams, jellies, pies and other desserts. Black currants, specifically, are rich in vitamin C and are used in juices.
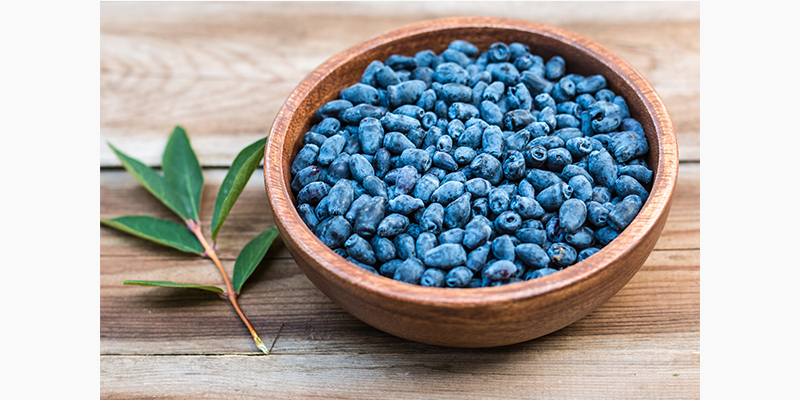
The haskap plant is a deciduous shrub that can grow up to 2 metres tall. Its leaves typically grow 3 to 8 cm in length. Its berry fruit range from 1 to 4 cm in length, and closely resemble blueberries. The taste of haskap berries has been described as a cross between a blueberry and a raspberry.
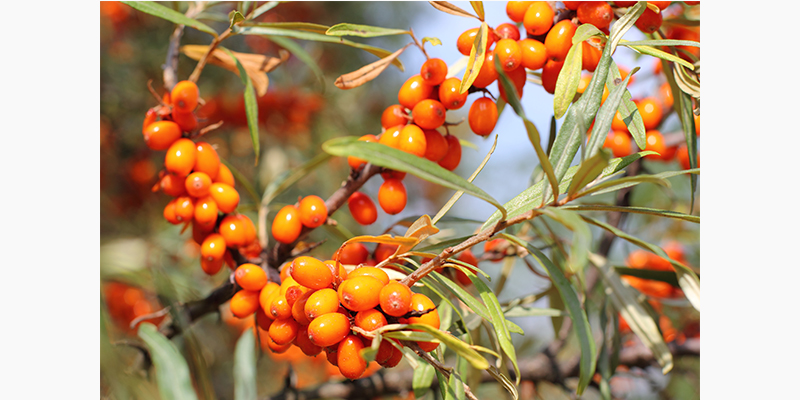
Sea buckthorn is a deciduous shrub that typically grows 0.5 to 0.6 m tall. Its leaves, branches and berries can all be used for agricultural products. Its fruit can differ in both shape and color; from yellow to orange in color and from a spherical to an egg-shaped configuration.
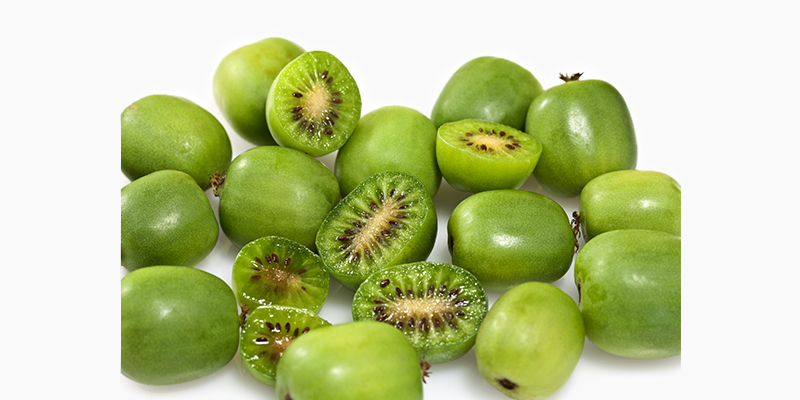
Contrary to their kiwi fruit relative, northern kiwi, also known as hardy kiwi, does not have any hairs or fuzz along its exterior. This grape-shaped fruit is green in color and contains a soft, chewy inside. This “other fruit crop” belongs to the Actinidiaceae plant family.
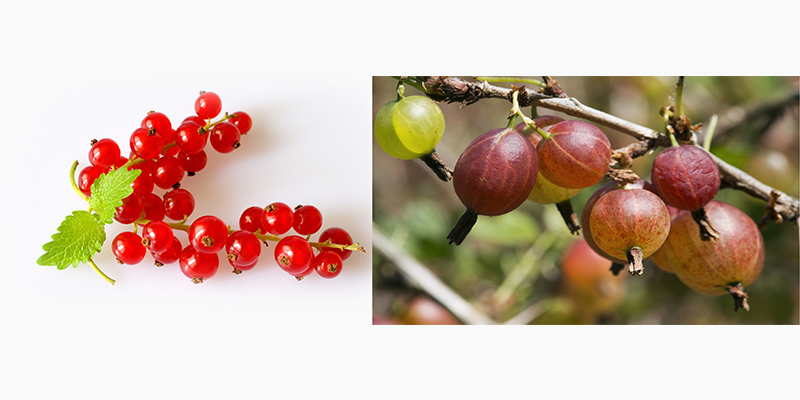
(From left to right) Currants and gooseberries belong to the Saxifrage family. Gooseberries look similar to currants but are distinguished by spines along the stem of the berries.
Other vegetable crops
Canadian producers have taken notice of kale’s ascent to ‘superfood’ supremacy. The leafy-green’s nutritional benefits have helped build a burgeoning consumer demand, a demand farmers are obliging.
From 2011 to 2016, the Census of Agriculture reported an almost five-time increase in kale crop area, pushing the total to 448 acres (Table 1).
| Other vegetable crop | Area | Change | |
|---|---|---|---|
| 2011 | 2016 | ||
| acres | percent | ||
| Chinese vegetables | 2,058 | 2,356 | 14.5 |
| Garlic | 1,290 | 2,207 | 71.1 |
| Sweet potato | 1,418 | 1,776 | 25.2 |
| Kale | 92 | 448 | 389.9 |
|
Note: Area is rounded to the nearest whole number; percentages are computed from precise area totals and rounded to one decimal place. Source: Statistics Canada, Census of Agriculture (3438). |
|||
Over that same period, the number of farms reporting kale more than tripled to a total of 265 agricultural operations, up from 82 agricultural operations in 2011 (Table 2).
| Other vegetable crop | Agricultural operations | Change | |
|---|---|---|---|
| 2011 | 2016 | ||
| number | percent | ||
| Chinese vegetables | 83 | 98 | 18.1 |
| Garlic | 1,315 | 2,251 | 71.2 |
| Sweet potato | 195 | 65 | -66.7 |
| Kale | 82 | 265 | 223.2 |
| Source: Statistics Canada, Census of Agriculture (3438). | |||
Sweet potato crops saw growth in area as well, with farms reporting an increase of 25.2%, bumping the crop's area to 1,776 acres (Table 1).
Sweet potatoes are known for their nutritional benefits, as they are rich in vitamins and antioxidants. They also contain iron, which can aid in strengthening immune systems.
Of note, while farms reporting sweet potato crops experienced growth in total area, from 2011 to 2016, the number of participating agricultural operations fell by 66.7% during that same period to a total of 65 (Table 2).
Trends in data from farms reporting sweet potato crops mirror patterns displayed in the Canadian agriculture industry as a whole. The results of the 2016 Census of Agriculture indicate that while, in general, there are fewer farms in 2016, the farms are typically larger than in 2011.Note 2
Amongst “other vegetable crops”, farms reporting garlic also experienced notable growth in the number of producers from 2011 to 2016. The number of garlic producing farms grew by 71.2% to a total of 2,251 agricultural operations (Table 2). While garlic is reputed for its food uses, it is also a source of value-added medicinal products. The vegetable is known to contain allicin, a natural antibiotic which can help treat cholesterol, improve circulation and increase immunity. It is also becoming common practice for garlic to be distributed and sold as a form of herbal supplements in capsules, tablets and liquid extracts.
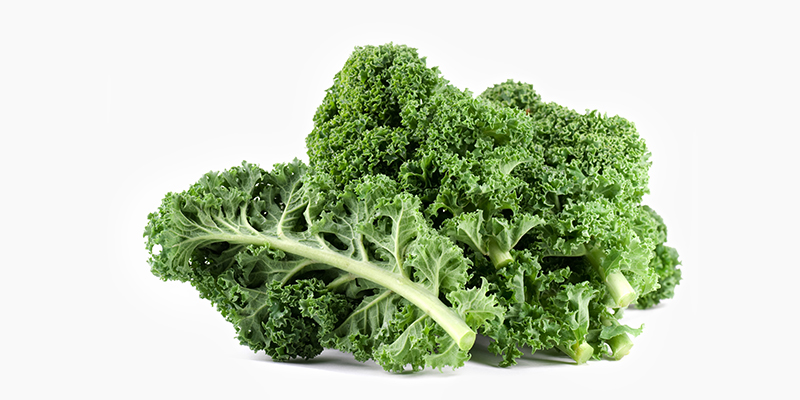
Kale is a dark green and purple leafy vegetable which is part of the cabbage family. It is classified as a Brassicas, which is a group of closely related plants that include cauliflower, radish and cabbage.
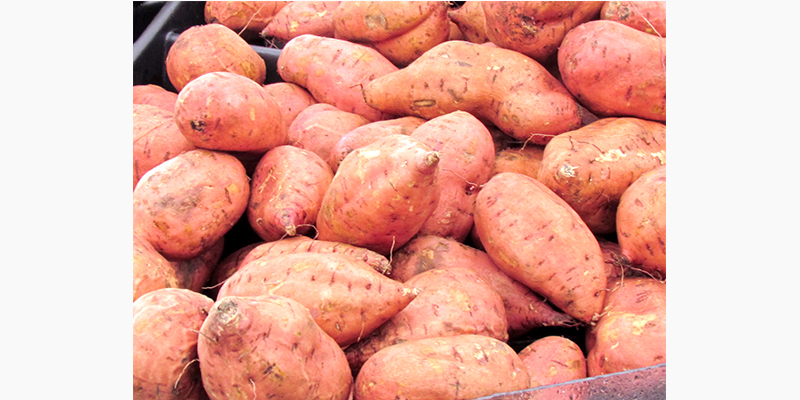
Sweet potatoes belong to the Convolvulaceae plant family. The vined plant contains an edible tuberous root with an orange-yellow-brown colouration.
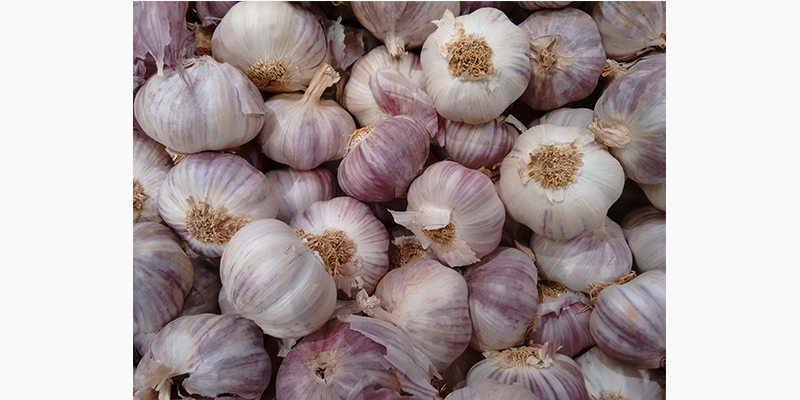
What makes Canadian garlic so unique is the variety of crops. The herbaceous perennial adapts its characteristics to its regional topography, creating diversified strains from hardnecks to softnecks, as well as varieties of elephant garlic.
Direct marketing
There is a varying range in the use of direct marketing activities among “other vegetable and fruit crops”. Farms reporting gooseberries had a direct marketing participation rate of 77.8% which was more than double the 34.7% direct marketing rate among farms reporting Chinese vegetables (Table 3).
| Other crop | Direct marketing participation |
|---|---|
| percent | |
| Gooseberries | 77.8 |
| Currants | 76.0 |
| Garlic | 75.5 |
| Kale | 75.1 |
| Kiwi | 66.7 |
| Sweet potato | 63.1 |
| Haskaps and other berries | 56.5 |
| Sea buckthorn | 49.2 |
| Chinese vegetables | 34.7 |
| Spelt | 27.3 |
| Camelina | 16.7 |
| Quinoa | 13.6 |
| Fenugreek | 9.1 |
| Hemp (industrial) | 4.9 |
| Source: Statistics Canada, Census of Agriculture (3438). | |
A number of “other fruit and vegetable crops” generally fall in line with industry trends. According to the 2016 Census of Agriculture, four in five fruit and vegetable combination farms use direct marketing.Note 3 Farms reporting currants reported a direct marketing rate of 76.0%, while those reporting garlic had a direct marketing usage rate of 75.5%; farms reporting kale came in slightly lower at 75.1% (Table 3).
Farms reporting “other field crops” such as spelt, camelina, quinoa, fenugreek and hemp had significantly lower rates of direct marketing use in comparison to their “other fruit and vegetable” counterparts. This is largely due to the practice that “other field crops” are typically harvested and sent to a processor to be made into consumer products, rather than directly marketed.
Provincial breakdown of other crop area
Production of certain crops is very province-centric. Take fenugreek for example, of the 2,809 acres reported in 2016, 100% of the crop area was reported in Saskatchewan. Similarly, 98.8% of the 1,776 acres of sweet potatoes reported were located in Ontario (Table 4).
Other crops by contrast, such as garlic, can be found across several provinces in varying proportions. For instance, just over a quarter of the crop area devoted to garlic was in Quebec, slightly higher than British Columbia at 22.0%. Ontario had the largest area of garlic crop production, with farms in that province reporting 44.2% of the 2,207 acres of garlic in Canada (Table 4).
| Other crop | Canada | Newfoundland and Labrador | Prince Edward Island | Nova Scotia | New Brunswick | Quebec | Ontario | Manitoba | Saskatchewan | Alberta | British Columbia |
|---|---|---|---|---|---|---|---|---|---|---|---|
| acres | |||||||||||
| Fenugreek | 2,809 | 0 | 0 | 0 | 0 | 0 | 0 | 0 | 2,809 | 0 | 0 |
| Spelt | 15,958 | 0 | 68 | 0 | 0 | 3,435 | 7,365 | 1,122 | 2,851 | 818 | 299 |
| Quinoa | 11,868 | 0 | 0 | 0 | 0 | Note x: suppressed to meet the confidentiality requirements of the Statistics Act | 352 | 905 | 9,525 | 1,042 | Note x: suppressed to meet the confidentiality requirements of the Statistics Act |
| Camelina | 2,703 | 0 | 0 | Note x: suppressed to meet the confidentiality requirements of the Statistics Act | 0 | 246 | Note x: suppressed to meet the confidentiality requirements of the Statistics Act | Note x: suppressed to meet the confidentiality requirements of the Statistics Act | 2,211 | Note x: suppressed to meet the confidentiality requirements of the Statistics Act | 0 |
| Hemp (industrial) | 45,245 | 0 | Note x: suppressed to meet the confidentiality requirements of the Statistics Act | 0 | Note x: suppressed to meet the confidentiality requirements of the Statistics Act | 2,149 | 732 | 12,929 | 13,329 | 15,689 | 296 |
| Hops | 789 | 0 | Note x: suppressed to meet the confidentiality requirements of the Statistics Act | 22 | 13 | 101 | 175 | Note x: suppressed to meet the confidentiality requirements of the Statistics Act | Note x: suppressed to meet the confidentiality requirements of the Statistics Act | 3 | 454 |
| Gooseberries | 42 | 0S | 1 | 2 | 2 | 24 | 8 | 1 | Note x: suppressed to meet the confidentiality requirements of the Statistics Act | Note x: suppressed to meet the confidentiality requirements of the Statistics Act | 1 |
| Currants | 427 | 5 | 30 | 10 | 3 | 142 | 73 | 5 | 46 | 62 | 52 |
| Sea buckthorn | 520 | Note x: suppressed to meet the confidentiality requirements of the Statistics Act | 0 | Note x: suppressed to meet the confidentiality requirements of the Statistics Act | 0 | 365 | 30 | 42 | 41 | 31 | 8 |
| Kiwi | 58 | 0 | Note x: suppressed to meet the confidentiality requirements of the Statistics Act | Note x: suppressed to meet the confidentiality requirements of the Statistics Act | 0 | Note x: suppressed to meet the confidentiality requirements of the Statistics Act | 12 | 0 | 0 | 0 | 40 |
| Haskaps and other berries | 1,761 | 2 | 12 | 195 | 74 | 655 | 148 | 26 | 341 | 169 | 139 |
| Garlic | 2,207 | 5 | 6 | 31 | 17 | 582 | 976 | 18 | 18 | 69 | 485 |
| Kale | 448 | 1 | 1 | 20 | 2 | 19 | 328 | 16 | 2 | 4 | 58 |
| Sweet potato | 1,776 | 0 | 4 | Note x: suppressed to meet the confidentiality requirements of the Statistics Act | Note x: suppressed to meet the confidentiality requirements of the Statistics Act | 3 | 1,755 | 2 | Note x: suppressed to meet the confidentiality requirements of the Statistics Act | 0 | 5 |
| Chinese vegetables | 2,356 | Note x: suppressed to meet the confidentiality requirements of the Statistics Act | 0 | 0 | Note x: suppressed to meet the confidentiality requirements of the Statistics Act | 6 | 1,953 | Note x: suppressed to meet the confidentiality requirements of the Statistics Act | 0 | 1 | 395 |
|
0S value rounded to 0 (zero) where there is a meaningful distinction between true zero and the value that was rounded x suppressed to meet the confidentiality requirements of the Statistics Act Note: Area is rounded to the nearest whole number. Source: Statistics Canada, Census of Agriculture (3438). |
|||||||||||
Export analysis
Export totals for numerous “other crops” vary considerably from 2011 to 2016. While the total export for sweet potatoes, true hemp, and kale and other similar edible brassicas increased, “other crops” such as garlic and kiwi fruit saw their export totals decline over the same period.
Export totals for sweet potatoes increased by more than three times whereas kale and other similar edible brassicas export totals grew at a rate of 92.8% from 2011 to 2016 (Table 5).
By contrast, garlic export totals declined from $624,926 in 2011 to $583,616 in 2016 (Table 5).
| Other crop | 2011 | 2016 |
|---|---|---|
| dollars | ||
| Sweet potatoes | 4,854,708 | 17,062,982 |
| Black, white, or red currants and gooseberries | Note ..: not available for a specific reference period | 132,960 |
| Garlic | 624,926 | 583,616 |
| True hemp; tow and waste of true hemp | 35,415 | 137,386 |
| Cabbages, kohlrabi, kale and other similar edible brassicas | 29,849,514 | 57,540,228 |
| Kiwi | 21,845 | 4,425 |
| Quinoa | Note ..: not available for a specific reference period | 4,424,715 |
|
.. not available for a specific reference period Sources: Statistics Canada and the US Census Bureau (accessed January 3, 2018). |
||
Historical analysis
While the central focus of this article compares ‘other crop’ data between 2011 and 2016, it is important to analyze data further back to provide a more comprehensive data story.
The area of fenugreek has steadily risen over the past four censuses. Between 2001 and 2006, farms reporting fenugreek saw a crop area increase of 105 acres. By 2011, farms reporting fenugreek experienced another increase, growing by 130 acres from 2006. The prevailing trend carried over into 2016, as farms reporting fenugreek observed an increase of 2,395 acres in crop area (Table 6).
While the area under cultivation for farms reporting kale rose dramatically between 2011 and 2016, looking back to 2001 and 2006 shows only a modest 10-acre rise. Between 2006 and 2011, crop area for farms reporting kale increased by nearly 17 acres, larger than the 2001 to 2006 increase, but much smaller than the 357 acres of crop area growth which took place between 2011 and 2016. This data pattern reinforces the narrative that kale’s popularity is a relatively new phenomenon (Table 6).
An additional “other vegetable crop” whose crop area has increased over the past 15 years is the sweet potato. Historical data for farms reporting sweet potatoes indicates increases in crop area over the previous four censuses. Crop area for sweet potatoes increased by 597 acres between 2001 and 2006, and by 659 acres between 2006 and 2011. This trend continued into 2016 with crop area increasing by 358 acres for sweet potato producers compared with the 2011 Census (Table 6).
An emerging trend within “other fruit crops” is the crop area growth for farms reporting sea buckthorn. From 2006 to 2011, the area under cultivation for farms reporting sea buckthorn increased by 127 acres. This trend continued into 2016, as farms reporting sea buckthorn observed a 188-acre increase in crop area from 2011 (Table 6).
| Other crop | 2001 | 2006 | 2011 | 2016 |
|---|---|---|---|---|
| acres | ||||
| Fenugreek | 179 | 284 | 414 | 2,809 |
| Spelt | 6,939 | 10,886 | 10,526 | 15,958 |
| Quinoa | 313 | Note x: suppressed to meet the confidentiality requirements of the Statistics Act | 312 | 11,868 |
| Garlic | 1,742 | 759 | 1,290 | 2,207 |
| Kale | 65 | 75 | 92 | 448 |
| Sweet potato | 162 | 759 | 1,418 | 1,776 |
| Sea buckthorn | Note ..: not available for a specific reference period | 206 | 333 | 520 |
|
.. not available for a specific reference period x suppressed to meet the confidentiality requirements of the Statistics Act Note: Area is rounded to nearest whole number. Source: Statistics Canada, Census of Agriculture (3438). |
||||
Conclusion
It is clear that changes in particular “other crop” data may be reflective of how producers are selecting and focusing on particular crop varieties in an effort to accommodate the evolving needs of consumers.
Whether it be through the introduction of novel “other crops” (i.e. northern kiwi) or by capitalizing on healthy living trends (i.e. quinoa, haskap, and kale), agricultural operations are proving to be innovative and adaptive.
Terms
Other field crops: Includes all field crops produced on agricultural operations except, wheat, oats, barley, mixed grains, corn, rye, canola, soybeans, flaxseed, dry field peas, chick peas, lentils, dry white beans, other dry beans, alfalfa, tame hay and fodder crops, forage seed, potatoes, mustard seed, sunflowers, canary seed, ginseng, buckwheat, sugar beets, and triticale. Some examples of “other field crops” include (but are not limited to) quinoa, hops, fenugreek, oil radish, camelina and spelt.
Other fruit crops: Includes all fruit crops produced on agricultural operations except, apples, pears, plums and prunes, sweet and sour cherries, peaches, apricots, grapes, strawberries, raspberries, cranberries, blueberries, and saskatoons. Some examples of “other fruit crops” include (but are not limited to) currants, kiwis, nuts, gooseberries, sea buckthorn, haskaps and other berries.
Other vegetable crops: Includes all vegetable crops produced on agricultural operations except, sweet corn, tomatoes, cucumbers, green peas, green and wax beans, cabbage, Chinese cabbage, cauliflower, broccoli, brussels sprouts, carrots, rutabagas and turnips, beets, radishes, shallots and green onions, dry onions, celery, lettuce, spinach, peppers, pumpkins, squash and zucchini, and asparagus. Some examples of “other vegetable crops” include (but are not limited to) chinese vegetables, kale, sweet potato and garlic.
Census farm: An agricultural operation that produces at least one of the following products intended for sale:
- crops: hay, field crops, tree fruits or nuts, berries or grapes, vegetables, seed
- livestock: cattle, pigs, sheep, horses, game animals, other livestock
- poultry: hens, chickens, turkeys, chicks, game birds, other poultry
- animal products: milk or cream, eggs, wool, furs, meat
- other agricultural products: Christmas trees, sod, greenhouse or nursery products, mushrooms, honey or bees, maple syrup and its products.
Direct marketing: Farm operators are using direct marketing to grow their business and sell products directly to consumers. There are four direct marketing methods classified, they include:
- Farm gate sales, stands, kiosks, U-pick
- Farmers’ markets
- Community Supported Agriculture (CSA)
- Other
Data for Yukon and the Northwest Territories are not included in national totals because of the differing definition of an agricultural operation in those regions and because of confidentiality constraints.
It should be noted that all “other crop” agricultural products mentioned were selected without bias. Each agricultural product identified is but a subset topic of potential other topics pertaining to “other crops”.
- Date modified: