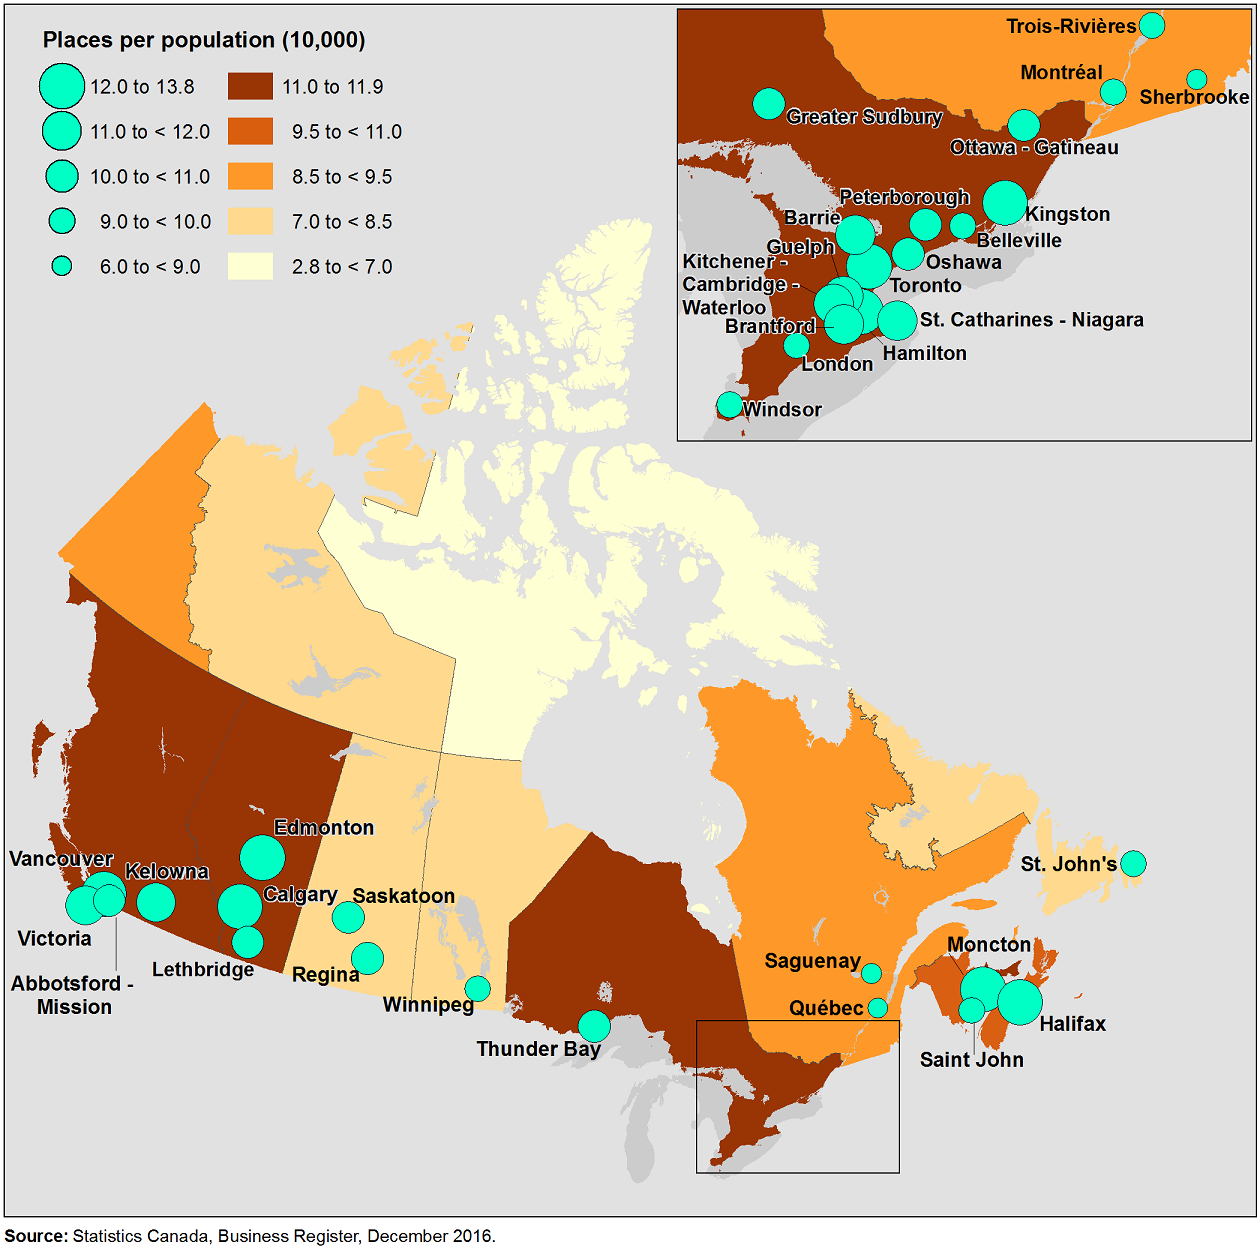
Map 1
Limited-service eating places by province and territory and for selected census metropolitan areas

Map description
The title of the map is "Limited-service eating places by province and territory and for selected census metropolitan areas"
The map is of Canada and all of the provinces and territories. The map indicates the number of fast food places per 10,000 population in a range by shade of colour for every province and territory and by size of data point for Census Metropolitan Areas. The title of the legend is "Places per population (10,000)" The ranges for Census Metropolitan Areas are: 6.0 to < 9.0; 9.0 to < 10.0; 10.0 < 11.0; 11.0 to < 12.0; 12.0 to 13.8 The ranges for provinces and territories are: 2.8 to < 7.0; 7.0 to < 8.5; 8.5 to < 9.5; 9.5 to < 11.0; 11.0 to 11.9 Provincial data point 1: Yukon; 8.5 to < 9.5 Provincial data point 2: British Columbia; 11.0 to 11.9 Provincial data point 3: Northwest Territories; 7.0 to < 8.5 Provincial data point 4: Alberta; 11.0 to 11.9 Provincial data point 5: Saskatchewan; 7.0 to < 8.5 Provincial data point 6: Nunavut; 2.8 to < 7.0 Provincial data point 7: Manitoba; 7.0 to < 8.5 Provincial data point 8: Ontario; 11.0 to 11.9 Provincial data point 9: Quebec; 8.5 to < 9.5 Provincial data point 10: Newfoundland and Labrador; 7.0 to < 8.5 Provincial data point 11: New Brunswick; 9.5 to < 11.0 Provincial data point 12: Nova Scotia; 9.5 to < 11.0 Provincial data point 13: Prince Edward Island; 11.0 to 11.9 Census Metropolitan Area data point 1: Victoria; 11.0 to < 12.0 Census Metropolitan Area data point 2: Vancouver; 12.0 to 13.8 Census Metropolitan Area data point 3: Abbotsford - Mission; 10.0 to < 11.0 Census Metropolitan Area data point 4: Kelowna; 11.0 to < 12.0 Census Metropolitan Area data point 5: Edmonton; 12.0 to 13.8 Census Metropolitan Area data point 6: Calgary; 12.0 to 13.8 Census Metropolitan Area data point 7: Lethbridge; 10.0 to < 11.0 Census Metropolitan Area data point 8: Saskatoon; 10.0 to < 11.0 Census Metropolitan Area data point 9: Regina; 10.0 to < 11.0 Census Metropolitan Area data point 10: Winnipeg; 9.0 to < 10.0 Census Metropolitan Area data point 11: Thunder Bay; 10.0 to < 11.0 Census Metropolitan Area data point 12: Greater Sudbury; 10.0 to < 11.0 Census Metropolitan Area data point 13: Barrie; 11.0 to < 12.0 Census Metropolitan Area data point 14: Windsor; 9.0 to < 10.0 Census Metropolitan Area data point 15: London; 9.0 to < 10.0 Census Metropolitan Area data point 16: Guelph; 11.0 to < 12.0 Census Metropolitan Area data point 17: Brantford; 11.0 to < 12.0 Census Metropolitan Area data point 18: Kitchener – Cambridge - Waterloo; 11.0 to < 12.0 Census Metropolitan Area data point 19: St. Catharines - Niagara; 11.0 to < 12.0 Census Metropolitan Area data point 20: Hamilton; 12.0 to 13.8 Census Metropolitan Area data point 21: Toronto; 12.0 to 13.8 Census Metropolitan Area data point 22: Oshawa; 10.0 to < 11.0 Census Metropolitan Area data point 23: Peterborough; 10.0 to < 11.0 Census Metropolitan Area data point 24: Kingston; 12.0 to 13.8 Census Metropolitan Area data point 25: Belleville; 9.0 to < 10.0 Census Metropolitan Area data point 26: Ottawa - Gatineau; 10.0 to < 11.0 Census Metropolitan Area data point 27: Montréal; 9.0 to < 10.0 Census Metropolitan Area data point 28: Trois-Rivières; 9.0 to < 10.0 Census Metropolitan Area data point 29: Sherbrooke; 6.0 to < 9.0 Census Metropolitan Area data point 30: Québec; 6.0 to < 9.0 Census Metropolitan Area data point 31: Saguenay; 6.0 to < 9.0 Census Metropolitan Area data point 32: Saint John; 9.0 to < 10.0 Census Metropolitan Area data point 33: Moncton; 12.0 to 13.8 Census Metropolitan Area data point 34: Halifax; 12.0 to 13.8 Census Metropolitan Area data point 35: St. John's; 9.0 to < 10.0 Source: Statistics Canada, Business Register, December 2016.
- Date modified: