
Evaluation Report
December 2020
How the report is structured
- The report in short
- Acronyms and abbreviations
- What is covered
- What we learned
- 1.1. Relevance—needs assessment
- 1.2. Effectiveness—communicating changes
- 1.3. Projects supporting the modernization initiative
- How to improve the program
- Management response and action plan
- Appendix A: Explored changes for the dissemination of Consumer Price Index statistical information
- Appendix B: Examples of communication and dissemination products and services
- Appendix C: Consumer Price Index Portal, March 2020
- Appendix D: Statistics Canada modernization initiative
- Appendix E: Innovation Maturity Survey
The report in short
The statistical information produced by the Consumer Price Index Program (CPIP) measures inflationary aspects of the Canadian economy over time and across geographic areas. The outputs are essential for measuring economic activity in real terms in the Canadian System of Macroeconomic Accounts. The program supports the determination of monetary and fiscal policy, including inflation targeting by the Bank of Canada, and responds to requirements of the Organisation for Economic Co-operation and Development. Measures of price change are also used to support contract and pension adjustments and escalation.
The evaluation of the CPIP was conducted in accordance with the Treasury Board's Policy on Results (2016) and Statistics Canada's Integrated Risk-Based Audit and Evaluation Plan (2019/2020 to 2023/2024). The primary objective of the evaluation was to provide a neutral, evidence-based analysis of the relevance of the Consumer Price Index (CPI) and its complementary indexes to municipal governments (MGs); the effectiveness of communication strategies related to the CPI; and the extent to which the planning, design and implementation of innovative activities were effective and aligned with Statistics Canada's modernization initiative. It is expected that the information gathered during the evaluation will help inform future decision making.
The following questions were examined in the evaluation:
- What are the needs of MGs and organizations supporting municipalities (OSMs) regarding the CPI, and do proposed changes respond to their needs?
- To what extent are the Consumer Prices Division's (CPD) communication strategies effective, and how can they be improved?
- To what extent are there effective governance, planning and project management practices to support modernization projects within the CPIP?
To meet the objective and address the associated questions, a utilization-focused evaluation was conducted. The evaluation methodology consisted of a document review, an administrative data review and interviews. Triangulation of data sources was used to determine the consistency of information derived from more than one collection method and was used to arrive at the overall evaluation findings.
It should be noted that the conducting phase of the evaluation, during which all data for the report were collected, was completed before the COVID-19 pandemic. As a result, the findings and recommendations do not consider the activities or decisions that took place after March 2020.
Key findings and recommendations
Relevance—needs assessment (municipal governments and organizations supporting municipal governments)
The evaluation found that Statistics Canada was the main source of CPI information for MGs and OSMs. The CPI's related indexes, including the city indexes, were used at the municipal level for indexation; policy support; budgeting; reporting; and, in some cases, the creation of a municipal price index. There was limited use of the inter-city indexes, primarily because of a lack of need for some users and also a lack of awareness. Interpretability was identified as an area for improvement—more details on concepts and the use of plain language would be beneficial. In terms of gaps, the evaluation found that more detailed geographic data and index categories were desired. Program representatives indicated that they were aware of this and that they continue to pursue alternative sources of reliable information to address the gaps. Finally, interviewees noted that when important changes are going to be made to the CPI, they would like to be informed three to six months in advance to prevent disruption to their activities, and preferably by email.
Effectiveness—communicating changes
The evaluation found that the CPD is transitioning away from a dissemination culture focused primarily on communicating through traditional vehicles such as The Daily and the Integrated Metadatabase, towards a more strategic communication culture aimed at leveraging a variety of communication tools and channels. With the support of corporate communications, the division has used social media to broaden its communications, including by launching a portal. These new actions reflect the CPD's desire to be more strategic with its communication activities. The CPD has also recently increased the degree of planning prior to communication activities. As the program ventures further into this area, it will need greater support from corporate communications to learn about the various products and services available and also to better understand its specific responsibilities. Finally, to evaluate the effectiveness of these communication activities, the division will need to develop metrics and performance measures.
The Assistant Chief Statistician (ACS), Economic Statistics (Field 5), should ensure that:
Recommendation 1:
Given the CPD's desire to become more strategic with its communications activities, the division engage corporate communications to improve its knowledge of the new communications tools available. Furthermore, the division should update its communication planning process to include the use of measurement tools (in addition to web metrics) to gather information on the effectiveness of activities. This information will help improve activities such as the communication of program changes to users.
Consumer Price Index Program projects supporting the modernization initiative
The evaluation included a review of a sample of ongoing and completed projects and activities undertaken by the CPD. This included Departmental Project Management Framework (DPMF)Footnote 1 projects related to the use of scanner data and non-DPMF activities in support of the DPMF projects. The evaluation found that the DPMF projects are aligned with the modernization initiative and, where possible, the CPD is drawing on lessons and experiences from other countries. In addition, the CPD is sharing information internationally and across the agency, as well as leveraging best practices and lessons learned.
Governance and risk management are in place to monitor the DPMF projects, and the implementation of an agile approach (e.g., "network of teams") proved beneficial during the later stages of the scanner data initiative. The evaluation found that some non-DPMF activities could benefit from stronger governance and risk management practices. In addition, coordination could be improved, as there are strong interdependencies between the various activities and the DPMF projects. Finally, there are also opportunities to better articulate the relationship between inputs, activities, outputs, outcomes and benefits. Measurable performance indicators are needed.
The ACS, Economic Statistics (Field 5), should ensure that:
Recommendation 2:
The CPD strengthen its performance measurement framework process for its DPMF projects to ensure that project outcomes are clearly articulated and that indicators are balanced, comprehensive and aligned with the identified outcomes and expected benefits.
Recommendation 3:
The CPD include all activities that have a significant impact on the DPMF projects, such as the high-capacity processing infrastructure activities, within the governance and oversight structures of the DPMF projects. The adoption of this more holistic approach will improve overall coordination and risk management.
The CPD - adapting and responding to the pandemic
Since the end of the reference period for the evaluation (March 2020), the CPD has taken a number of significant steps to address challenges emerging from COVID-19. Beginning in April 2020, the collection and compilation of the CPI were impacted by measures designed to limit the spread of COVID-19, as in-person field collection was conducted remotely, and imputation strategies were required to address an increased number of temporary business closures and out-of-stock products. The strategies were implemented according to international guidelines, and following consultations with other national statistical organizations.
The CPD continued to calculate the official CPI based on the fixed basket approach; however, the division recognized that a new analytical series examining shifts in consumer purchasing patterns would provide valuable insight on the impact of COVID-19. Using various sources of expenditure data, Statistics Canada, in partnership with the Bank of Canada, estimated adjusted consumer expenditure basket weights and an adjusted price index, reflecting shifts in consumption patterns during the pandemic. The ability to respond to this data need was made possible through the CPD's innovative work on scanner data, aggregate expenditure data, household final consumption expenditure data and other sources of information. Scanner data allowed for timely and insightful analysis on how Canadian Consumers Prepare for COVID-19 and how Canadian Consumers Adapt to COVID-19: A Look at Canadian Grocery Sales up to April 11 as well as the dissemination of more detailed data tables on Monthly average retail prices for select products, by province.
Acronyms and abbreviations
- ACS
- Assistant Chief Statistician
- ADSP
- Alternative Data Source Project
- API
- Application programming interface
- CMA
- Census metropolitan area
- CPD
- Consumer Prices Division
- CPI
- Consumer Price Index
- CPIEI
- Consumer Price Index Enhancement Initiative
- CPIP
- Consumer Price Index Program
- DPMF
- Departmental Project Management Framework
- HCPI
- High-capacity processing infrastructure
- IT
- Information technology
- MG
- Municipal government
- OSM
- Organization supporting municipalities
- SISDP
- Simple Implementation of Scanner Data Project
- UTM
- Urchin Tracking Module
What is covered
The evaluation was conducted in accordance with the Treasury Board's Policy on Results (2016) and Statistics Canada's Integrated Risk-Based Audit and Evaluation Plan (2019/2020 to 2023/2024). The primary objective of the evaluation was to provide a neutral, evidence-based analysis of the relevance of the Consumer Price Index (CPI) and its complementary indexes; the effectiveness of communication strategies related to the CPI; and the extent to which the planning, design and implementation of the Consumer Price Index Program (CPIP) innovation projects and their related activities are aligned with Statistics Canada's modernization initiative. It is expected that the information gathered during the evaluation will help inform decision making and accountability for future CPIP modernization projects, communication strategies, and proposed changes related to the content of disseminated statistical information and products about consumer prices.
It should be noted that the conducting phase of the evaluation, during which all data for the report were collected, was completed before the COVID-19 pandemic. As a result, the findings and recommendations do not consider the activities or decisions that took place during the pandemic period.
The Consumer Price Index Program
The CPIP is housed within the Consumer Prices Division (CPD), which is part of the Economy-wide Statistics Branch. According to the program's Performance Information Profile, the CPD is mandated to produce timely, relevant, coherent and accurate data and analysis on consumer price changes over time and across geographic areas.
The CPD collects prices on a wide variety of consumer commodities and compiles them into various price indexes—indicators of changes in prices. The main outputs produced by the CPD include the monthly CPI; a number of spatial index series that provide measures of price change across geographic regions (such as the city and inter-city indexes); and a number of analytical index series, which include weighted medians, trimmed means and other items. These indexes are designed and compiled in accordance with international standards, such as those of the International Monetary Fund and the Organisation for Economic Co-operation and Development.
The CPI measures price changes over a period of time for a "fixed basket"—or a fixed set—of goods and services consumed by Canadian households. Statistics Canada publishes CPI-related indexes on a monthly and annual basis in The Daily and on its website. Other CPI data products, such as updates to the CPI reference manual, analytical and technical papers, and data visualizations, are disseminated at various frequencies throughout the year. The CPI is used by a number of public, private and not-for-profit organizations, as well as by the media, researchers and individual Canadians, to monitor inflation, guide fiscal and monetary policies, index payments, and adjust contracts, among other things.
The CPD currently has two subdivisions that are involved in the creation of the CPI. The Development Subdivision develops methods, processes and techniques to ensure ongoing and sustainable CPI relevance and quality. It is also responsible for the development, maintenance and enhancement of systems related to the CPI. The Production Subdivision is responsible for producing a wide range of temporal and spatial price indexes. It is also responsible for coordinating releases, responding to information requests, and developing and integrating a divisional information management framework.
Projects in the Consumer Prices Division
Given the impact and importance of the CPI, it is vital that the index be updated regularly to provide an accurate and complete picture of Canadian society and to meet stakeholder needs. In the fiscal year 2009/2010, the Government of Canada announced the five-year CPI Enhancement Initiative (CPIEI), whereby $45 million was invested to improve and modernize the CPI, enabling price changes to be estimated more accurately and updates to be more frequent and faster. Statistics Canada's Evaluation Division published an evaluation report on this initiative in 2013.Footnote 2
In support of the CPIEI, Statistics Canada explored the potential issues and opportunities associated with using data from alternative sources, such as scanner dataFootnote 3 and other administrative data (e.g., from web scraping), which were known to better represent purchasing tends than data collected with traditional survey methods. Statistics Canada acquired scanner databases to support the 2009 CPI basket update and the CPIEI. By early 2015, the agency had obtained two years' worth of scanner data from a large industry retailer as a result of the CPD scanner data pilot project.
In May 2015, shortly after the acquisition of the retailer scanner data, a multiphase approach to acquiring, analyzing and implementing scanner data was approved to further explore the benefits of scanner data. In July 2017, the first phase, named the Simple Implementation of Scanner Data Project (SISDP), was officially launched to develop a process to integrate scanner data into the calculation of the CPI. In 2018, the second phase, named the Alternative Data Source Project (ADSP), was launched to migrate 50% of the current field collection sample to data from alternative sources. A third phase is being considered for after the end of the ADSP (in 2021) to integrate more retailers (Figure 1).
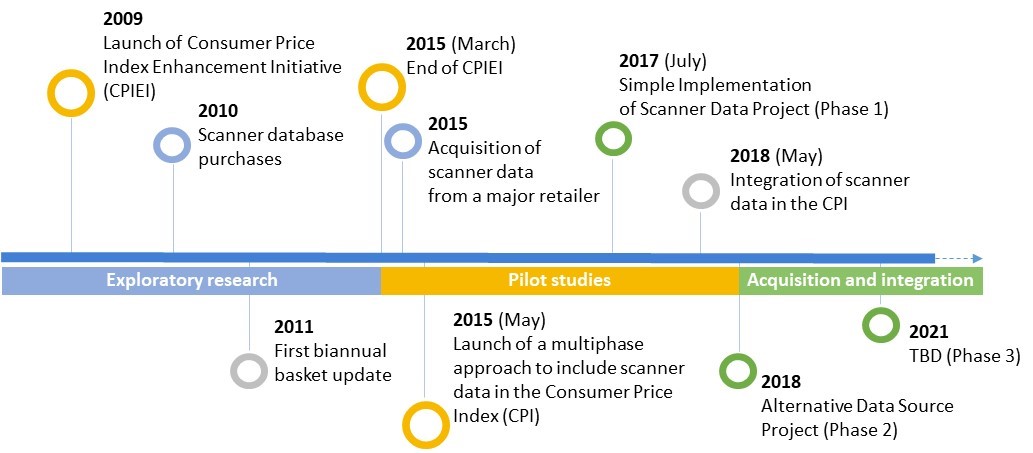
Description - Figure 1 Projects in the Consumer Prices Division
The figure depicts a timeline showing divisional projects. Starting in 2009, the timeline is split into 3 periods: Exploratory research, Pilot studies, and Acquisition and integration.
During the Exploratory period, four projects are listed:
- 2009: Launch of Consumer Price Index Enhancement Initiative (CPIEI)
- 2010: Scanner database purchases
- 2011: First biannual basket update
- 2015 (March): End of CPIEI
During the pilot studies period, four projects are listed:
- 2015: Acquisition of scanner data from a major retailer
- 2015 (May): Launch of a multiphase approach to include scanner data in the Consumer Price Index (CPI)
- 2017 (July): Simple Implementation of Scanner Data Project (Phase 1)
- 2018 (May): Integration of scanner data in the CPI
During the Acquisition and integration period, two projects are listed:
- 2018: Alternative Data Source Project (Phase 2)
- 2021: To be determined (Phase 3)
The evaluation
The scope of the evaluation was established based on meetings and interviews with representatives of the CPIP. The following evaluation issues and questions were identified for review:
- Relevance—needs assessment
What are the needs of municipal governments and organizations supporting municipalities regarding the Consumer Price Index, and do proposed changes respond to their needs? - Effectiveness—communicating changes
To what extent are the Consumer Prices Division's communication strategies effective, and how can they be improved? - Consumer Price Index Program projects supporting the modernization initiative
To what extent are there effective governance, planning and project management practices to support modernization projects within the Consumer Price Index Program?
Guided by a utilization-focused evaluation approach, quantitative and qualitative collection methods were used (Figure 2). A particular focus was placed on understanding the CPI needs of municipal governments (MGs) and organizations supporting municipalities (OSMs), as there was a gap in understanding the specific needs of these stakeholders. At the time of the evaluation, the CPD was organizing consultations with other stakeholders to gather their views on a variety of issues, including relevance and effectiveness.
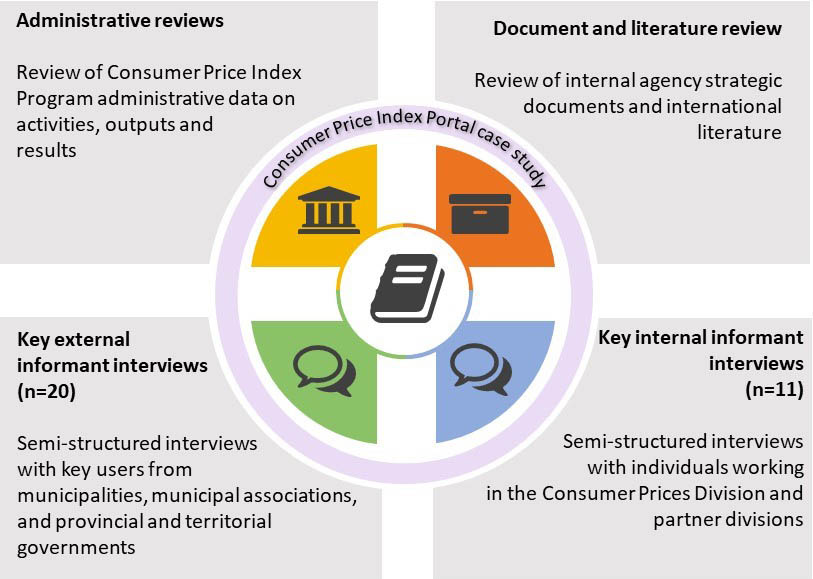
Description - Figure 2 Evaluation methodology
The figure depicts the four collection methods used for the evaluation: administrative reviews, document and literature review, key external informant interviews, and key internal informant interviews. There is also a case study of the Consumer Price Index Portal.
The administrative reviews included a review of Consumer Price Index Program administrative data on activities, outputs and results.
The document and literature review included a review of internal agency strategic documents and international literature.
The key external informant interviews included semi-structured interviews with key users from municipalities, municipal associations, and provincial and territorial governments. There were 20 interviews conducted.
The key internal informant interviews included semi-structured interviews with individuals working in the Consumer Prices Division and partner divisions. There were 11 interviews conducted.
Four limitations were identified for which mitigation strategies were employed (Table 1).
| Limitation | Mitigation strategy |
|---|---|
| Given the wide range of data users, the perspectives gathered through the external interviews may not be generally representative, and they may not be representative of the needs and views of all users from a given organization. | External interviewees, across Canada, were selected with specific criteria to maximize the strategic reach of the interviews. Evaluators were able to find consistent overall patterns. |
| Some interviewees had low familiarity with the information produced and disseminated by the Consumer Price Index Program (CPIP), limiting their ability to offer a complete response to some of the questions. | During interviews, additional information on the CPIP was provided when required. Furthermore, the data analysis took into consideration both a participant's responses to a given question and the consistency between the response and other information gathered during the participant's interview. Finally, results were presented at an aggregate level. |
| Limited documentation was available for some of the projects sampled for the evaluation and the results from communication activities. | Key staff working on CPIP projects were interviewed, and a strategy to gather additional documents during the interview sessions was put in place. Additional interviews were conducted, as needed, to fill the gaps. |
| The scope of the evaluation related to innovation reflected only a selected number of topics (i.e., alignment, project management) rather than the full spectrum of factors that may have an impact. | The evaluation methodology was conducted in such a way that other topics related to innovation could be identified and considered. |
What we learned
1.1 Relevance—needs assessment
Evaluation question
What are the needs of municipal governments and organizations supporting municipalities regarding the Consumer Price Index, and do proposed changes respond to their needs?
Summary
The evaluation found that the CPI and related indexes are used for indexation, policy support and budgeting. Overall, while the CPI responds to the needs of these users, more granular data for smaller geographic areas and index categories are desired to ensure better analysis and decision making. In addition, interpretability could be improved. Finally, some of the explored changes would have a limited impact on the work of these users; however, changing the CPI dissemination frequency for specific cities from a monthly to an annual basis would have a negative impact on some MGs.
The Consumer Price Index and related indexes were mainly used for indexation, policy support and budgeting
Consumer Price Index city indexes and municipal price indexes
Consumer Price Index (CPI) city indexes cover price changes experienced by private households at the city (census metropolitan area [CMA]) level. They are produced by Statistics Canada and published for 19 CMAs.
Municipal price indexes are composite indexes developed by individual municipalities using both consumer and product prices. They measure the inflation rate of products and services consumed by municipalities. Depending on the year, indexes can be above or below the CPI rate.
Most of the external interviewees indicated that the CPI and related indexes (e.g., city indexes) were meeting their needs. The data were used primarily for indexation, particularly for property tax and wage increases; for policy and research support (e.g., providing advice and monitoring the economy); and for city budgeting processes. The evaluation found that a growing number of municipalities were either developing or using their own municipal price index (MPI) or were showing interest in one.
Statistics Canada was the main source of CPI information for external interviewees, although most interviewees also used information from other sources, such as banks, international agencies, the Conference Board of Canada, provincial or territorial governments, and other third parties, to complement Statistics Canada information (e.g., to enable international comparisons).
Use of inter-city indexes was limited
Consumer Price Index inter-city indexes
Inter-city indexes estimate the price differential across cities at a single point in time.
These spatial price indexes are produced annually by Statistics Canada for 15 census metropolitan areas and 32 product categories.
A small number of the interviewees from MGs mentioned that they used inter-city indexes. The most common reasons for not using these indexes were a lack of awareness and lack of need. As for the OSMs, all mentioned they were aware of the inter-city indexes, and the majority indicated they were using them. MGs (those using inter-city indexes) and OSMs used the information to make comparisons, particularly in terms of the cost of living in cities in the same geographic region (e.g., Western Canada). Other uses included exploring changes in economic trends across subcomponents and geographic areas, adjusting northern allowance benefits, and forecasting consumer price estimates.
More detailed data wanted
External interviewees expressed a desire for more detailed geographic data, such as city-level information for those without data at the census metropolitan area (CMA) level. Some interviewees indicated that providing information at the CMA level was not sufficient, however, as it failed to capture differences across the municipality, especially for large cities with diverse areas. A desire for more disaggregated data for certain categories, such as food and transportation, at a lower level of geography was also mentioned.
During discussions with program representatives, they indicated that they were aware of this gap; however, they noted that they are limited by the level of granularity available from the Survey of Household Spending (SHS), which is used to calculate weights for the CPI basket. They said that efforts to gain access to transaction information (for example banking data) for the SHS program were meant to help address the gap. They, in conjunction with other parts of the agency, continue to explore alternative sources of reliable expenditure information at lower levels of detail.
Interpretability could be improved
Several external interviewees noted that CPD geographic concepts and terminology could be better communicated in reference documents. For instance, the use of the terms "city index" and "inter-city index" was misleading, given these indexes are really at the CMA level and not the city level. A desire for greater clarity on the comparability of data at different geographic levels (provincial versus CMA) was also mentioned. Lastly, the use of technical jargon in supporting documentation was also noted as an area for improvement.
Changing the monthly city index dissemination frequency would disrupt some activities
Interviewees from MGs were asked for their views on potential changes that would result in the creation or discontinuation of series and tables (see Appendix A). Overall, while most of the potential changes were deemed acceptable, they were viewed as not having a significant impact. The publication of a list of representative products would be welcomed; interviewees noted that it would assist their work by increasing the transparency of the CPI methodology and making it easier to explain how and why they are using CPI data. However, there was one change that was identified as being problematic for some—moving the city index frequency from monthly to annually. Some interviewees noted the information was needed for budgeting and reporting purposes. Finally, the discontinuation of some aggregates could be a challenge for users who lack internal technical resources.
Given the findings from the discussions with MGs and OSMs, the CPD has decided to keep the city index frequency as monthly, and to enhance the spatial (inter-city) price index to further leverage alternative data sources and modeling techniques. More information on upcoming changes and enhancements to the CPI program, many resulting from the interviews with users, can be found in the paper Enhancements and Developments in the Consumer Price Index Program.
1.2 Effectiveness—communicating changes
Evaluation question
To what extent are the Consumer Prices Division's communication strategies effective, and how can they be improved?
Summary
The evaluation found that the CPD is transitioning away from a dissemination culture towards a more strategic communication culture aimed at leveraging a variety of communication tools and channels. However, there was a lack of awareness of all the services offered by corporate communications and of the roles, responsibilities and processes. In addition, there was no performance measurement system in place to monitor the effectiveness of communication activities, although web metrics were being used to monitor access to products.
Lack of awareness of services offered by corporate communications and ambiguity around roles, responsibilities and processes led to inefficiencies
The Daily
The Daily is Statistics Canada's official release vehicle. It comprises one or more announcements, called "releases," which can be major or minor. Major releases contain important information for the Canadian public and provide a national, regional or industrial perspective. Minor releases focus on a particular industry or subject and provide a brief overview of the data.
At Statistics Canada, communication activities are a shared responsibility between the corporate communication function (Strategic Engagement Field) and subject-matter areas. The corporate communication function is composed of a number of divisions that "set the conditions to fulfill Statistics Canada's mandate by ensuring broad public awareness of Statistics Canada and easy access to its information holdings, both directly and through coordination and support provided to subject-matter areas."Footnote 5 Subject-matter areas are responsible for producing statistics, analysis and reference materials to be released to the public and for undertaking activities related to official release announcements in The DailyFootnote 6 (e.g., The Daily text, spokesperson activities). Subject-matter areas are also responsible for maintaining relationships with key partners.
The evaluation found that, in practice, roles and responsibilities were not clear for complex communication campaigns involving many partners. For example, for the CPI Portal project (see Appendix C), a lack of awareness and coordination resulted in duplication of work, increased time pressures and confusion among partners, and led to tasks going unperformed. Clearer information at the outset outlining key contacts, processes and responsibilities would have been beneficial for planning and execution, as expectations and turnaround times would have been clearer. While information on the various products and services offered by the corporate communication function can be found on the Internal Communications Network,Footnote 7 it was not always evident how they could be used or whom to contact.
Looking to be more strategic
Communicating Changes
Municipalities and organizations supporting municipalities
These users prefer being informed of changes through an email containing a brief, plain-language description of the change (e.g., what is being changed, where, when, why, and any likely impacts to users), plus a link to additional information. It was suggested that the Consumer Prices Division send multiple reminders using different products and mediums to ensure users receive news of the change broadly. Municipal governments and organizations supporting municipalities would like to be informed about three to six months in advance, with the longest being a year. This would allow time to make necessary changes to processes and prepare explanations of impacts on items such as budgets, spending or contracts. It would also allow time to engage Statistics Canada if necessary.
The evaluation found little evidence of a formal communication strategy to support the planning of communication activities. Rather, decisions about communication activities were based on the type of product, the scope and past experiences. Additionally, formal communication plansFootnote 8 only recently began to be used. Based on internal interviews, historically, communication plans were simply not required as communication activities were more operational, were reoccurring in nature (i.e., official monthly releases) and focused on dissemination. It was assumed that users already knew how to access the program's statistical information. Methodological changes were typically announced in The Daily through a note to readers and in the Integrated MetadatabaseFootnote 9—two main points of access for key stakeholders.Footnote 10 For example, the evaluation found that no formal communication plan was developed for the 2019 basket update or for the methodological change for rent. Users were informed of the basket update through a note to readers in The Daily three months in advance, and selected key users were informed by email.
Of the 19 announcements pertaining to a change or an analytical product since September 2017, The Daily was the predominant channel used in 94.7% of cases and the only channel used in 42.1% of cases. This was followed by direct contact with key stakeholders (36.8%) and social media (31.6%) (Figure 3). The variety of channels increased notably in 2019, when the CPD increased the use of formal communication plans to make new product announcements to the general public (i.e., the CPI Portal, the CPI Data Visualization Tool and the CPI for Seniors).Footnote 11
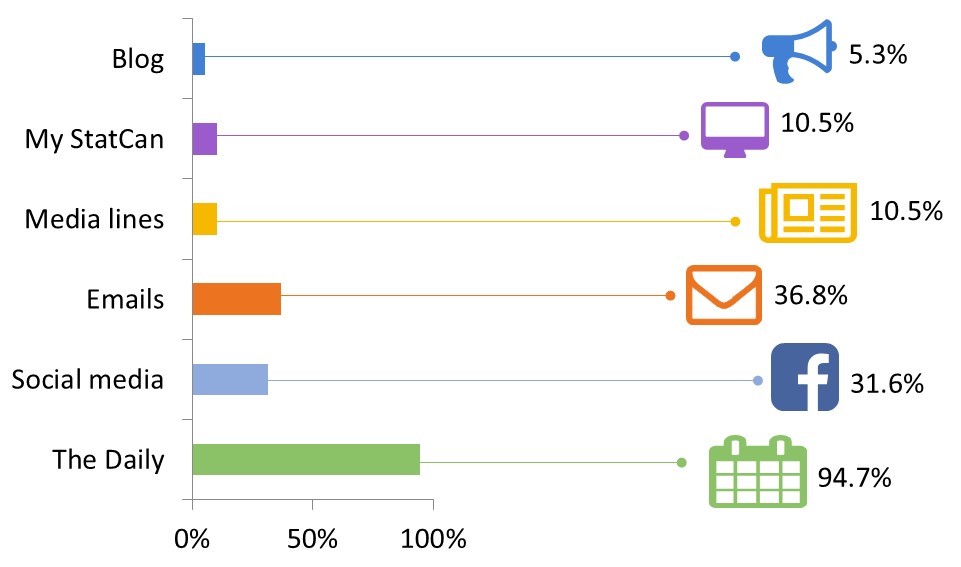
Description - Figure 3 Channels used to communicate changes, 2017 to 2019 (n=19)
The figure depicts the percentage of times specific communication channels were used to announce a change or an analytical product since September 2017.
- Blog: 5.3%
- My StatCan: 10.5%
- Media lines: 10.5%
- Emails: 36.8%
- Social media: 31.6%
- The Daily: 94.7%
These findings align with the historical predominance of a dissemination culture focused primarily on The Daily and access mechanisms. As noted previously, this is changing in the CPD. At the agency level, at the time of the evaluation, the corporate communication function was developing an agency-wide communication strategy and new tools (e.g., user personas) to provide more effective direction on the use of communication activities. In addition, the function is restructuring how it provides services to improve both awareness and the delivery of services. Both changes would be welcomed by the CPD, as it had a strong desire to be more strategic with its activities.
The Consumer Price Index Portal as a communication tool
On August 21, 2019, the agency released the CPI Portal as part of its suite of portals. The CPI Portal showcases the CPI Data Visualization Tool, the most recently released key indicators, a variety of featured products and direct access to CPI products. The portal also hosts new data products on consumer prices and serves as a bulletin board for information about the CPI. All the external interviewees (from MGs and OSMs) who were aware of the portal expressed overall satisfaction with it. In particular, they indicated that the portal makes it easier to access Statistics Canada information on consumer prices by consolidating it in one place—enhancing the accessibility of this information was one of the objectives of the portal. Moving forward, the portal can be another vehicle through which the CPD can communicate changes to a wider audience. This approach is taking place in other countries (e.g., the United States).
The case study on the launch of the CPI Portal, conducted as part of this evaluation (see Appendix C), highlighted the importance of having performance measures in place to monitor the effectiveness of the launch communication activities. Internal interviewees recognized that performance measures to determine which communication activities had the greatest impact in driving traffic to the portal were important.
1.3 Projects supporting the modernization initiative
Evaluation question
To what extent are there effective governance, planning and project management practices to support modernization projects within the Consumer Price Index Program?
Summary
The evaluation found that projectsFootnote 12 are aligned with the modernization initiative and with international trends in scanner data innovation. Governance and risk management are in place for Departmental Project Management Framework (DPMF) projects, and the use of an agile approach was effective.Footnote 13 The articulation of outputs, outcomes, benefits and performance measures could be improved, and some non-DPMF activities lacked project management rigour. Lastly, the CPD was leveraging best practices and sharing lessons learned.
Projects are aligned with the modernization pillars and the expected results
Departmental Project Management Framework
While it is recommended that all projects be managed and monitored in accordance with the Departmental Project Management Framework, it is mandatory only for those meeting specific criteria related to timelines, plans, and costs or budgets.
The Departmental Project Management Office is responsible for providing leadership, training and support to users of common project management processes and tools at Statistics Canada.
Statistics Canada's modernization initiative is based on a vision of a data-driven society and economy. The modernization of Statistics Canada's workplace culture and its approach to collecting and producing statistics will result in "greater and faster access to needed statistical products for Canadians." Five pillars and their associated expected results guide the modernization initiative (Appendix D).
A sample of projects was selected using the following criteria: level of priority for the CPIP, budget, expected impact (e.g., on data users, respondents, data quality and costs) and perceived contribution to modernization. Additional criteria, such as length, start date and stage of the project, were also considered. Based on this methodology, the following projects were selected.
- SISDP: This project was the first phase of a larger initiative to have the CPI largely composed of data from alternative data sources. The objective of this phase was to develop a process to integrate scanner data into the calculation of the CPI. The project involved the replacement of field-collected prices by equivalent scanner data prices for the same products in the same stores (e.g., a one-to-one replacement of data collected in stores by data collected from alternative sources). One retailer was involved and represented an integration of 20% of the field collection sample at the time. This project required the development of a new methodology, a system to process the new data source, and a new functionality within the division. This project spanned 2017 and 2018 and was a DPMF project.
- ADSP: This project is the second phase of the broad initiative to integrate scanner data into the CPI. The objective of this phase is to migrate 50% of the current field collection sample to data from alternative sources (representing 20% of the total basket weight) within three years. This includes the use of scanner data, web scraping and an application programming interface. This project spans 2018 to 2021, is a DPMF project and is self-funded by the CPD.
As part of the multiphase approach to integrate scanner data into the CPI, the CPD is also undertaking other activities to support the implementation of the DPMF projects. The CPD did not view these as being part of the DPMF projects, nor did it view them as projects; they were simply referred to as activities.
- High-capacity processing infrastructure (HCPI): The objective of these activities is to acquire information technology (IT) infrastructure to meet the need for high-capacity computing for the ongoing integration of scanner data into the CPI (e.g., for the ADSP). The aim is to develop business requirements to suit the needs of the CPD, alongside partners in IT, and to obtain the suitable infrastructure.
- Capacity building, data science tools and workforce: These activities target modern and flexible operations through the use of modern analytical techniques, including machine learning, dynamic analysis and Power BI. Activities also include recruitment and staffing, development of data science skills within the division, participation within communities of practice to support advanced methods, and adoption of an agile approach to facilitate a collaborative working environment.
Most of the projects and supporting activities examined aligned with the modernization pillars, particularly leading-edge methods and data integration, and sharing and collaboration (Table 2).
| Projects and supporting activities | Timeframe | Alignment with modernization pillars |
|---|---|---|
|
Simple Implementation of Scanner Data Project |
Start: 2017/2018 Length: 1 year Stage: Completed Approximate cost: $745,000 |
Leading-edge methods and data integration: The project used new sources of data, as well as new methods for collecting data. New methods and technologies, such as scanner data technology, application programming interface data technology, and web scraping technology, were used. Sharing and collaboration: A key element of the project involved the establishment and maintenance of mutually beneficial partnerships with external data providers. |
|
Alternative Data Source Project |
Start: 2018/2019 Length: 3 years Stage: Execution Approximate cost: $3,700,000 |
Leading-edge methods and data integration: The project involves the use of new sources of data, new methods for collecting data, and new data science methods and machine learning. Sharing and collaboration: The project involves the growth of partnerships to allow for more open sharing of data. |
|
High-capacity processing infrastructure |
Start: 2016/2017 Length: Ongoing Stage: Execution Approximate cost: $300,000 |
Leading-edge methods and data integration: These activities will facilitate the integration of data from alternative sources into the CPI, using methods such as machine learning. They also include the acquisition of new infrastructure and tools. Sharing and collaboration: These activities involve partnerships with other divisions and stakeholders within Statistics Canada. |
|
Capacity building, data science tools and workforce |
Start: 2018/2019 Length: Ongoing Stage: Execution Approximate cost: $400,000 |
Modern workforce and flexible workplace: One of the key objectives of these activities is to ensure that the Consumer Prices Division has the right staff with the right skills within an enabling, flexible work environment. |
The Consumer Prices Division is benefitting from international experiences and contributing internationally
Efficiency gains still unclear
Based on international experience, efficiency gains remain unclear. The infrastructure and human resources required to manage the significant amount of data received, the time spent to negotiate contracts and analyze data, and the development and implementation of contingency plans are all elements that increase costs for a statistical agency.
The evaluation found that many countries have projects in place to integrate scanner data into their respective CPIs. Most are driven by the opportunities that scanner data offer to reduce collection costs and improve data quality.Footnote 15 While some countries are at the preliminary phases of this undertaking, others have already implemented tools and methods to calculate their CPI based on scanner data.Footnote 16 Factors influencing the rate of adoption include country size, the level of risk appetite, the ability to acquire data, and the availability of technology and resources.
The evaluation found that the CPD's practices are comparable to those of other countries and that the CPD is drawing on the lessons and experiences of others to support the implementation of scanner data. The CPD stayed abreast of the latest methodological and innovative advances through its participation in conferences organized by the European Statistical Office (Eurostat), the United Nations Statistics Division and the Ottawa Group.Footnote 17 When faced with challenges, the CPD looked to its international network for support and to gather information on best practices. The CPD drew from the experiences of the United Kingdom (the Office for National Statistics), the Netherlands (Statistics Netherlands) and Switzerland (the Swiss Federal Statistical Office) when developing its approach, largely through the membership of the Price Measurement Advisory Committee. Lastly, the evaluation found that the CPD shared its knowledge internationally through its participation in a United Nations task force in 2019 on methodological papers on scanner data.
Governance structures and risk management were in place for Departmental Project Management Framework projects
Various committees were established and governance structures were in place for the DPMF projects. Key partners were represented, and the governance mechanisms functioned as intended. While there was some indication that the SISDP committees were used more as checkpoints, oversight appears to be tighter for the ADSP, as the CPD also reports to the Modernization Management Committee in addition to the CPI steering committee (the CPD's main governance structure for all projects and activities). Many internal interviewees noted that, for the most part, issues and challenges were resolved at the operational level (i.e., during team meetings) rather than brought to committees. Committees were used to inform and approve changes or to raise significant horizontal issues. For the ADSP, evidence indicated that weekly monitoring is done between directors and team leaders, and collaboration and project management tools, such as JIRA and Confluence, are used at the working level.Footnote 18
The evaluation found that risk management was taking place for the DPMF projects. Risks were incorporated into the DPMF planning documentation (i.e., project charters) and were monitored, updated and documented on a monthly basis by project teams through the use of risk registers and dashboards. For the ADSP, risks are reported monthly at the divisional level, and significant risks are brought to management committees. The CPD also developed a business continuity plan that outlined various options for short-term solutions (it was being updated at the time of the evaluation) in case issues arose with the acquisition of data.
Agile management facilitated the implementation of the Alternative Data Source Project
Agile management
Agile management is an iterative approach to planning and guiding project processes, whereby projects are broken down into smaller components.
One of the objectives of the capacity building, data science tools and workforce activities was to implement an agile approach to facilitate a collaborative working environment. The adoption of the approach had positive impacts on the DPMF projects. The approach incorporated a "scrum framework," which emphasized multidisciplinary expertise, teamwork, accountability and an iterative progress towards a well-defined goal.Footnote 19
All internal interviewees indicated that the agile approach generally worked well for the projects, especially the implementation of a "network of teams" approach, which aimed to hold an entire team accountable for a given project output rather than one person or a few people. Interviewees noted that the network of teams approach ensured that the right people with the right skills were addressing problems and questions, improved collaboration, and led to a shared sense of accountability because of the blurring of formal roles and responsibilities among teams. In addition, it led to the dissolution of silos within the division, enabling teams to work collaboratively towards joint goals. For example, the methodology team and the production team worked together rather than in isolation, allowing for earlier validation of methods and improved decision making.
In contrast, many internal interviewees noted that traditional project management structures based on DPMF requirements were not ideal, as documentation requirements were too time-consuming.
High-capacity processing infrastructure activities lacked rigour
Managed separately as IT acquisition activities, the HCPI activities involved several stakeholders and partners, both within and outside the agency. The evaluation found that not all aspects of the process were under the CPD's control. The HCPI activities encountered challenges with planning, governance and risk. These challenges have had an impact on both the efficiency of the ADSP and the achievement of objectives.
Challenges at the planning level in terms of business requirements included limited data science expertise, the novelty of the data science methods and a lack of knowledge about machine learning within the agency at the time. These factors, combined with the urgency to obtain IT infrastructure and evolving needs, contributed to the acquisition of an inadequate IT infrastructure that ultimately impacted, among other things, the CPD's ability to attract and retain staff with appropriate expertise.Footnote 20 At the time of the evaluation, updated business requirements were being discussed.
The evaluation found that stronger planning, oversight and risk management could have resulted in earlier recognition and mitigation of the difficulties related to the IT acquisition. More recent ADSP documents (i.e., dashboards and reporting decks) have included risks related to the HCPI. However, no risk register specific to the HCPI was found despite the fact that ADSP is highly dependent on it. In addition, interviewees noted gaps in the oversight mechanisms for supporting the HCPI.
Lastly, because of a lack of supporting documentation and the departure of a key CPD employee, the evaluation could not fully assess the capacity building, data science tools and workforce activities from a risk and governance point of view.
Outputs, outcomes, benefits and performance measures could be improved
The evaluation found that the performance measurement framework could be strengthened and the project outcomes better articulated.Footnote 21 There was little evidence of mechanisms for monitoring the achievement of business outcomes (e.g., indicators, targets, performance measurement strategy). Rather, documentation and progress reports to committees focused on outputs and deliverables (e.g., number of data points). Also, while it is expected that the ADSP will produce higher-quality statistics because of an increase in the number of data points, measures to quantify the increase in quality are unclear. Internal interviewees noted that quality improvements would be technically difficult to quantify for this project (i.e., methodologies cannot be compared). Given these challenges, the CPD may encounter difficulties in reporting on progress in terms of the expected outcomes.Footnote 22 The close-out report of the SISDP was a clear example, as only the number of data points was reported, without explaining how the quality of the food index was actually improved. A description of the methodology for indicators and contextualization would help measure progress.
In addition, the measures related to cost reduction should be comprehensive and balanced. For example, while the implementation of scanner data is expected to reduce field collection costs, the costs for the integration, use and maintenance of scanner data should be considered and stated, as well as part of the DPMF project. That said, within the agency, the scanner data experience is now being used as a case to develop a formula to assess the costs of administrative data acquisitions.Footnote 23
| Projects and supporting activities | Outcomes | Indicator | Target | Description |
|---|---|---|---|---|
| Simple Implementation of Scanner Data Project | Improved quality of the Consumer Price Index (CPI) food index | Number of product offers collected from scanner data | 17,000 target product offers | Improve the CPI by integrating a more comprehensive source of price data. At the very least, use data representing a full week of transactions, rather than one point in time in a month. |
| Solutions and expertise developed to integrate future alternative data sources and facilitate comprehensive implementation of scanner data | Not stated | Not stated | Scanner data are a new data source for the Canadian CPI that has never been used. The project will develop knowledge and expertise with this new data source. In addition, information technology and process solutions developed for this project will be reused as much as possible for future implementation of similar data sources. | |
| Alternative Data Source Project (ADSP) | Decreased field collection cost | No longer need to pay for collection at a retailer that has been switched to the ADSP | Not stated | Alternative data sources have lower costs than field collection. |
| Enhanced CPI | End user and business sponsor interviews Comparison of existing collected/imputed prices against web scraped and application programming interface (API) prices |
Not stated | Integrating new sources of data, whether scanner data or data from automated Internet collection via web scraping and APIs, is expected to produce higher-quality statistics and more relevant data. | |
| Opportunity to innovate | Comparison of innovative processes with what is being done in the industry | Not stated | Within the project's three years, three different strategies to collect data will be used, and expertise will be built along the way to facilitate better and enhanced solutions for alternative data source handling and integration. |
Lastly, outcomes, indicators or targets were either not present or unclear for the non-DPMF activities.
Information sharing was taking place
The evaluation found some evidence that best practices and lessons learned were captured and shared within the CPD. The agile approach created an environment that fostered mutual learning and sharing. Information was regularly shared through committees (e.g., advisory committees) and various forums (e.g., the Economic Statistics Forum). As well, as part of the ADSP, some information sharing occurred between the CPD and the Retail and Service Industries Division, as well as the Data Stewardship Division.
However, internal interviewees noted that more formalized mechanisms to share best practices and lessons learned at the working level would be beneficial. They mentioned more generally that the creation of agency-wide forums or repositories on the Internal Communications Network for specific issues or challenges would be of value. They recognized however that there have been improvements. Since the inception of Statistics Canada's Data Science Division and the Data Science Accelerator (in April 2019), information sharing has improved between the CPD and other divisions. For example, some interviewees noted that CPD staff are increasingly engaged in peer reviews and have shared their expertise. In winter 2019, the CPD also formed a data science unit (formally known as the Big Analytics Data team). One of the goals of the unit is to promote cross-divisional sharing of lessons learned on topics such as data science, machine learning and cloud architecture.
How to improve the program
The Assistant Chief Statistician, Economic Statistics (Field 5), should ensure that:
Recommendation 1:
Given the CPD's desire to become more strategic with its communications activities, the division engage corporate communications to improve its knowledge of the new communications tools available. Furthermore, the division should update its communication planning process to include the use of measurement tools (in addition to web metrics) to gather information on the effectiveness of activities. This information will help improve activities such as the communication of program changes to users.
Recommendation 2:
The CPD strengthen its performance measurement framework process for its DPMF projects to ensure that project outcomes are clearly articulated and that indicators are balanced, comprehensive and aligned with the identified outcomes and expected benefits.
Recommendation 3:
The CPD include all activities that have a significant impact on the DPMF projects, such as the HCPI activities, within the governance and oversight structures of the DPMF projects. The adoption of this more holistic approach will improve overall coordination and risk management.
Management response and action plan
Recommendation 1
Given the CPD's desire to become more strategic with its communications activities, the division engage corporate communications to improve its knowledge of the new communications tools available. Furthermore, the division should update its communication planning process to include the use of measurement tools (in addition to web metrics) to gather information on the effectiveness of activities. This information will help improve activities such as the communication of program changes to users.
Management response
Management agrees with the recommendation.
The CPD is working with corporate communications, including the Stakeholder Relations and Engagement Division and the Strategic Communications and Planning Division, to develop a strategic communications and outreach plan. The plan will identify key user groups and specific initiatives (which may include webinars, interactive tools, infographics, analytical papers, videos, use of social media, training) to enhance communication, outreach, awareness and education around the Canadian CPI, and inflation in general.
In parallel, the CPD is working with the Bank of Canada to address a known gap in the inflation perceptions of Canadians. This gap between the official measure of inflation, the CPI, and perceived inflation, highlights the fact that many Canadians cannot see their specific consumer experience in the CPI. Research on potential measurement and behavioural factors to help explain this gap was completed in October 2020 and presented to key stakeholders and partners in the form of four webinars. The gap may be further explained by a lack of general understanding and misconception about what the CPI is and how it is measured.
Work is ongoing to address this, including the release of a Personal Inflation Calculator on November 18, 2020, and a Reddit 'Ask Me Anything' event on November 19, 2020. A number of other initiatives are planned in partnership with the Bank of Canada including publishing research, connecting with media influencers, engaging with private and public sector organizations. The CPD is working with corporate communications to help broaden the reach of CPI data products.
The CPD is currently finalizing a document outlining upcoming plans and changes to the CPI, based on user consultations held over the winter of 2020. This document is planned for publication in 2021 and will provide users with information and transparency around the work required to ensure the ongoing quality and relevance of the CPI.
Finally, enhanced metrics on new and existing data products and tools would be useful, particularly as a way of determining which of the new COVID-related initiatives should continue; these include the Adjusted Price Index and measures of consumer demand (price and sales volumes) for specific products during the pandemic.
Deliverables and timelines
The Assistant Chief Statistician, Economic Statistics (Field 5), will ensure the delivery of:
- An approved Communications, Dissemination and Outreach strategy, developed jointly by the CPD and corporate communications. This will include tools to gather user feedback and metrics on the usefulness of data and products. (April 2021 – Director CPD)
- A proposal for next steps in addressing inflation perception gap - presented to the Statistics Canada - Bank of Canada Statistical Oversight Committee. (April 2021 – Director CPD)
- A proposal for specific dissemination and outreach initiatives to enhance CPI awareness and education for all Canadians – plan and initiatives presented to the CPI Steering Committee. (April 2021 – Director CPD)
Recommendation 2
The CPD strengthen its performance measurement framework process for its DPMF projects to ensure that project outcomes are clearly articulated and that indicators are balanced, comprehensive and aligned with the identified outcomes and expected benefits.
Management response
Management agrees with the recommendation.
The progress of all DPMF projects is reported regularly through the project dashboards. Going forward, both DPMF and non-DPMF project teams will provide updates through the existing governance mechanism, the CPI Steering Committee. In addition, the Performance Measurement Unit will be consulted to assess the feasibility of using existing indicators or developing new ones to measure outcomes. These actions will ensure the project outcomes are clearly identified and measurable, all known interdependencies are accounted for, robust indicators are developed, and expected benefits are achieved.
The CPI Steering Committee will continue to be the forum to discuss risks and challenges related to achieving project outcomes and benefits.
Deliverables and timelines
The Assistant Chief Statistician, Economic Statistics (Field 5), will ensure the delivery of:
- An updated process for project planning and reporting of DPMF and non-DPMF projects to ensure the clear identification of project outcomes and robust indicators. (May 2021 – Director CPD)
Recommendation 3
The CPD include all activities that have a significant impact on the DPMF projects, such as the HCPI activities, within the governance and oversight structures of the DPMF projects. The adoption of this more holistic approach will improve overall coordination and risk management.
Management response
Management agrees with the recommendation.
The CPI is a large program with many interrelated systems, processes and dependencies. In addition, the CPD is at the forefront of many new methods, data sources and tools, which can make it difficult to anticipate the scope of services and costs required. Corporate business solutions for activities such as high capacity processing often take longer than planned and should not limit the consideration of new technologies and tools, which evolve quickly.
Going forward, all relevant activities in the General Survey and Business Process Model (GSBPM) will be identified as part of the project and be reported regularly through project dashboards and the existing governance mechanism, the CPI Steering Committee. This will ensure a holistic approach.
The membership of the CPI Steering Committee will be reviewed to ensure that all services/activities related to the delivery of CPI projects are represented, including IT partners for the storage, processing and analytics of big data. It should be noted that some aspects of these projects may need to be frequently adjusted to take full advantage of new technology solutions outside of the corporate suite of tools.
Deliverables and timelines
The Assistant Chief Statistician, Economic Statistics (Field 5), will ensure the delivery of:
- An updated process for project planning and reporting to ensure all relevant activities that impact DPMF projects will be identified and reported on regularly to the CPI Steering Committee. (May 2021 – Director CPD)
- A completed review of the CPI Steering Committee Membership to ensure key partners are represented and terms of reference for the committee is up to date. (April 2021 – Director CPD)
Appendix A: Explored changes for the dissemination of Consumer Price Index statistical information
1. Change frequency of some city indexes
Disseminate monthly consumer price indexes (CPIs) for five products—all items; shelter; rented accommodation; owned accommodation; and water, fuel and electricity—for 16 cities once per year in March in a separate data table.
2. Increase the number of average price statistics to include provincial estimates
Expand the number of monthly average price estimates from 52 product categories at the national level to a similar number of product categories by province.
3. Discontinue detailed CPI series in all-items aggregation
Terminate CPI series for 50 detailed products listed in Table 18-10-0004-01. Monthly average price estimates will be made available at the provincial level for many of these product categories.
4. Publish a list of products in the CPI
Publish a list of products used in the calculation of the CPI.
5. Discontinue series for special aggregates
Continue disseminating 10 highly relevant special aggregates and terminate 13 others. Users can calculate the 13 terminated special aggregates using tools and guidelines provided by Statistics Canada.
Appendix B: Examples of communication and dissemination products and services
Strategic Communications and Outreach Branch
Client information and consultations
- Day-to-day operational support, as well as administrative support for the Client Relationship Management System community
- Client Relationship Management System reporting
- Application and website usability testing
- Satisfaction surveys
- Focus groups
- Heuristic evaluation (i.e., evaluation that is conducted by an objective third party)
Corporate communications and media relations
- Speeches
- Corporate correspondence
- Communication products
- Media training
- Media monitoring
- Media coverage reports
Social media and events
- Social media
- Online collaboration tools
- Digital online events
- In-person corporate events
Respondent communications
- Development and implementation of initiatives to improve respondent relations and offer support to interviewers
- Support for regional collection by performing activities including writing communications plans for survey collection activities
- Management and updating of the "Information for survey participants" module on the Statistics Canada website
- Management of vanity URL requests
Dissemination Division (Data Access and Dissemination Branch)
- Search solutions (e.g., search engine optimization)
- Centre of Expertise on Accessibility
- Web analytics (including Urchin Tracking Module)
- Dissemination collaborative projects (e.g., development of web portals or enhancements)
Appendix C: Consumer Price Index Portal, March 2020
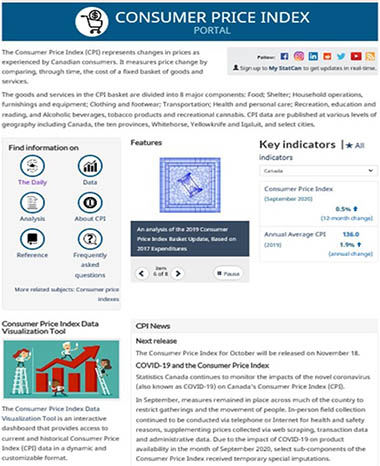
Description - Screenshot of the Consumer Price Index Portal
A screenshot of the Consumer Price Index Portal. The screenshot of the portal shows a short description of the consumer price index; a menu with shortcuts to the Daily, data, analysis, about CPI, reference, and frequently asked questions; a features box; a key indicators box, a link and description to the consumer price index data visualization took; a CPI news box.
Case study: Launching the Consumer Price Index Portal
On August 21, 2019, the agency released the Consumer Price Index (CPI) Portal as a part of its suite of portals.Footnote 24 The CPI Portal showcases the CPI Data Visualization Tool, the most recently released key indicators, a variety of featured products and buttons to easily access CPI products. The portal also hosts new data products on consumer prices and serves as a bulletin board for information about the CPI.
The CPD, in collaboration with the corporate communication function, developed a communication plan identifying the activities and communication tools to be used to inform key stakeholders and the general public of the new portal. The main objective of the communication plan was to maximize the visibility of the portal and website traffic to it. Seven communication activities were identified: an email to stakeholders, an email to My StatCan subscribers, a media advisory, the My StatCan rotator, a notification in The Daily, a social media campaign, and an announcement in the Business and Community Newsletter.
Steps were taken, where possible, to assess the reach and the effectiveness of the communication activities (with the exception of the media advisory email, as the CPD did not pursue this activity). A new tool, called the promotional campaign's Urchin Tracking Module (UTM),Footnote 25 developed by the web analytics team, was used to measure the traffic generated by the different activities. The evaluation team facilitated the implementation of the tracking process, and the CPD was responsible for the implementation of the tracking tool.
By one week after the launch of the CPI Portal (August 21), 721 peopleFootnote 26 had consulted the CPI Portal—this had increased to 1,777 by the end of the first month. The Daily channelled almost half (46.9%).
| Channels | Indicators | Results | |
|---|---|---|---|
| My StatCan email and rotator | Number of users who followed the link received | 142Footnote 27 | 19.7% |
| Emails to stakeholders | |||
| Social media (LinkedIn, Facebook, Twitter, Reddit) |
Number of users who followed the link received | 151 | 20.9% |
| The Daily July release | Number of users who followed the link mentioned in the note to reader | 338 | 46.9% |
| The Business and Community Newsletter | Number of users who followed the link mentioned in the article | 67 | 9.29% |
| Other (e.g., data tables link, search engine) | Number of users | 23 | 3.19% |
| Total | 721 | 100% | |
General observations
To successfully measure the effectiveness of the communication activities, the following should be considered:
- Partnerships: Developing metrics requires close collaboration among internal stakeholders. Metrics should be developed during the planning phase of the communication activities, and all partners should be involved (e.g., web analytics team) to ensure that the right metrics and processes to measure them are in place.
- Baseline: A baseline against which improvements can be measured should be established for each channel and per sector (e.g., social media may be more effective for social statistics than for economic statistics).
- Technical constraints: Technical limitations with some channels (e.g., Outlook, My StatCan) hinder opportunities to measure some indicators (e.g., number of emails opened vs. number of emails sent outside Statistics Canada) and should be addressed. Fixing these limitations will allow the success of the activities to be measured using a predefined contact list.
Appendix D: Statistics Canada modernization initiative
The Vision: A Data-driven Society and Economy
Modernizing Statistics Canada's workplace culture and its approach to collecting and producing statistics will result in greater and faster access to needed statistical products for Canadians. Specifically, the initiative and its projects will:
- Ensure more timely and responsive statistics – Ensuring Canadians have the data they need when they need it!
- Provide leadership in stewardship of the Government of Canada's data asset: Improve and increase alignment and collaboration with counterparts at all levels of government as well as private sector and regulatory bodies to create a whole of government, integrated approach to collection, sharing, analysis and use of data
- Raise the awareness of Statistics Canada's data and provide seamless access
- Develop and release more granular statistics to ensure Canadians have the detailed information they need to make the best possible decisions.
The Pillars
User-Centric Delivery Service
- Users have the information/data they need, when they need it, in the way they want to access it, with the tools and knowledge to make full use of it.
- User-centric focus is embedded in Statistics Canada's culture.
Leading-edge Methods and Data Integration
- Access to new or untapped data modify the role of surveys.
- Greater reliance on modelling and integration capacity through R&D environment.
Statistical Capacity Building and Leadership
- Whole of government, integrated approach to collection, sharing, analysis and use of data.
- Statistics Canada is the leader identifying, building and fostering savvy information and critical analysis skills beyond our own perimeters.
Sharing and Collaboration
- Program and services are delivered taking a coordinated approach with partners and stakeholders.
- Partnerships allow for open sharing of data, expertise and best practices.
- Barriers to accessing data are removed.
Modern Workforce and Flexible Workplace
- Organization is agile, flexible and responsive to client needs.
- Have the talent and environment required to fulfill our current business needs and be open and nimble to continue to position ourselves for the future.
Expected Outcome
Modern and Flexible Operations
Reduced costs to industry, streamlined internal processes and improved efficiency/support of existing and new activities.
Appendix E: Innovation Maturity Survey
In 2018, Statistics Canada conducted a survey to measure the innovation maturity level of the agency across six attributes:Footnote 28
- client expectations: incorporating the expectations and needs of clients in the design and development of innovative services and policies
- strategic alignment: articulating clear innovation strategies that are aligned with the organization's priorities and mandate
- internal activities: building the right capabilities aligned with the innovation strategies
- external activities: collaborating across the whole of government and with external partners to co-innovate policies, services and programs
- organization: fostering the right organizational elements to drive innovation performance at optimal cost
- culture: aligning the innovation goals, cultural attributes and behaviours with the innovation strategies.
The Consumer Prices Division had an overall maturity level similar to the agency, the field and the branch.
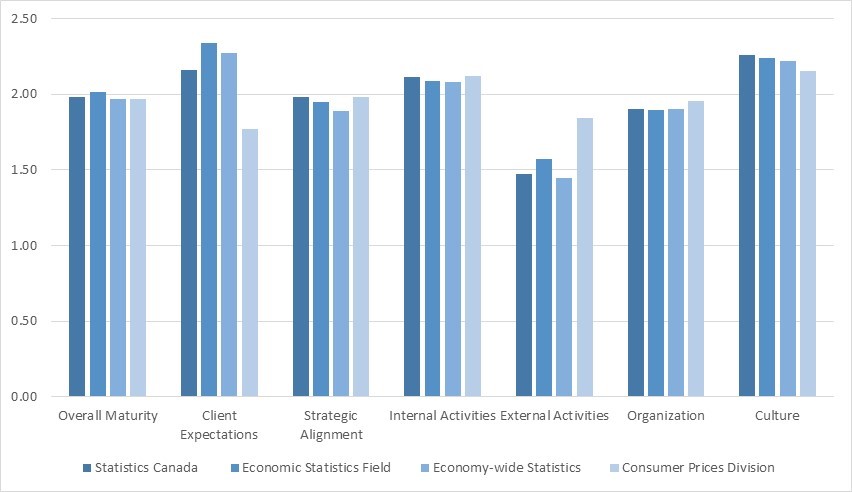
Description - Figure 4 Results from the Innovation Maturity Survey (five-point scale)
| Statistics Canada | Economic Statistics Field | Economy-wide Statistics Branch | Consumer Prices Division | |
|---|---|---|---|---|
| Overall maturity | 1.98 | 2.01 | 1.97 | 1.97 |
| Client Expectations | 2.16 | 2.34 | 2.27 | 1.77 |
| Strategic Alignment | 1.98 | 1.95 | 1.89 | 1.98 |
| Internal Activities | 2.11 | 2.08 | 2.08 | 2.12 |
| External Activities | 1.47 | 1.57 | 1.44 | 1.84 |
| Organization | 1.90 | 1.90 | 1.90 | 1.96 |
| Culture | 2.26 | 2.24 | 2.22 | 2.16 |