Discrimination or unfair treatment means treating people differently, negatively, or adversely because of their race, age, language, religion, gender, and other characteristics. According to data from the 2020 General Social Survey on Social Identity, 54% of Chinese people aged 15 years or older reported that they had experienced discrimination in the 5 years before the COVID-19 pandemic, while 52% of Filipino people and 47% of South Asian people reported they had experienced discrimination
Experiencing discrimination in a store, bank or restaurant, 5 years before the COVID-19 pandemic was highest among Southeast Asian people (58%), followed by Chinese people (53%), South Asian people (50%) and Filipino people (49%)
In the five years before the COVID-19 pandemic, 52% of South Asian people reported experiencing discrimination at work or when applying for a job or promotion, the highest among persons of Asian heritage. This number was 61% for South Asian women and 43% for South Asian men. 45% of Arab people reported experiencing discrimination at work or when applying for a job or promotion. In comparison, approximately 41% of Filipino people and 31% of Chinese people reported experiencing discrimination at work or when applying for a job or promotion but there were no differences by gender
About 31% of Filipino people reported experiencing discrimination when attending school or classes, while this was reported by 27% of Southeast Asian people, 24% of Chinese people and 21% of Arab people
About 39% of Filipino people reported experiencing discrimination because of their race or colour and 30% due to their ethnicity or culture. For South Asian people, 35% reported experiencing discrimination because of their race or colour and 34% due to their ethnicity or culture
Arab people were most likely to report experienced discrimination based on religion (21%), and this number was 25% for Arab women and 17% for Arab men. About 18% of South Asian people experienced discrimination based on religion, and there was small different between South Asian women (18%) and South Asian men (17%)
Statistics Canada, General Social Survey – Social Identity
Education
Many Asian Canadian populations have high levels of education, but there is considerable variation. Among those aged 25 to 64, 6 in 10 Koreans have a bachelor's degree or higher, as do over half of the Chinese, South Asian, and West Asian populations, and more than 4 in 10 among the Arab, Japanese, and Filipino populations
Only among Southeast Asians is the share of Asians with a bachelor's degree or higher (30%) below the national average (33%). This is because many arrived in Canada from Vietnam as refugees from 1979 through the 1980s, and as family-class immigrants in the following years. The second-generation population of Southeast Asians (that is, those who were born in Canada, but had at least one parent born outside Canada) have higher levels of education, with 44% having a bachelor's degree or higher
Location of study also varies across Asian Canadian populations. Among first-generation Asian Canadians (those born outside of Canada) who have a bachelor's degree or higher, the share who completed their degree outside Canada ranges from 89% of the Filipino first-generation population to 47% of the Chinese first-generation population
Major fields of study likewise differ between Asian groups. For example, 40% of West Asians with a postsecondary credential studied STEM (science, technology, engineering, and mathematics) fields, twice as high as in the overall population (20%). Over a quarter (26%) of Filipinos studied health care, also twice as high as in the overall population (13%). And the share of Koreans who studied visual and performing arts (10%) is about three times as high as in the overall population (3%)
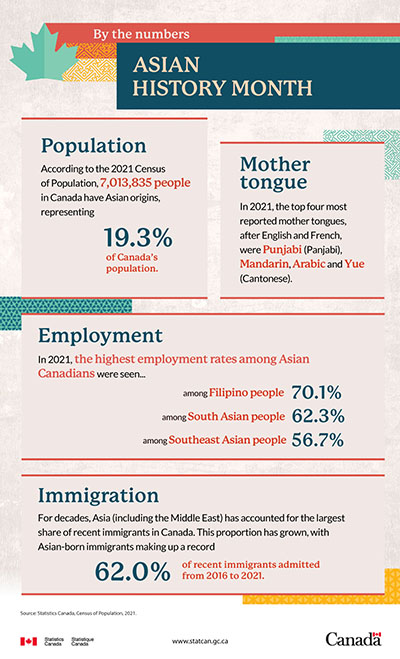
According to Census 2021 data, the overall employment rate was 57.1%. Among Asian Canadians, the highest employment rates were among Filipinos, at 70.1%, followed by South Asians (62.3%) and Southeast Asians (56.7%)
South Asian and Chinese workers had a strong presence in mathematics, computer, and information sciences occupations, accounting for 17.1% and 11.4%, respectively, of all workers in this field. By comparison, South Asians represented 7.4% of all workers while Chinese Canadians represented 4.5% of all workers
In 2021, 6.2% of Canadian commuters used active transportation to get to work, such as walking and bicycling, and 7.4% shared a ride with one or more workers. Among Asian Canadian commuters, 13.5% of Japanese commuters used active transportation and 12.8% of Southeast Asians shared a ride with one or more workers
Just over half of the immigrant population in Canada was born in Asia. In 2021, 51.5% of all immigrants were born in Asia (including the Middle East)
For decades, Asia (including the Middle East) has accounted for the largest share of recent immigrants. This proportion has grown, with Asian-born immigrants making up a record-high 62.0% of recent immigrants admitted from 2016 to 2021
In 2021, Asian countries accounted for 6 of the top 10 countries of birth of recent immigrants: India, the Philippines, China, Syria, Pakistan, and Iran
According to Statistics Canada population projections, by 2041, immigrants born in Asia could represent between 59.2% and 60.0% of all immigrants
In 2021, after English and French, the top 4 mother tongues were languages spoken in Asia (including the Middle East): Punjabi (Panjabi), Mandarin, Arabic and Yue (Cantonese). Each of these languages was the mother tongue of over 600,000 people in Canada
The number of Canadians who spoke predominantly a South Asian language such as Gujarati, Punjabi, Hindi, or Malayalam at home grew significantly from 2016 to 2021, an increase fueled by immigration. In fact, the growth rate of the population speaking one of these languages was at least 8 times larger than that of the overall Canadian population during this period
Immigrants from each immigration wave from Asia, as well as their Canadian-born descendants, have contributed to the ethnocultural diversity of the country's population
In 2021, a total of 7,013,835 people in Canada reported having Asian origins, representing 19.3% of Canada's population
In the entire Canadian population, three Asian origins were among the 20 most reported origins: Chinese (about 1.7 million people), Indian (India) (approximately 1.3 million) and Filipino (925,490)
The racialized population is made up of several groups that are, in themselves, diverse in many respects (e.g., place of birth, ethnic or cultural origins, languages, religion)
In 2021, the South Asian and Chinese groups were the 2 largest racialized groups in Canada, each with a population exceeding 1.5 million. Filipinos were the 4th-largest racialized group, with a population close to 1 million
According to Statistics Canada population projections, in 2041, the South Asian group could top 5 million people, the Chinese population could each exceed 3 million, and the Filipino population could go over 2 million