
A new indicator of weekly aircraft movements
By: Krishna Chaitanya Gopaluni, Statistics Canada
Last year when COVID-19 hit Canada, the federal government placed restrictions on non-essential travel across the country to help contain the spread of the virus. Border restrictions also started on March 18, 2020, on the Canada ̶ United States transborder and other international travel. The Aviation team from Statistics Canada's Canadian Centre for Tourism and Transportation Statistics (CCTTS) publishes detailed monthly aircraft movements statistics two months after the reference period, but these were not timely enough to measure the rapidly changing situation.
Amongst the many data sources the CCTTS uses to produce these monthly statistics are the data they receive from NAV CANADA air traffic control towers. The CCTTS team knew the potential of the data, but they didn't have the skills or time required to efficiently produce quality preliminary estimates. As a result, they collaborated with the Data Science Operationalization team (DSOps), part of Statistics Canada's Data Science Division. Together the teams embarked on a project to produce a new indicator of weekly aircraft movements in Canada to assess the impact of the restrictions on Canadian airports with NAV CANADA air traffic control towers.
DSOps worked with the CCTTS to produce a simple custom application which produces estimated aircraft movements drawn from raw data files reported to the Monthly Aircraft Movements program. This application is used by the analysts from the Aviation team to produce weekly data output files that are then loaded into the table Domestic and international Itinerant aircraft movements for dissemination to the public. Data are updated every week and published 12 days after the reference week.
The weekly estimates enable Statistics Canada to provide a leading indicator on the level of aircraft traffic across the country in a very timely manner. This has proved to be a valuable measure, as air traffic has been severely impacted by the pandemic.
Automating the workflow
As this was a new initiative undertaken during the pandemic, it needed to be done in a way that required minimal time and effort to keep up with the changing circumstances in aviation. Analysts from the CCTTS aviation team were unsure of the optimal way to produce weekly estimates. Although they have access to the raw NAV CANADA files, processing them to get the right information is not straightforward as the data are semi-structured. To expedite this process, the DSOps team developed an automated approach to estimate the weekly aircraft movements so that analysts could easily publish the numbers.
The extracted information, Domestic and international Itinerant aircraft movements, total of all airports with NAV CANADA towers, weekly, was aggregated weekly for domestic, trans-border and other international travel.
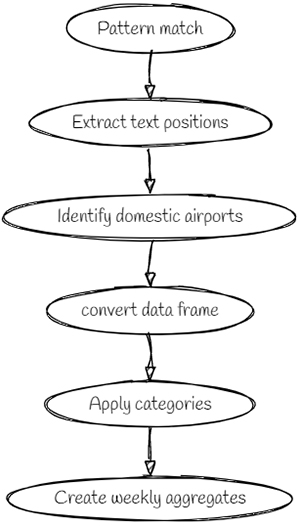
Figure 1 – Steps in the data pipeline
Description - Figure 1
A representation of the steps the data go through as they are processed. Moving through pattern matching, position extraction for matched text, domestic airport identification and conversion to a data frame. The structured data frame is then categorized and weekly aggregates are created.
At first glance, automating this process appeared challenging; however, the DSOps team implemented a Python-based solution which proved useful. They employed a simple pattern matching technique using Python regular expression and the built-in string processing library to extract text from a position in semi-structured data. To achieve this, the team first gathered NAV CANADA data from the stakeholders and leveraged pattern recognition techniques to retrieve entries related to 41 domestic airports and information on domestic, transborder and other international movements. Then, the data were transformed into structured data and stored in a data frame. In the next step of the execution, the application categorized each entry into domestic, trans-border or other international travel based on the metadata. Finally, the numbers corresponding to each category were aggregated into weekly movements. Pandas, a Python data analysis library, was also used to create complex weekly aggregations. The weekly aggregation is dependent on the user-provided start date.
Results after automating the workflow
In the initial release on March 18, 2020, analysts used the automated approach to publish the aggregated estimates on aircraft movements. The results showed a decline in the number of flights from these 41 airports. While analyzing the output of automated workflow, it is often difficult to know the quality of the results. However, in this case, there was plenty of ground truth data in the historically published data. The accuracy of the application output was verified by recreating the already published monthly numbers from the previous year. The validation was an iterative process as the majority of the results from the new Python application were close to the published values. There were some outliers that needed to be explored by the CCTTS experts. Once this step was completed, the code was updated until the preliminary estimates from the new Python application and all the published results were acceptably accurate. Since deploying the application to production there has been only one modification needed, when an additional airport was added to the NAV CANADA data.
Impact on the application users
The analysts in CCTTS use the Common Output Data Repository (CODR) format to publish all results on the Statistics Canada website. CODR is a specific database format to help visualize the exported data. The Python application developed by DSOps also produces the results in CODR format, making it easy to integrate with the analyst's existing flow of publishing the estimates. Also, the application was made simpler to interact with for non-technical users by taking input parameters from Excel files.
Had analysts chose to collect and aggregate the information manually using Excel, it would have been very time-consuming and notably laborious. This process would have had to be repeated every time new data arrived. Any new requirements to the workflow would also have added more overhead. With this in mind, there was a need for an extensible, reusable program that could estimate aggregated numbers for aircraft movements. This simple Python program fulfilled this requirement and saved many hours of manual effort.
DSOps and CCTTS are currently looking into the feasibility of expanding the data being published, such as to include a breakdown by major airport.
More information
For more information on this project, please check out:
- Date modified: