
By: Uchenna Mgbaja, Nazmus Sakeef, Kendrick Moreno, Catrina Llamas, and Roe Alincastre; NorQuest College
Introduction
The Edmonton Food Drive (EFD) Project is a collaborative effort between NorQuest College, LDS Church, etc. to improve the logistics of one of Alberta’s largest community food donation initiatives. The current food donation management system faces challenges in coordinating drop-off locations, pick-up processes, and route planning. There is a need to automate and enhance these processes to ensure timely collection of donations and minimize logistical complexities.
This multi-stakeholder project supports over 40,000 people monthly by distributing over 400,000 meals to people in need. These figures show the significant demand within the community and highlight the critical role of collaborative efforts in combating food insecurity.
The objective of this project was to develop a machine learning solution to enhance the management of food donation activities in Alberta. The project aims to increase the efficiency and effectiveness of drop-off and pick-up processes, streamline route planning, and improve resource allocation.
Proposed Solutions
A key component of the Edmonton Food Drive is the role played by Wards and Stakes, organizational units within The Church of Jesus Christ of Latter-day Saints (LDS), which facilitate volunteer participation and logistical coordination.
In the LDS Church, a ward is a local congregation that serves a specific geographic area, while a stake is a larger administrative unit composed of multiple Wards. In the context of the EFD Project, Stakes oversee multiple Wards, providing organizational support and resources, while Wards coordinate volunteer efforts, donation collection, and route management within their respective areas.
Building on the objectives of the project, the following solutions were proposed and developed to tackle the identified challenges:
- Data Collection Improvements:
Create data-acquisition forms to collect data from Wards via structured surveys, enabling volunteers to answer questions as quickly and efficiently as possible.
- Trend Analysis:
Use data visualization and statistical techniques to perform a year-over-year analysis, revealing critical trends and performance indicators.
- Interactive Dashboards:
Create user-friendly, interactive dashboards that allow stakeholders to easily explore and compare data, facilitating more informed decision-making.
- Predictive Modeling:
Implement machine learning techniques to develop a predictive model that forecasts donation patterns and identifies emerging trends.
- Efficiency Forecasting:
Build a predictive model to estimate which Wards or Stakes will have the greatest impact in terms of efficiency for 2025.
- Route Mapping Application:
Develop a route digitization application that automatically generates digitized maps for volunteers, improving operational efficiency. Create a route mapping application that generates interactive maps for volunteers, focusing on high-demand or hot-zone addresses for long-term operational efficiency.
These proposed solutions aimed to streamline operational processes, enhance stakeholder engagement, and leverage predictive insights to improve the planning and execution of future food drives.
Methodology
Data Collection
Data on donation volumes, routes, and volunteer participation were gathered during the Edmonton Food Drive in September 2023 & September 2024. Data was collected from 6 assigned Stakes and 27 Wards. This data was systematically collected from designated drop-off centers, as assigned by client representatives, ensuring accurate coverage of specific routes and regions. While comprehensive within the assigned scope, the data did not represent all collection points across Edmonton, limiting its full-city applicability.
Datasets:
We started our analysis on data collected in 2023 from Wards. In 2024, we added data validation rules to mitigate the risks of wrong data entries while ensuring that the time required for volunteers to complete the form remains as short as before.
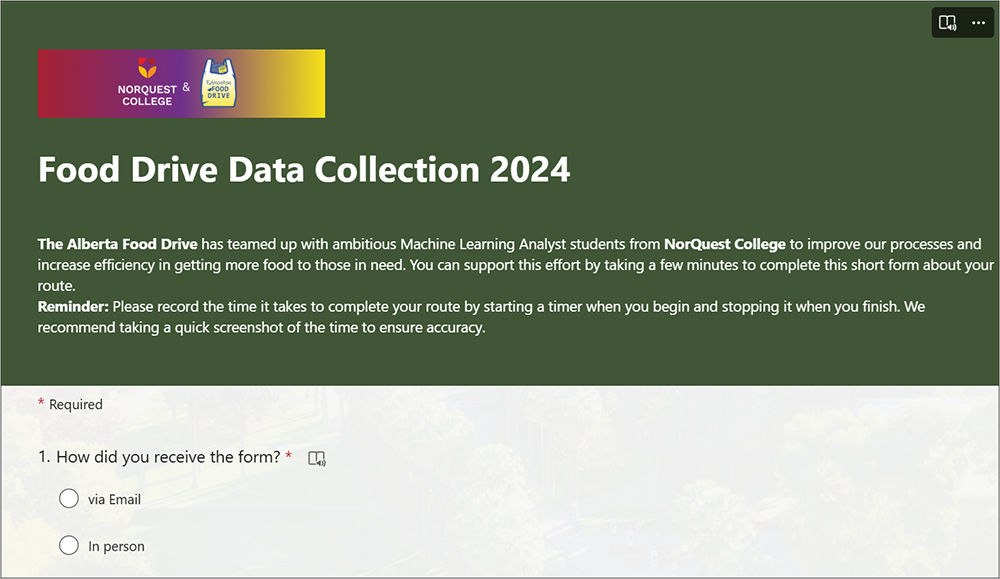
Figure 1: Data Acquisition Form for Edmonton Food Drive 2024
Description: This dataset includes 653 samples and 31 features, gathered through a Microsoft Form completed by volunteers. The form was used to record details related to the logistics of claimed donation bags during the 2024 Edmonton Food Drive, providing valuable data for analysis and resource optimization.
The data collected in 2023 focused on essential information related to donation collection, volunteers, and routes. While it provided a solid foundation, it was limited in terms of data validation and feature richness. The dataset consisted of 13 features and 454 samples.
| Column Name | Description |
|---|---|
| Date | The date of the food drive activity took place. |
| Location | The specific area or neighborhood where the food drive was conducted. |
| Stake | The organization or group responsible for managing the volunteers in the area. |
| # of Adult Volunteers | The number of adult volunteers who participated in the activity. |
| # of Youth Volunteers | The number of youth volunteers who participated in the activity. |
| Donation Bags Collected | The total number of donation bags collected during the activity. |
| Time to Complete (min) | The total time (in minutes) taken to complete the assigned route(s). |
| Completed More Than One Route | Indicates whether more than one route was completed (e.g., Yes/No). |
| Ward | The municipal ward where the food drive activity occurred. |
| Routes Completed | The total number of routes were completed by the volunteers. |
| Doors in Route | The total number of doors covered within the assigned route. |
| Route Number/Name.1 | The identifier or name of the route assigned to the volunteers. |
| Time Spent | The total duration volunteers spent during the food drive activity. |
| # of Adult Volunteers | The number of adult volunteers who participated in the activity. |
Table 1: Feature Information of EFD 2023 dataset
Description: This dataset comprises data collected via a Google Form during the Edmonton Food Drive 2023. Number of features: 13; Number of samples: 454
| Column Name | Description |
|---|---|
| ID | A unique identifier assigned to each form submission. |
| Start time | The time the volunteer began filling out the form. |
| Completion time | The time the volunteer completed the form. |
| The email address provided by the volunteer. | |
| Name | The name of the volunteer. |
| How did you receive the form? | The method through which the volunteer received the form (e.g., email, link). |
| Email address | The contact email address for further communication. |
| Drop Off Location | The primary location where donations were dropped off. |
| Other Drop-off Locations | Additional locations where donations were dropped off. |
| Stake | The specific stake responsible for organizing the volunteer's participation. |
| Bonnie Doon Stake | Indicates involvement with the Bonnie Doon Stake. |
| Edmonton North Stake | Indicates involvement with the Edmonton North Stake. |
| Gateway Stake | Indicates involvement with the Gateway Stake. |
| Riverbend Stake | Indicates involvement with the Riverbend Stake. |
| Sherwood Park Stake | Indicates involvement with the Sherwood Park Stake. |
| YSA Stake | Indicates involvement with the Young Single Adults (YSA) Stake. |
| Route Number/Name | The identifier or name of the donation collection route. |
| Time Spent Collecting Donations | The total time spent collecting donations for the route. |
| # of Adult Volunteers who participated in this route | The number of adult volunteers involved in this specific route. |
| # of Youth Volunteers who participated in this route | The number of youth volunteers involved in this specific route. |
| # of Doors in Route | The total number of doors covered within the route. |
| # of Donation Bags Collected | The total number of donation bags collected from the route. |
| Did you complete more than 1 route? | Indicates whether the volunteer completed more than one route (e.g., Yes/No). |
| How many routes did you complete? | The total number of routes completed by the volunteer. |
| Additional Routes completed (2 routes) | Details about a second additional route completed, if applicable. |
| Additional routes completed (3 routes) | Details about a third additional route completed, if applicable. |
| Additional routes completed (3 routes)2 | Details about another third route completed, if applicable. |
| Additional routes completed (More than 3 Routes) | Details about additional routes completed beyond three, if applicable. |
| Additional routes completed (More than 3 Routes)2 | Further details about routes completed beyond three, if applicable. |
| Additional routes completed (More than 3 Routes)3 | Further details about routes completed beyond three, if applicable. |
| Comments or Feedback | Any additional comments, suggestions, or feedback provided by the volunteer. |
Table 2: Feature Information of EFD 2024 dataset
Description: This dataset comprises data collected via a Microsoft Form during the Edmonton Food Drive 2023. Number of features: 31; Number of samples: 653
Geographical Information Extraction: City of Edmonton Neighborhood Dataset
To complement the food drive data, the City of Edmonton Neighborhood Dataset [Link] was integrated into the analysis. This dataset provided geographic coordinates and neighborhood names, enabling a geospatial analysis of donation trends and route efficiency.
Geographical information was extracted from the Property Assessments dataset and merged to the Food Drive Data using the unique Neighborhood Names. This data was then used to generate maps that provide visual insights into neighborhood-level donation patterns and trends. The columns shown in Table 3 were specifically extracted for this purpose:
| Column Name | Description |
|---|---|
| Neighborhood Name | The official name of the neighborhood in the City of Edmonton. |
| Latitude | The geographic coordinate specifying the north-south position of the neighborhood. |
| Longitude | The geographic coordinate specifying the east-west position of the neighborhood. |
Table 3: Feature Information of City of Edmonton Neighborhood dataset
Description: The City of Edmonton Neighborhood Geographical coordinates data provides comprehensive information about neighborhood boundaries, demographics, land use, and other characteristics for urban planning and analysis. Number of features: 3; Number of samples: 427
This information was crucial for creating interactive geospatial visualizations and digitized route mapping for the Edmonton Food Drive
Exploratory Data Analysis
The collected data was cleaned and prepared for analysis to ensure accuracy and consistency. Key visualizations were generated to provide comparative insights, focusing on identifying trends and patterns in donation volumes, volunteer allocation, and route efficiency. Insights were limited to the data collected from the assigned drop-off centers, emphasizing the need for a more comprehensive data collection strategy in future drives. Our Exploratory Data Analysis strategy involved examining each feature individually and performing detailed analyses for each.
We conducted a comprehensive analysis of the Edmonton Food Drive data, focusing on uncovering patterns and relationships to improve the understanding of key variables and enhance future efforts. The analysis began by examining the frequency and distribution of drop-off locations, exploring their relationship with variables such as the number of donation bags collected, and the number of volunteers involved. The frequency of different "Stake" values was assessed, and their impact on numerical features, including the number of doors and donation bags, was closely analyzed.
Further, we explored time-related aspects, analyzing the frequency of various time categories and investigating how the time spent differed across "Stakes" and "Wards". The distribution of data across Wards was another area of focus, examining how specific Wards influenced other variables, such as the number of donation bags and routes. Volunteer participation was also analyzed, with particular attention given to the correlation between adult volunteers and other numerical features, as well as the overall distribution of volunteers across different areas.
The distribution of the number of doors was assessed in relation to categorical variables, and the average number of doors by "Stake" was calculated. Additionally, the relationship between donation bags and the number of routes was analyzed, comparing variations in donation bags across locations and Wards. Yearly trends were also explored, identifying changes in donation volumes and total volunteer numbers over time.
Through this analysis, we uncovered valuable insights into the relationships between drop-off locations, volunteers, and donation trends.
Data Refinement:
For the EFD 2024 dataset, we identified the following issues and applied the respective methods to address them.
| Issues Detected | Refining Method |
|---|---|
| Too long column names | Rename column names for clarity |
| Inconsistent string formats | Removed leading and trailing spaces Converted to title format Removed unnecessary characters |
| Incorrect and inconsistent data types | Converted variables to the correct data types |
| Detected null values | Numeric Variables: Performed mean imputation to replace null values, preserving the dataset's distribution by using the feature's average. Categorical Variables: No null values detected |
| Detected empty values | Tagged empty categorical fields with placeholders (e.g., "Unknown Routes") |
| Duplicated values | Dropped duplicated values and columns |
| Too many irrelevant data | Dropped irrelevant columns |
| Identified outliers | Detected using IQR method and imputed using mean |
| Table 4: Identified Issues in the EFD 2024 Dataset and Their Respective Solutions | |
After performing data refining on the EFD 2024 dataset, we merged it with the EFD 2023 dataset and the City of Edmonton Neighborhood dataset. We used our final cleaned dataset for further analysis.
Data Visualization:
We created interactive visualizations using Tableau to make our EDA findings easy to understand. These visualizations allow users to explore the data and gain insights through dynamic charts and maps. The dashboard includes various charts and maps that present the key aspects of our analysis in a simple and clear way. Figure 2 shows the visualizations included in the dashboard that help support our overall analysis.
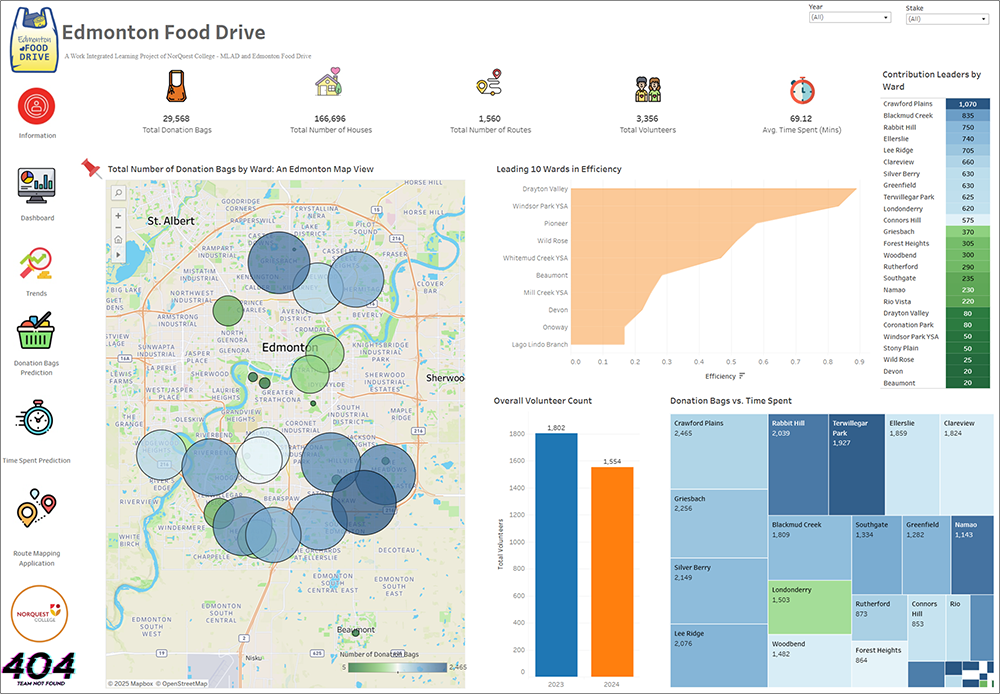
Figure 2: Interactive Dashboard of the Edmonton Food Drive 2024 Visualized Using Tableau
Description: This dashboard provides an overview of key metrics related to the Edmonton Food Drive, including donation trends, distribution data, and community engagement. Using Tableau's interactive features, users can explore the data to gain insights into the food drive's impact and performance throughout 2024.Key features of the dashboard include:
- KPI Card for Key Features: Displays the total number of donation bags, houses, routes, volunteers, and average time spent, based on the selected criteria.
- Total Number of Donation Bags by Ward: This map of Edmonton shows the distribution of donation bags across different wards, providing a clear comparison of how they are spread throughout the city.
- Leading 10 Wards in Efficiency: Highlights the top 10 wards with the highest efficiency, showcasing their performance across key metrics.
- Overall Volunteer Count: A bar chart comparing volunteer counts over different years, offering insights into trends and changes over time.
- Contribution Leaders by Ward: A heatmap showing the contributions from each ward, using color gradients to highlight the areas with the highest and lowest contributions.
- Donation Bags vs. Time Spent Chart: A visualization comparing the number of donation bags to the time spent, providing insights into the efficiency of the donation process.
Machine Learning
Before developing and evaluating machine learning models, we performed several data preparation steps to ensure high-quality inputs
Feature Engineering
To enhance the dataset, we introduced three new features:
- Total Volunteers: The sum of Total Adult Volunteers and Total Youth Volunteers.
- Donation Bags per Door: The number of donation bags divided by the number of doors.
- Donation Bags per Route: The number of donation bags divided by the number of routes.
Additionally, we applied one-hot encoding to the Wards feature to handle categorical data and ensure all variables were properly formatted for modeling.
Data Splitting and Normalization
We split the data into training and testing sets, using 2023 data for training and 2024 data for testing. This approach allowed us to validate model performance on unseen data. To maintain consistency across numerical features, we applied normalization, ensuring all values were on a comparable scale before feeding them into the models.
Model Development and Evaluation
Following data preparation, we implemented and tested six different machine learning models for two prediction tasks:
- Total number of donation bags.
- Time spent for each ward.
Each model was evaluated to identify the most accurate one for each prediction task. The results below summarize their performance and effectiveness.
| Model | MSE | RMSE | MAE | R² | Adjusted R² |
|---|---|---|---|---|---|
| Linear Regression | 3393.986256 | 58.257929 | 26.828851 | -0.100185 | -0.168338 |
| Polynomial Regression | 49.838645 | 7.059649 | 2.388835 | 0.983844 | 1.146869 |
| Decision Tree Regression | 2356.665557 | 48.545500 | 8.232945 | 0.236070 | 0.188747 |
| Random Forest Regression | 1990.524740 | 44.615297 | 8.457754 | 0.354757 | 0.314786 |
| Gradient Boosting Regression | 2144.987415 | 46.314009 | 8.164502 | 0.304687 | 0.261615 |
| K-Nearest Neighbors Regression | 3092.228686 | 55.607811 | 17.474875 | -0.002368 | -0.064461 |
| Table 5: Performance Metrics for Models Predicting Total Donation Bags | |||||
Based on the results, the best model for predicting total donation bags is Polynomial Regression, as it achieves the lowest RMSE (7.059649) and MAE (2.388835) while attaining the highest R² score (0.983844), indicating a strong fit and high predictive performance.
| Model | MSE | RMSE | MAE | R² | Adjusted R² |
|---|---|---|---|---|---|
| Linear Regression | 1.583989 | 1.258566 | 0.917151 | 0.075887 | 2.771216 |
| Polynomial Regression | 0.708581 | 0.841772 | 0.634814 | 0.586608 | 1.014787 |
| Decision Tree Regression | 0.192435 | 0.438674 | 0.356527 | 0.887732 | 1.215181 |
| Random Forest Regression | 0.216073 | 0.464836 | 0.377927 | 0.873941 | 1.241613 |
| Gradient Boosting Regression | 0.256885 | 0.506838 | 0.391840 | 0.850131 | 1.287249 |
| K-Nearest Neighbors Regression | 0.278344 | 0.527583 | 0.394887 | 0.837612 | 1.311244 |
| Table 6: Performance Metrics for Models Predicting Time Spent | |||||
For predicting time spent, the Decision Tree Regression model stands out as the best among the listed options. It achieves the lowest RMSE (0.438674) and MAE (0.356527), coupled with a high positive R² (0.887732) and Adjusted R² (1.215181), indicating superior accuracy and a strong fit to the data compared to the other models.
Model Optimization:
For the Polynomial Regression model used to predict total donation bags, we opted not to perform additional tuning to avoid the risk of overfitting. Since the metrics were already acceptable, with an R² score of 0.98, further increasing model complexity could lead to diminished generalization and overfitting the training data.
Advanced Analysis:
We used the Polynomial Regression and Decision Tree models to predict the number of donation bags and time spent per Ward for 2025. Below are some key insights based on the predicted values.
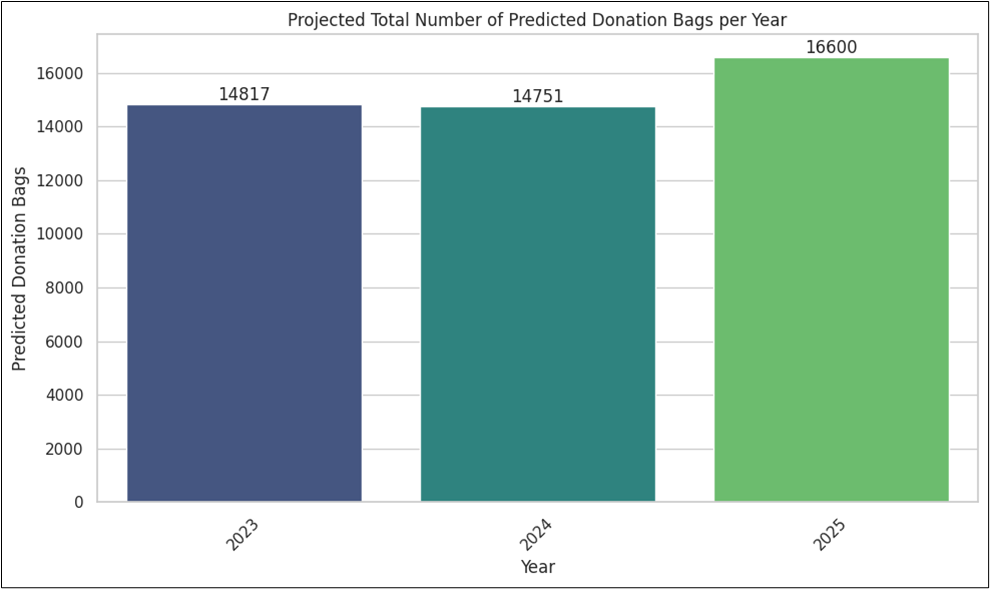
Figure 3: Projected Total Number of Predicted Donation Bags for 2025
Description: This figure visualizes the estimated number of donation bags for 2025 based on the best-performing predictive model. It provides insights into expected donation trends, helping to anticipate resource needs and optimize collection efforts.The predicted number of donation bags for next year shows a steady increase. Starting at 14,817 in 2023 and 14,751 in 2024, the total number of donation bags is expected to grow, reaching 16,600 in 2025.
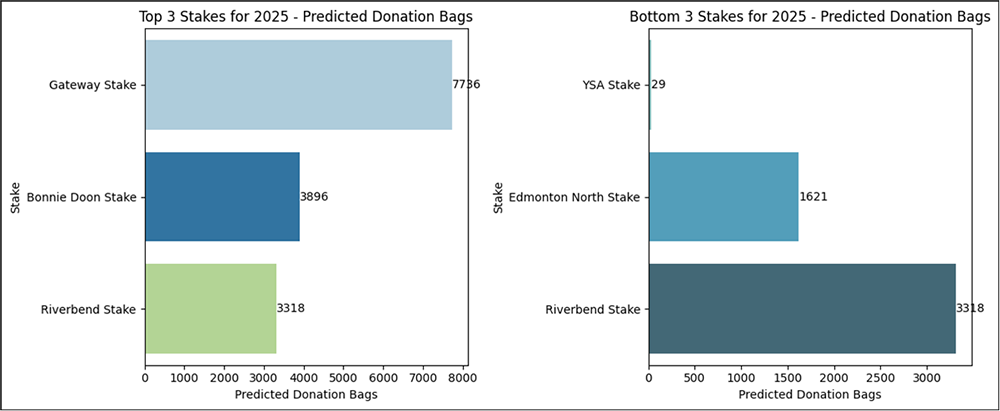
Figure 4: 12-Month Outlook of Donation Bags: Top and Bottom 3 Stakes
Description: This figure presents the projected donation bag counts over the next 12 months, highlighting the top three and bottom three Sakes based on expected contributions. It helps identify areas with the highest and lowest predicted donations, supporting targeted outreach and resource allocation.The 12-month outlook for donation bags reveals the top and bottom-performing Stakes. The top three Stakes, which are expected to contribute the most to donation bags, are Gateway, Bonnie Doon, and Riverbend. On the other hand, the bottom three Stakes, contributing fewer donation bags, are YSA, Edmonton North, and Riverbend.
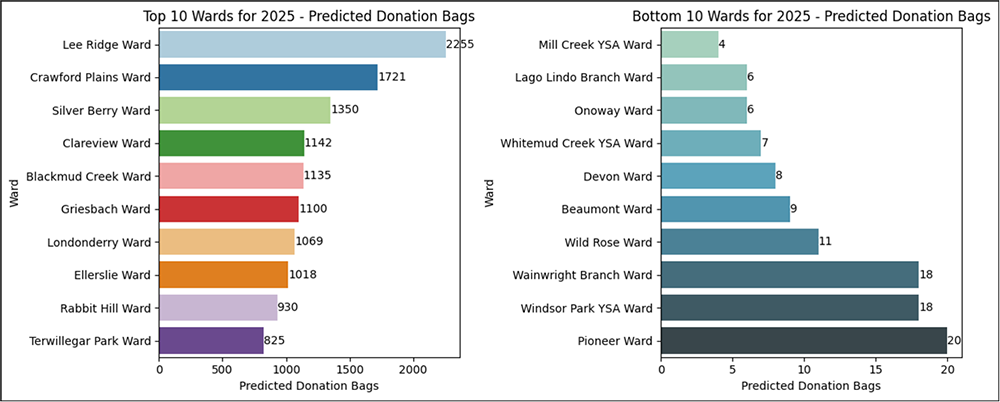
Figure 5: 12-Month Outlook of Donation Bags: Top and Bottom 10 Wards
Description: This figure displays the projected donation bag counts over the next 12 months, identifying the top 10 and bottom 10 Wards based on predicted contributions. These insights help prioritize support and optimize donation collection efforts across different areas.The 12-month outlook for donation bags reveals the top and bottom-performing Wards. The top 10 Wards expected to contribute the most donation bags are Lee Ridge, Crawford Plains, Silver Berry, Clareview, Blackmud Creek, Griesbach, Londonderry, Griesbach, Ellerslie, Rabbit Hill and Terwillegar. On the other hand, the bottom 10 Wards, which are projected to contribute fewer donation bags, include Mill Creek YSA, Lago Lindo, Onoway, Whitemud Creek YSA, Devon, Beaumont, Wild Rose, Wainwright, Windsor Park, and Pioneer. These insights show a notable variation in donation contributions across different Wards.
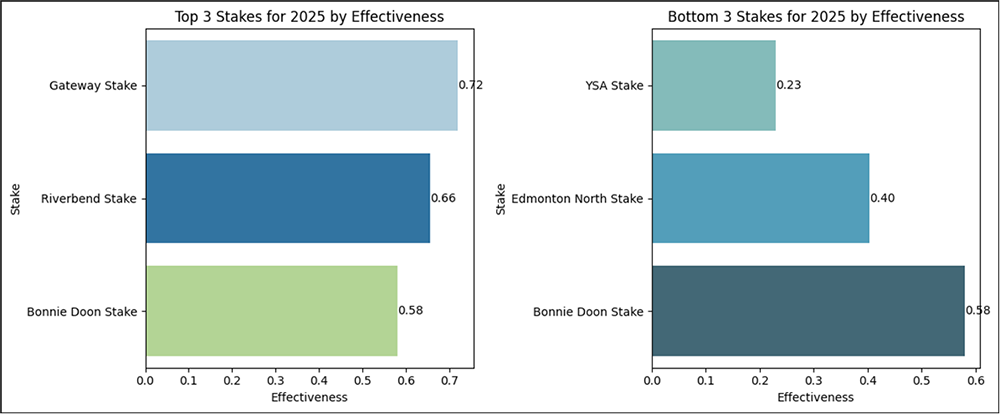
Figure 6: 12-Month Outlook of Effectiveness: Top and Bottom 3 Stakes
Description: This figure illustrates the projected effectiveness of donation collection efforts over the next 12 months, highlighting the top three and bottom three Stakes based on performance metrics. It provides a comparison of areas with the highest and lowest expected impact, helping to focus resources where they are most needed.The top 3 Stakes with the highest effectiveness (i.e., they are expected to generate the most donation bags per unit of time spent) are Gateway, Riverbend and Bonnie Doon. On the other hand, the bottom 3 Stakes with the lowest effectiveness, meaning they are expected to have the least donation bags per unit of time spent, are YSA, Edmonton North, and Riverbend.
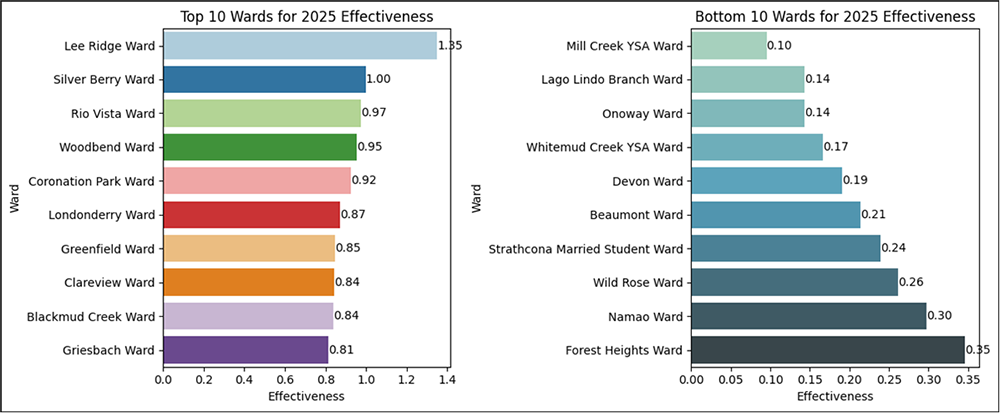
Figure 7: 12-Month Outlook of Effectiveness: Top and Bottom 10 Wards
Description: This figure showcases the projected effectiveness of donation collection efforts over the next 12 months, highlighting the top 10 and bottom 10 Wards based on performance metrics. It offers valuable insights into where donation collection efforts are expected to be most and least effective, guiding targeted strategies.The top 10 Wards with the highest effectiveness, meaning they are expected to generate the most donation bags per unit of time spent, are Lee Ridge, Silver Berry, Clareview, Rio Vista, Woodbend, Coronation Park, Londonderry, Greenfield, Clareview, Blackmud Creek and Griesbach. These Wards are predicted to be more efficient in converting time spent into donation bags.
In contrast, the bottom 10 Wards with the lowest effectiveness, meaning they are expected to have the least donation bags per unit of time spent, include Mill Creek YSA, Lago Lindo Branch, Onoway, Whitemud Creek YSA, Devon, Beaumont, Strathcona Married Student, Wild Rose, Namao and Forest Heights. These Wards are projected to require more time to achieve similar numbers of donation bags, reflecting a lower efficiency in their donation efforts.
Deployment
The final application was divided into six sections: the Information Page, Dashboard Page, Trends Page, Donation Bags Prediction Page, Time Spent Prediction Page, and Route Mapping Application Page. Each page has a distinct feature designed to deliver specific insights and valuable information to its users, ensuring a comprehensive experience. Together, these sections allow users to easily navigate through different functionalities, making data-driven decisions more accessible and efficient. Figure 8 shows the application’s dashboard page.
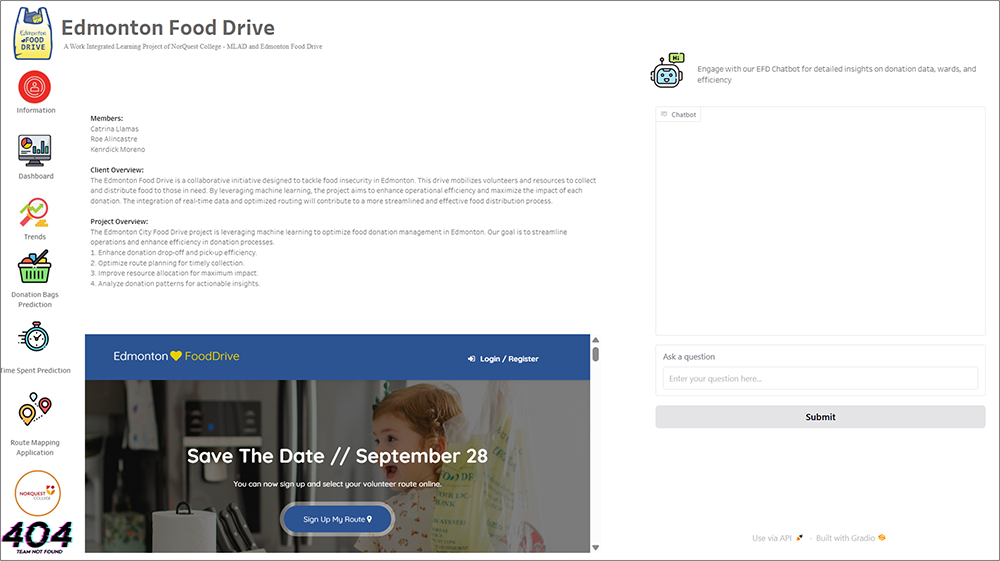
Figure 8: Interactive Dashboard of Deployed Edmonton Food Drive Application
Description: This figure showcases the interactive interface of the Edmonton Food Drive Application, developed to enhance food donation logistics in Edmonton. The application integrates machine learning and user-friendly tools, empowering stakeholders to optimize donation collection and volunteer coordination.The application was deployed on Tableau, where interactive visualizations were created to represent donation trends, volunteer participation, and route mapping insights.
- Route mapping was further enhanced using Hugging Face's Gradio, which allowed users to interactively explore donation routes.
- A chatbot, also embedded using Gradio, provided users with quick responses to queries related to routes and donation processes.
Route Mapping Application:
The Route Mapping Application was developed in response to the client's recurring challenges with generating accurate and efficient maps for volunteer routes. The previous process involved manually printing portions of the Edmonton map, highlighting routes by hand, and then distributing the maps to volunteers, which was time-consuming and prone to errors. This manual approach not only slowed down operations but also increased the risk of mistakes that could affect the efficiency of the donation collection process. Our application simplifies and automates route generation and visualization, enhancing overall efficiency, accuracy, and ease of use for volunteers. Below are images of the manually printed maps that were previously used, highlighting the need for this more efficient solution.
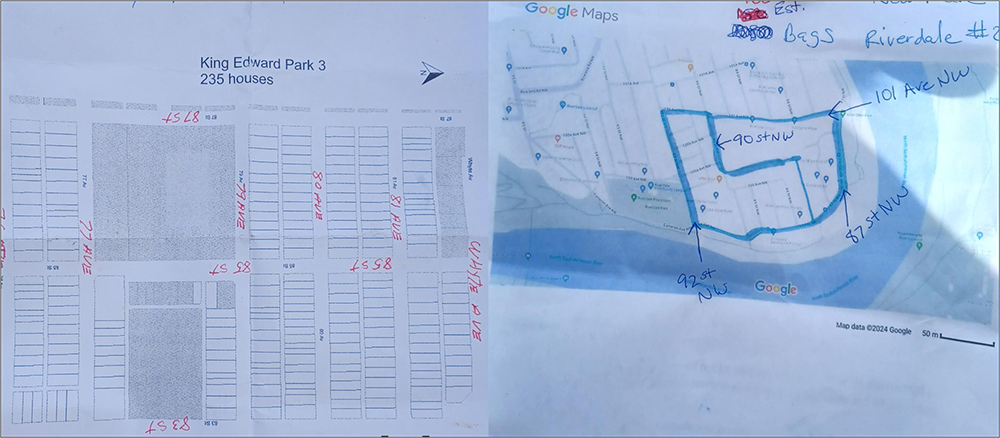
Figure 9: Example of Manually Printed Maps Used for Volunteer Allocation
Description: This figure presents an example of the manually printed maps utilized for volunteer allocation during the Edmonton Food Drive. Annotated with route boundaries and key landmarks, these maps were created to guide volunteers in navigating their assigned areas efficiently. These manually marked maps emphasize the need for clear route planning and highlight the potential improvements that can be made through automated map generation tools.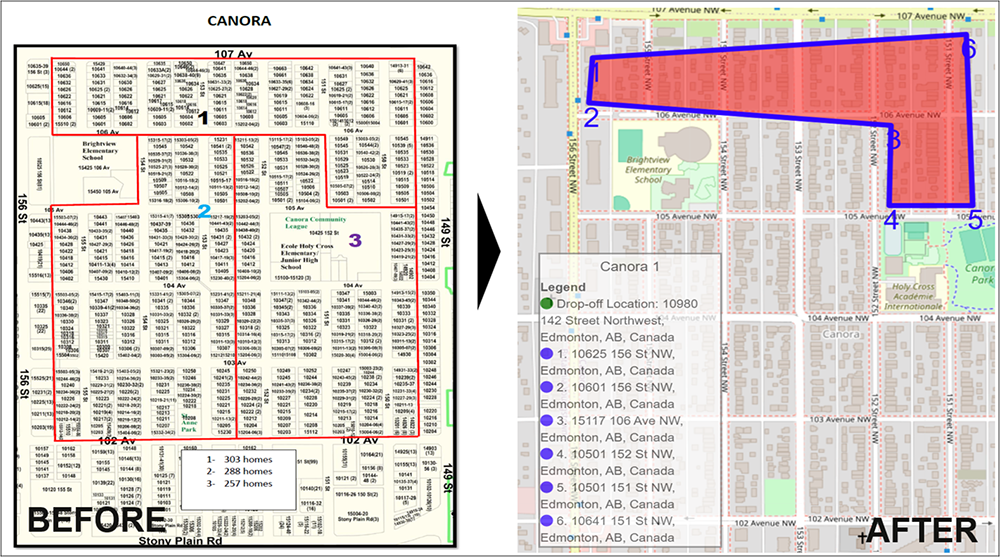
Figure 10: Before and After: Map Generation Comparison Using Fixed Mode.
Description: Fixed Mode, in contrast to Custom Mode, is designed for route mapping by focusing on specific predefined routes. The process involves identifying hot zone addresses, inputting the required parameters into the application, generating the map, downloading it, and distributing it to the volunteers. Hot zone addresses refer to homes that consistently donate bags, making them crucial for streamlining the donation collection process and optimizing volunteer efforts.The application offers two modes: Fixed Mode and Custom Mode. The Fixed Mode aims to digitize the map generation process for our client, streamlining their workflow. Custom Mode, on the other hand, is designed for long-term planning, generating maps based on identified hot zones to enhance route efficiency.
To generate maps in Fixed Mode, the client only needs to select the desired ward and route, click "Submit," download the generated map, and then easily email it to the volunteers. This streamlined process eliminates the need for manual map creation, saving time and effort. The provided image shows the before and after results of generating maps using Fixed Mode, highlighting the efficiency and ease of the new approach.
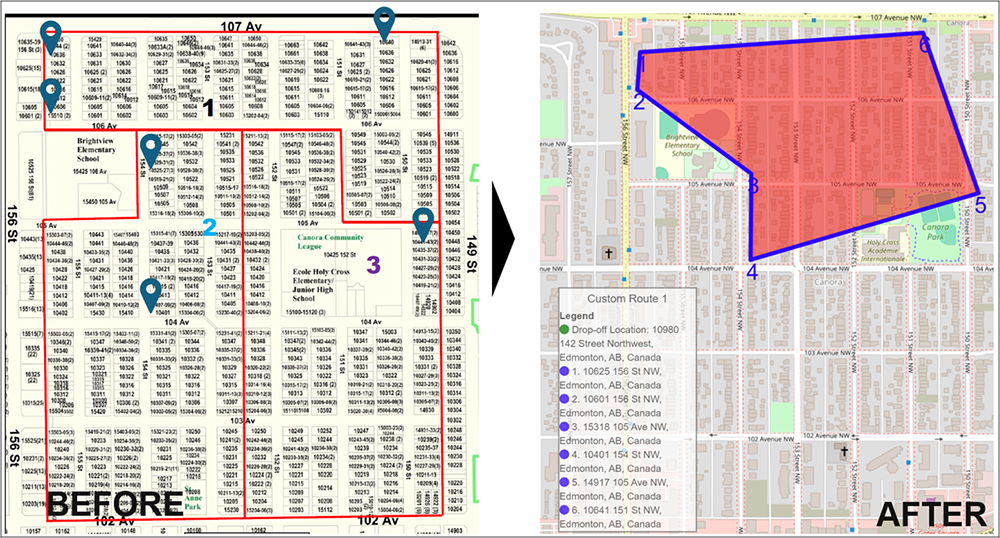
Figure 11: Before and After: Map Generation Comparison Using Custom Mode
Description: The image compares the manual and automated map generation processes. The pins represent the hot zone addresses from Routes 1, 2, and 3. Previously, the client had to manually input these six addresses, but now the application calculates the optimal route order based on the distance between them. This ensures that volunteers follow the most efficient path, saving time. Volunteers no longer need to cover all three routes; instead, they can focus on specific portions of each route, significantly improving efficiency and streamlining the donation collection process.This methodology not only highlights the strengths of the analysis but also shows areas for improvement in data collection and coverage to enhance future decision-making processes.
Results & Findings
The Edmonton Food Drive Project yielded several valuable insights and practical outcomes through the analysis and modeling of the collected data. These findings are categorized into key areas of operational improvement: Data collection, Data Analysis, Predictive Modelling, and Application Deployment.
Data Collection
Key Observations:
The data revealed notable year-over-year trends, with some Wards exhibiting consistent donation patterns, while others showed significant variability in donation volumes.
Belmead Ward, despite being the focus of detailed analysis, highlighted limitations in data completeness, as not all routes were accounted for due to the granularity of volunteer-reported data.
Data Analysis
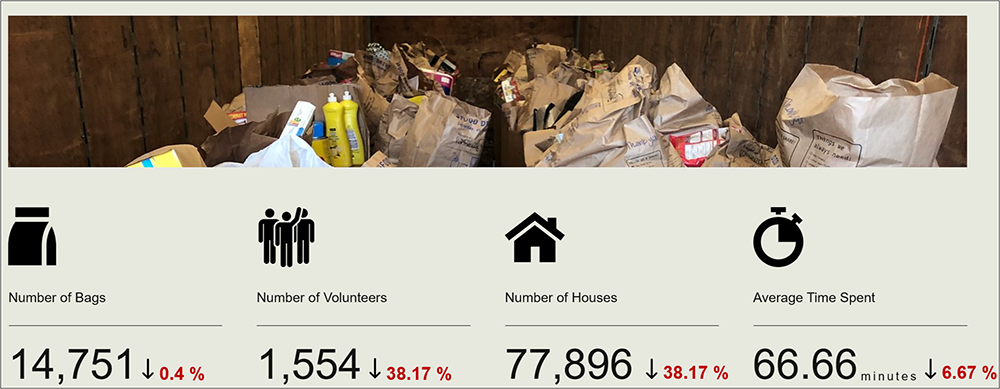
Figure 12: 2024 vs 2023 EFD Highlights
Description: This figure compares key metrics and outcomes from the 2024 and 2023 Edmonton Food Drive, highlighting the improvements and differences in donation collection and volunteer coordination between the two years. The comparison provides insights into the effectiveness of new strategies and tools implemented in 2024.Compared to the 2023 food drive, the 2024 results showed a decrease in several key metrics: the number of donation bags, number of volunteers, number of houses, and average time spent per route decreased by 0.4%, 38.17%, 38.17%, and 6.67%, respectively.
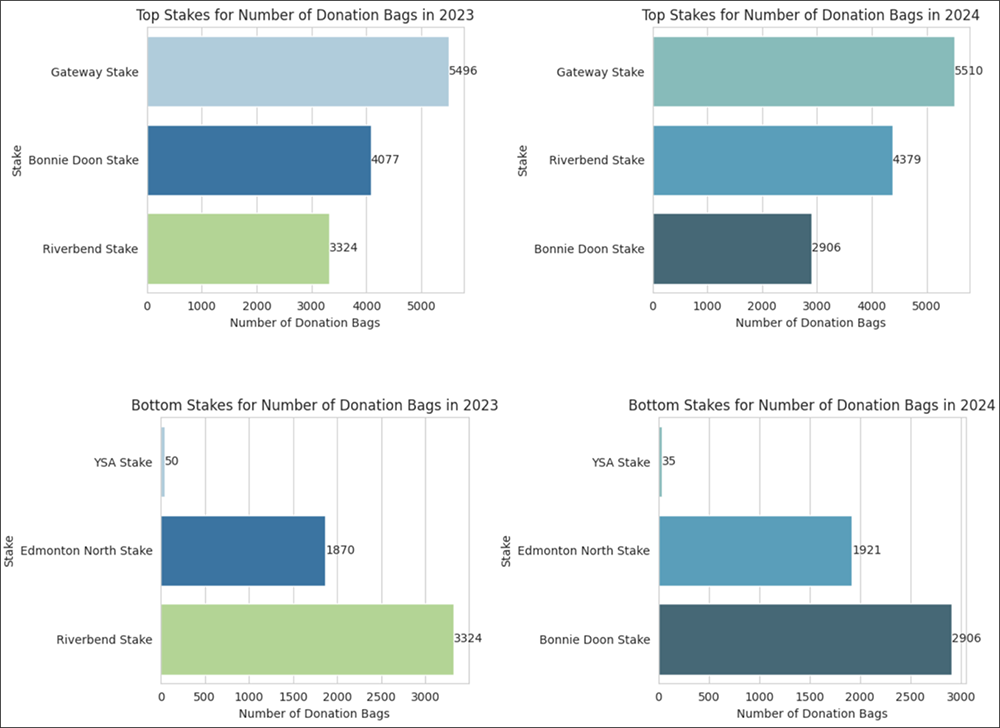
Figure 13: Top and Bottom Three Stakes of 2023 and 2024
Description: This figure compares the top and bottom three Stakes for the Edmonton Food Drive in 2023 and 2024, showcasing changes in donation levels and performance across different stakes. The comparison helps identify areas of improvement and highlights the impact of any new strategies implemented in 2024.The top Stakes in 2024 remained largely consistent with 2023, with Gateway, Bonnie Doon, Riverbend, Edmonton North, and YSA leading the rankings. However, Riverbend and Bonnie Doon swapped positions, indicating a slight shift in their relative performance between the two years.
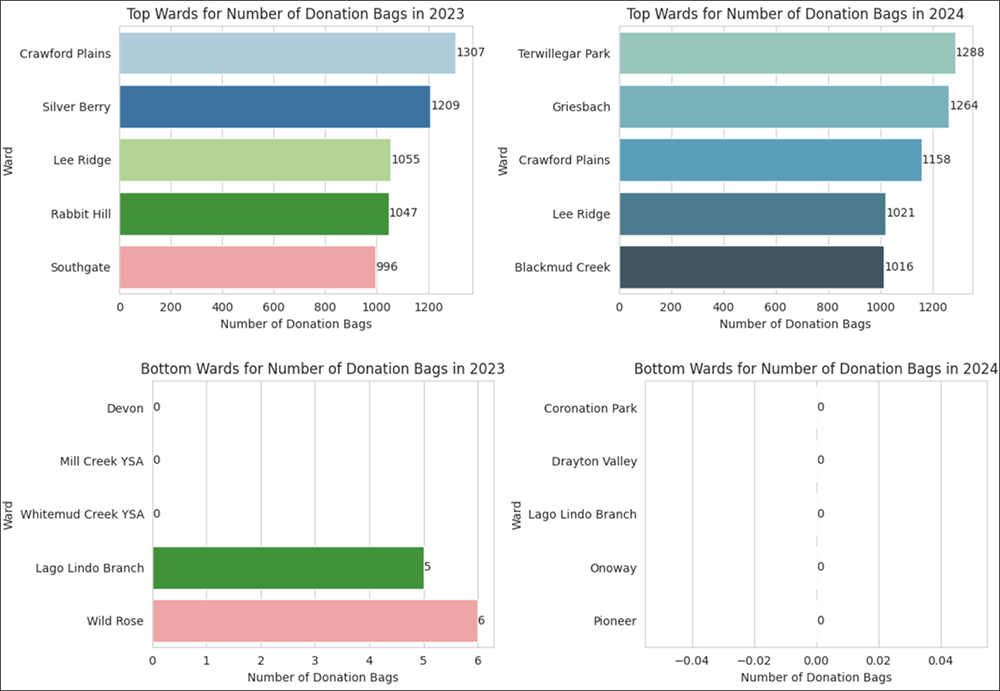
Figure 14: Top and Bottom Five Wards of 2023 and 2024
Description: This figure compares the top and bottom five Wards for the Edmonton Food Drive in 2023 and 2024, highlighting shifts in donation patterns and volunteer efforts across different areas. The analysis provides insights into which Wards saw the most significant improvements and where additional attention may be needed.In 2024, Crawford Plains stayed in the top 5, just like in 2023. Some new Wards, like Terwillegar Park and Griesbach, joined the top ranks. On the other hand, Wards like Coronation Park, Drayton Valley, and Pioneer moved into the bottom 5 in 2024, replacing last year's bottom Wards like Devon and Mill Creek YSA.
Predictive Modeling
Prediction of Total Donation Bags
We developed six machine learning models to predict the total number of donation bags for each ward for 2025. Key insights from the model evaluation are summarized below:
Best Model: Polynomial Regression emerged as the most effective model, achieving the lowest RMSE (7.0596) and MAE (2.3888), coupled with the highest R² score (0.9838). This indicates excellent accuracy and consistency in predicting donation volumes.
Key Observations: Polynomial Regression outperformed other models, such as Random Forest and Gradient Boosting, due to its ability to capture non-linear relationships in the data effectively.
Prediction of Time Spent
For predicting the time required to complete donation routes, six models were evaluated. The following insights were observed:
Best Model: Decision Tree Regression provided the most accurate predictions, achieving the lowest RMSE (0.4387) and MAE (0.3565), along with a high R² score (0.8877) and Adjusted R² (1.2152). This model effectively balanced simplicity and performance.
Key Observations: Decision Tree Regression outperformed Polynomial Regression and Gradient Boosting for this task due to its flexibility in handling variations in the data, such as route complexities and volunteer differences.
Additionally, a geospatial analysis was integrated to design digitized donation route maps, identifying areas with the highest potential for donations. This task aimed to streamline logistics and maximize resource allocation in future drives.
We performed hyperparameter tuning on the Decision Regression model for predicting time spent, but it did not result in significant improvements. The tuned model achieved a Mean Squared Error (MSE) of 0.2041, Root Mean Squared Error (RMSE) of 0.4517, Mean Absolute Error (MAE) of 0.3652, R-squared (R²) of 0.8810, and Adjusted R-squared of 1.2282.
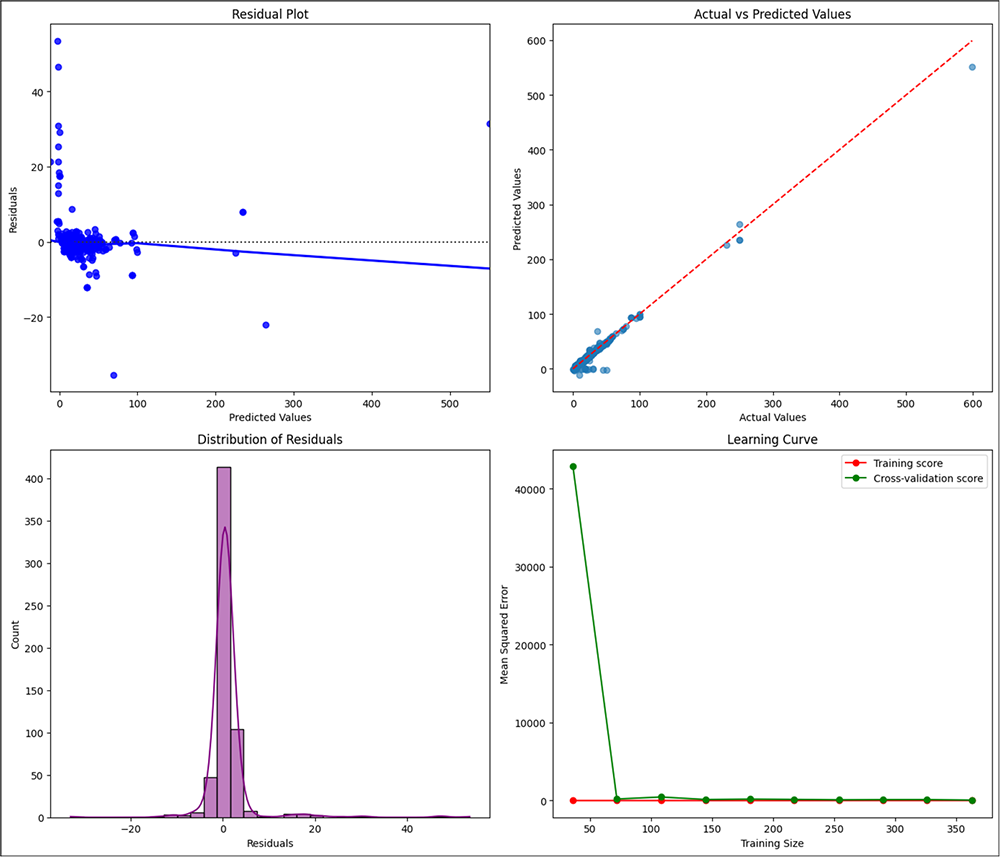
Figure 15: Visualizing the Behavior of Polynomial Regression
Description: This figure presents key visualizations from the machine learning model evaluation process used in predicting donation volumes for the Edmonton Food Drive. The graphs provide insights into the model's performance, residual behavior, and training progress. Residual Plot (Top Left): Depicts the residuals (differences between actual and predicted values) against predicted values; Actual vs. Predicted Values (Top Right): Compares the predicted donation volumes to the actual values. Most predictions align closely with the actual values along the diagonal line, indicating good model performance, except for a few outliers. Distribution of Residuals (Bottom Left): Shows the distribution of residuals to assess their normality. Learning Curve (Bottom Right): Displays the training and cross-validation scores as a function of training size. The rapid convergence of training and cross-validation scores with minimal error suggests the model is well-trained with low variance.These visualizations from the model evaluation highlight the model's strengths, such as its low error rates and high predictive performance for most predictions, while also identifying areas, like residual biases, that could be optimized for better results.
The models successfully predicted both donation volumes and time spent, enabling stakeholders to make informed decisions for future food drives.
Application Deployment
The application was deployed to provide stakeholders with an interactive, user-friendly platform for predicting donation outcomes and enhancing logistics. The best performing model was deployed on Hugging Face's Gradio and embedded in Tableau to aid decision-making for future food drives.
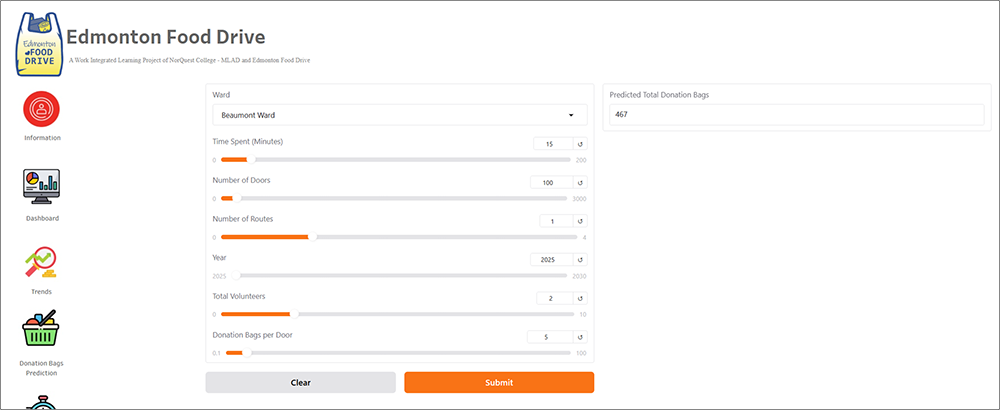
Figure 16: User Interface of the Donation Bags Prediction Module
Description: This figure represents the user interface of the Edmonton Food Drive application, an interactive tool designed to predict donation outcomes based on specific input parameters. The application provides an accessible platform for stakeholders to forecast donation volumes, enabling more efficient resource allocation and improved decision-making.Application Input Parameters for Prediction:
Ward: Selects the specific ward for which predictions are needed.
Time Spent (Minutes): Captures the estimated time volunteers spend completing routes.
Number of Doors: Inputs the total number of doors covered in the selected ward.
Number of Routes: Allows users to specify the number of routes included in the analysis.
Year: Enables predictions for future food drives, ranging from 2025 to 2030.
Total Volunteers: Specifies the number of volunteers assigned to the task.
The application uses the provided inputs to generate a Predicted Total Donation Bags value. This prediction helps stakeholders gauge the effectiveness of their planning and resource allocation for upcoming drives.
Challenges Faced:
The Edmonton Food Drive Project encountered several challenges that impacted data collection, analysis, and prediction accuracy. These challenges, though significant, provided valuable insights for improving future food drives.
Data Collection Limitations:
Due to resource constraints, data was collected only from select drop-off locations in Bearspaw, Londonderry, Riverbend, Gateway, and Bonnie Doon. This limited coverage resulted in incomplete datasets that did not fully represent all participating areas in Edmonton.
Multiple volunteers managing the same route and dropping off large numbers of donation bags led to incomplete or duplicate data entries, further complicating the accuracy of the collected data.
Inconsistencies in Dataset Structures:
The datasets for 2023 and 2024 contained discrepancies due to adaptations made in the new form to improve user entries. While these changes aimed to enhance usability, they introduced differences in feature structures, requiring significant effort to reconcile and standardize the data for analysis. Additionally, the absence of uniform data entry standards across Wards contributed to inconsistencies, creating additional challenges during preprocessing.
Prediction Discrepancies:
Predicted donation growth figures based on the collected data did not align with the client’s internal reports, which indicated an overall increase in donations in 2024 compared to 2023.
To address this discrepancy, data refilling was performed to adjust the 2024 figures and bring them closer to actual trends.
Operational Challenges:
The granularity of route information made it difficult to standardize data inputs across multiple Wards.
The lack of a centralized system for data entry led to variations in how data was recorded and submitted, further complicating the analysis.
Conclusions & Recommendations:
To enhance overall effectiveness, a more balanced allocation of volunteers should be considered, with a focus on both improving the performance of lower-performing areas and maintaining the momentum in top-performing wards and stakes. The following recommendations are proposed:
- Polynomial Regression is recommended for forecasting donation volumes, particularly when capturing complex patterns in historical data.
- Decision Tree Regression is ideal for predicting time spent, providing actionable insights for route optimization and volunteer allocation.
These predictions can guide planning and resource allocation by Identifying wards expected to generate the highest donation volumes and estimating the time required for volunteers to complete routes efficiently, improving logistical coordination.
Continued improvement in data collection processes (e.g., standardizing volunteer data and digitizing route information) will further enhance prediction accuracy and the utility of these models.
By combining data insights and predictive modeling, this project provides actionable recommendations for improving the logistics of Edmonton's Food Drive initiative.
The project successfully achieved its goals of recommending improvements in the food donation process in the Edmonton Food Drive. Tools to predict donation trends and time requirements were introduced, helping volunteers and organizers plan better. The route mapping application simplifies volunteer coordination and saves significant effort compared to the traditional manual processes. Additionally, interactive dashboards make it easier for stakeholders to understand and analyze the data, leading to better decision-making. Overall, the project streamlines operations and contributes to a more effective and efficient food donation drive.
References
Edmonton's Food Bank Fundraising Efforts. (n.d.). Edmonton Journal.
https://edmontonjournal.com/news/local-news/edmontons-food-bank-fundraising
Where to Build Food Banks: A Machine Learning Approach. (n.d.). Purdue University.
https://docs.lib.purdue.edu/cgi/viewcontent.cgi?article=1661&context=jpur
Edmonton’s Food Bank. (2024) Winter Gleanings 2024.
https://www.edmontonsfoodbank.com/documents/267/Winter_Gleanings_2024_-_Final.pdf
Food Bank Operations Web-Based Software. (n.d.). Gao Group, Cornell University.
https://gao.cee.cornell.edu/software-2/food-bank-operations-web-based-software/
Researchers Use Machine Learning to Assist State Food Pantries with Distribution. (2022). Auburn University Newsroom.
https://ocm.auburn.edu/newsroom/news_articles/2022/10/070927-researchers-machine-assists-food-pantries.php
Where to Build Food Banks and Pantries: A Two-Level Machine Learning Approach. (n.d.). arXiv.
https://arxiv.org/pdf/2410.15420
Automating Food Drop: The Power of Two Choices for Dynamic and Fair Food Allocation. (2024). arXiv. https://arxiv.org/abs/2406.06363
Edmonton Food Drive Dashboard. (2024). Tableau Public.
https://public.tableau.com/app/profile/kendrick.kent.moreno/viz/EFD2024Dashboard/EFDDashboard-Main
Government of Alberta. (n.d.). Property assessments: Edmonton region. Alberta Regional Dashboard. https://regionaldashboard.alberta.ca/region/edmonton/property-assessments/#/?from=2018&to=2022