
Extracting Public Value from Administrative Data: A method to enhance analysis with linked data
By: Sarry Zheng and Howard Swerdfeger, Canada School of Public Service
The daily lives of Canadians are increasingly shaped by data-driven technologies and services. By using these technologies and services, the Government of Canada can access data from multiple sources to better serve the needs of citizens and inform decision-making.
One of the places to enhance analysis is Statistics Canada's Linkable File Environment (LFE), which helps unlock insights from administrative data to information on businesses and individuals across Canada. It ensures all confidentiality and disclosure rules are respected before releasing aggregated and vetted data. This creates an opportunity to access more accurate information and conduct comprehensive analyses. It also reduces the survey and reporting burden on departments and private industries.
What is linked data?
Linked data is the process in which records from different data sources are joined together into a single file using identifiers, such as names, date of birth, addresses, and other characteristics. It is also known as record linkage, data matching, and entity resolution, to name a few. The initial idea of linked data goes back to the 1950s. This technique is used in a wide range of fields such as data warehousing, business intelligence, and medical research.
Types of Linkage
There are two types of linkage – exact matching and statistical matching.
- Statistical matching creates a file to reflect the underlying population distribution. Records that are combined do not necessarily correspond to the same entity, such as a person or a business. It is assumed that the relationship of the variables in the population will be like the relationship on the file. This method is commonly used in market research.
- Exact matching links information about a particular record in one file to information in another file to create a single file with the correct information for each record. They can be divided into two subtypes – deterministic record linkage and probabilistic record linkage.Footnote 1
- Deterministic record linkage – link records based on common identifiers between data sources
- Probabilistic record linkage – link records where not all columns from the records are identical, based on a probability that the records match.
Probabilistic Record Linkage
When a dataset doesn't contain a unique identifier, is incomplete, or contains errors, probabilistic record linkage is a method that can be used to link data files and build a set of potential pairs. As in Figure 1, we can see that the first records are identical while the second and third records are a match, but not identical. The goal of any probabilistic record linking algorithm is to replicate a human's ability to see that these entities are the same with high confidence.
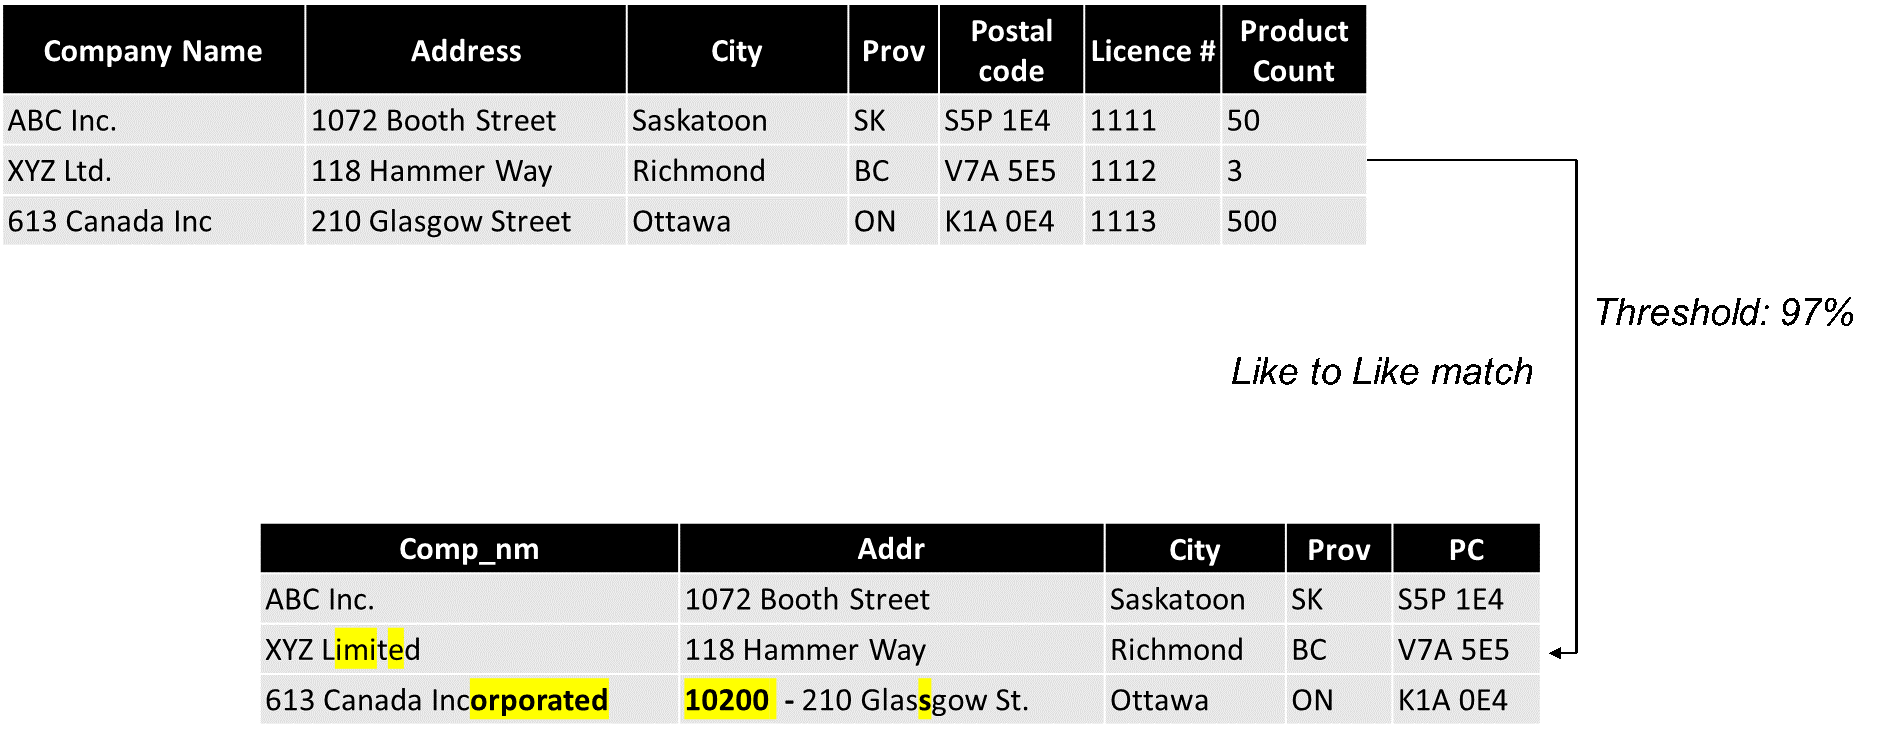
Description - Figure 1: Sample datasets to be joined for probabilistic matching
| Company Name | Address | City | Prov | Postal Code | Licence # | Product Count |
|---|---|---|---|---|---|---|
| ABC Inc. | 1072 Booth Street | Saskatoon | SK | S5P 1E4 | 1111 | 50 |
| XYZ Ltd. | 118 Hammer Way | Richmond | BC | V7A 5E5 | 1112 | 3 |
| 613 Canada Inc. | 210 Glasgow Street | Ottawa | ON | K1A 0E4 | 1113 | 500 |
Like to Like match, Threshold 97%
| Comp_nm | Addr | City | Prov | PC |
|---|---|---|---|---|
| ABC Inc. | 1072 Booth Street | Saskatoon | SK | S5P 1E4 |
| XYZ Limited | 118 Hammer Way | Richmond | BC | V7A 5E5 |
| 613 Canada Incorporated | 10200 - 210 Glassgow Street | Ottawa | ON | K1A 0E4 |
Standard Practices
One of the tools Statistics Canada uses is SAS software called G-Link to perform probabilistic record linkages. G-Link represents a direct implementation of the Fellegi-Sunter record linkage algorithm, packaged in a Windows-based application.
As computational power continues to grow, allowing larger datasets to be linked in a shorter period and accessible on desktop computers, the development of new theoretical models and refinements of existing methodologies and software are becoming more prevalent. For instance, the record linkage toolkit in Python, and reclin in R are two easy-to-use examples that integrate well with the Fellegi-Sunter method of record linkage using open-source software.
Fellegi-Sunter
Since its publication, Fellegi-Sunter (1969)Footnote 2 has become the de facto approach for probabilistic record linkage. This model estimates match weights for each individual column and combines these match weights into an overall match probability. By assuming variables must be independent given the match status, it can be combined with Bayes Theorem and quantified using two key parameters for each column – the and probabilities, where:
- is the probability that a given column does not match but the records are the same.
- is the probability that a given column is the same, but the records are not.
Bayes Theorem is
Where:
- is the probability of a record match
- is the probability of some data element matching
Expanding the denominator,
Where:
- is the probability that two records don't match or
Since we have multiple columns or multiple lines of evidence, one could use , and for the and probabilities of the th column.

Dr. Yvan P. Fellegi served as Statistics Canada's Chief Statistician from 1985 to 2008. In this role, he introduced new methods for collecting and compiling national statistics. In 1992, Fellegi became a member of the Order of Canada and upon his retirement in June 2008, the Canadian government appointed him Chief Statistician Emeritus.
String comparisons
Fellegi-Sunter has at least one disadvantage that is typically fixed in practical applications. In practice, for many columns the m and u probabilities are often not based on the probability that two columns are identical, but rather some appropriate distance function is used to measure the similarity between two columns and then calculate the threshold. The m and u probabilities would then be based on these thresholds.
For strings, several common distance functions exist - each one may be useful for the combination of data and expected differences (misspellings) in your dataset. Some of these are briefly summarized below:
| Distance Functions | Company Name | Comp_nm |
|---|---|---|
| Jaro-Winkler | homers odyssey Incorporated | homers odyssey Incorporation |
| Longest Common Substring | Rumpelstiltskin Incorporated | The Rumpelstiltskin Incorporation |
| Levenshtein distance | Quasimodo and Esmeralda Inc. | Quazimodo and Ezmeralda Inc. |
| Cosine | William "Bill" S. Preston and Ted "Theodore" Logan enterprises | Ted "Theodore" Logan and William "Bill" S. Preston enterprises |
| Token Link | Legal Eagle attorney at law | Legal Eagle (2017) attorney |
Token Link
While Fellegi-Sunter in combination with traditional string distance metrics is highly useful, it has several possible deficiencies:
- For columns that have categorical levels and are not evenly distributed, only the average match rate is considered for the u parameter. Consider matching the city column with the value "Williamstown", it carries much more information than matching the "Toronto" value.
- Most string distance algorithms work on the character level. They assume that semantic distances are some functions of the characters composing a string, while in both English and French, the information conveyed to the readers is at the word level.
The Token Link algorithm and R package fix the above issues. It can help with the identification of records where multiple categorical levels are present. It can also identify where columns exist with multiple words in the same column such as company name or address.
The basic algorithm involves:
- Tokenize the words in the column, count the occurrences of each token in the dataset.
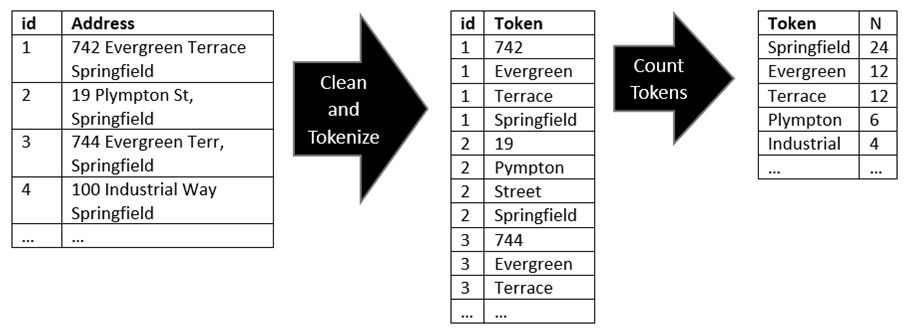
Description - Figure 2: Tokenized words in each column
Tokenized words in each column - Original sample dataset id Address 1 742 Evergreen Terrace Springfield 2 19 Plympton St, Springfield 3 744 Evergreen Terr, Springfield 4 100 Industrial Way Springfield … … Clean and Tokenize
Tokenized words in each column - Sample dataset with counted tokens id
Token
1
742
1
Evergreen
1
Terrace
1
Springfield
2
19
2
Pympton
2
Street
2
Springfield
3
744
3
Evergreen
3
Terrace
…
…
Count Tokens
Tokenized words in each column - Sample dataset with counted tokens Token
N
Springfield
24
Evergreen
12
Terrace
12
Plympton
6
Industrial
4
…
…
- Repeat tokenization and counting procedure for alternate dataset
- Create a full outer join on the tokens of the two-word counts
Sample dataset 4 Token N_a N_b U_prob Springfield 24 7500 3.7% Evergreen 12 2 0.0005% Terrace 12 500 0.12% Plympton 6 1 0.00013% Industrial 4 8 0.00067% - Use this to estimate the probability for each token. Where and are the number of occurrences of the token t in dataset a or b, and and are the number of records in dataset a and b.
- Estimate the m probability either as a whole or independently for each token.
- Join the merged token count file with the original two datasets, calculating the probability that any two records are the same given that they have a token in common.
The technique outlined here can be extended to multiple columns without much difficulty. It can also be integrated with traditional record matching algorithms by using their posterior output as the prior.
Some of the limitations to the Token Link technique:
- Like all methods related to the Fellegi-Sunter algorithm, it assumes the independence of each piece of information. Token link assumes the independence of words. For example, "research and development" commonly occur together and should not be treated as independent, but this algorithm would treat these words as independent and distinctive units.
- This algorithm does not consider word order. So "Bill and Ted" would be seen as identical to "Ted and Bill".
- It has a difficult time finding matches if a simple misspelling occurred in an important identifying word. For instance, the pair "Starbucks coffee" and "Starbacks Coffee" records might be harder for this algorithm to find while "Starbucks coffee" and "Starbucks Caffee" would be easier to find.
To learn more about this technique, more information can be found at TokenLink on GitHub.
How to get started
Statistics Canada's LFE offers support to users and partners for their research and reporting on a cost recovery basis. For more information on this service, connect with the LFE team.
Departments wanting to extract value using linked data about their regulated parties should keep three things in mind.
Unique Identifiers
Consider collecting unique identifiers such as business number from your regulated parties. While it is possible to link data without unique identifiers through attributes like company name or address, these can lead to errors in the linking process. The error rate is often linked to the data quality and the data collection mechanism.
Summary Statistics
Consider which summary metric to request. If there is a chance of error in the linking process, some summary metrics are more robust than others to outliers. Consider requesting the median and interquartile range as measures of central tendency and variation rather than the arithmetic means and standard deviation as the former is more robust to outliers than the latter.
Granularity and Data Size
Consider the potential for data suppression. If a department requests the data be summarized at a very granular level and they do not have a large number of regulated parties, cells in a summary table could be suppressed to protect the privacy of the entities and comply with the Statistics Act. In general, the larger the datasets, the finer the aggregation of the data can be.
Acknowledgments
Entrepreneurship and Linkable File Environment team at Statistics Canada; Zhuo (Sarah) Zhang, Robert Dorling, Department of Fisheries and Oceans Canada

If you have any questions about my article or would like to discuss this further, I invite you to Meet the Data Scientist, an event where authors meet the readers, present their topic and discuss their findings.
Thursday, November 17
2:00 to 3:00 p.m. EST
MS Teams – link will be provided to the registrants by email
Register for the Data Science Network's Meet the Data Scientist Presentation. We hope to see you there!
- Date modified: