
Context modelling with transformers: Food recognition
By: Mohammadreza Dorkhah, Sayema Mashhadi and Shannon Lo, Statistics Canada
Introduction
Our team of researchers from Statistic Canada's Data Science Division and Centre for Population Health Data (CPHD) conducted a proof-of-concept project that identifies foods within images and explores an alternative way of collecting nutrition data.
Given that this project was the first of its kind at Statistics Canada, the teams involved in creating this proof-of-concept were required to work exclusively with publicly available food image datasets. As a result, we curated a final dataset with images and labels that matched food and drinks consumed by Canadians based off three other datasets. This resulting dataset was used to develop a deep learning model for food recognition that can predict 187 different types of food or beverage categories and identify multiple products within a single image.
The food recognition deep learning model uses a state-of-the-art vision transformer as an encoder, called a segmentation transformer (SETR), and a multimodal image-text model for context modelling called the Recipe Learning Module (ReLeM). As part of this project, the CPHD team members tested and manually verified the SETR and ReLeM models' performance which we will explain later in this article.
Datasets
The three public datasets that we used to develop our final dataset suited our goal of ingredient level semantic segmentation for food images. However, given that each dataset has a different set of food categories, we had to manually map them to categories derived from a nutrition guide (Nutrient Value of Some Common Foods). Figures 1, 2 and 3 show sample images and their labels for each of the three datasets. The labels are image segmentation masks used to annotate every pixel and distinguish between items such as water, bread, and other foods.
FoodSeg103
- 7,118 images (4,983 training, 2,135 validations)
- 102 food categories
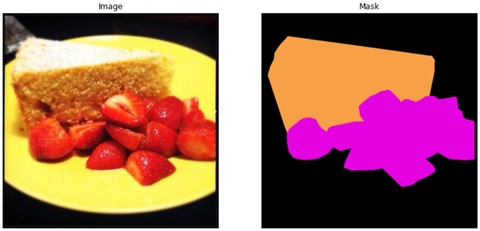
Figure 1: Sample image and output from the FoodSeg103 dataset.
An image of cake and sliced strawberries on the left. The output on the right depicts the shape of the cake and strawberries with their own colours.
| Colour | Colour Name | Original Category | Nutrition Guide |
|---|---|---|---|
| The table cell background is coloured "Light Salmon" | Light Salmon | Cake | Cake |
| The table cell background is coloured "Magenta" | Magenta | Strawberry | Strawberry |
UECFoodPIX
- 10,000 images (9,000 training, 1,000 validations)
- 102 food categories
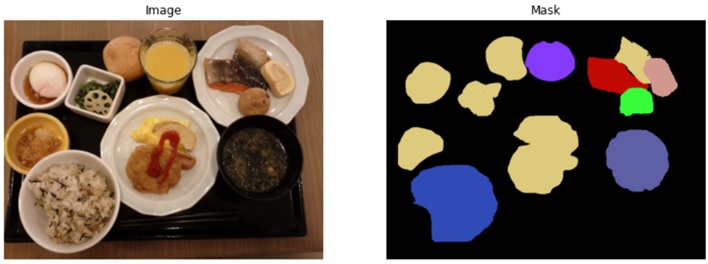
Figure 2: Sample image and output from the UECFoodPIX dataset.
A food image consisting of salmon, omelets, rice, soup and other foods on the left. The output image on the right are shapes of the food images in their corresponding colours.
| Colour | Colour Name | Original Category | Nutrition Guide |
|---|---|---|---|
| The table cell background is coloured "Lime" | Lime | Others | Other |
| The table cell background is coloured "Royal Blue" | Royal Blue | Mixed rice | Grains, rice |
| The table cell background is coloured "Slate Blue" | Slate Blue | Miso soup | Soup |
| The table cell background is coloured "Medium Slate Blue" | Medium Slate Blue | Beverage | Drink |
| The table cell background is coloured "Fire Brick" | Fire Brick | Grilled salmon | Fish |
| The table cell background is coloured "Tan (Burly Wood)" | Tan (Burly Wood) | Rolled omelet | Egg |
| The table cell background is coloured "Lime" | Lime | Ganmodoki | Other |
As shown in the table above, some of the original categories are mapped to different categories within the nutrition guide. Items with no matching category are mapped to "Other".
MyFoodRepo
- 58,157 images (54,392 training, 946 validations, 2,819 testing)
- 323 food categories
- We used refinement techniques to handle the coarse masks problem.
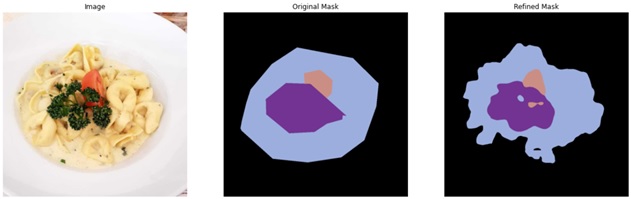
Figure 3: Sample images from the MyFoodRepo dataset.
A food image consisting of pasta with a cream sauce, garnished with parsley and tomato on the left. Two output images on the right are shapes of the food images in their corresponding colours, one with the original mask and one with a refined mask.
| Colour | Colour Name | Original Category | Nutrition Guide |
|---|---|---|---|
| The table cell background is coloured "Light Steel Blue" | Light Steel Blue | Sauce cream | Sauce |
| The table cell background is coloured "Purple" | Purple | Parsley | Parsley |
| The table cell background is coloured "Dark Salmon" | Dark Salmon | Tomato | Tomato |
There are some overlapping categories in each labelled dataset which were combined as one in our final dataset. After dropping a few labels due to insufficient image samples, and by combining others to make coherent groupings of similar food types, a total of 187 different types of food and drinks were finalized.
Image segmentation
Image segmentation forms the basis of many downstream computer vision tasks such as object detection and image classification. Image segmentation is a method of dividing an image into subgroups. This division is usually done based on visible boundaries or edges of objects in an image and helps to reduce complexities. Segmentation can also mean label assignment to each pixel in the image to identify important elements. It has many applications in the field of autonomous vehicles, medical image analysis, satellite image analysis, video surveillance and other recognition and detection tasks. Image segmentation is also used in medical imaging, as covered in a recent DSN article, Image Segmentation in Medical Imaging. Neural network-based image segmentation models almost always contain an encoder and decoder. The encoder is for feature representation learning and the decoder is for pixel-wise classification of the feature representations.
Three major types of image segmentation techniques are commonly used on the field of computer vision:
- Semantic segmentation: Associates every pixel of an image with a class label such as car, tree, fruit, person, etc. It treats multiple objects of the same class as a single entity.
- Instance segmentation: Does not associate every pixel of an image with a class label. It treats multiple objects of the same class as distinct individual instances, without necessarily recognizing individual instances. For example, car 1 and car 2 are identified with different colours in an image.
- Panoptic segmentation: Combines concepts of both semantic and instance segmentation and assigns two labels to each pixel of an image–semantic label and instance ID.
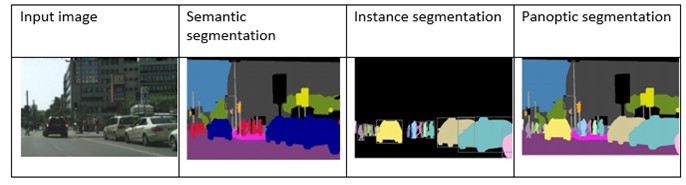
Figure 4: An example of semantic segmentation, instance segmentation and panoptic segmentation from a single input image.
Four images depicting an input image and three types of segmentation used on the image—semantic segmentation, instance segmentation, and panoptic segmentation.
Food image segmentation pipeline
Semantic segmentation models were deemed appropriate for our food recognition model. This is mainly due to its ability to recognize the food or drink type, as this was the primary goal of the exercise. The fully convolutional network (FCN) has been a popular choice for semantic segmentation, however, the encoder models based on the FCN down-sample spatial resolution of the input leads to developing lower resolution feature mappings. In the paper Rethinking Semantic Segmentation from a Sequence-to-Sequence Perspective with Transformers, the authors proposed a new segmentation model based on pure transformer architecture termed, SEgmentation TRansformer (SETR). A SETR encoder treats an input image as a sequence of image patches represented by learned patch embedding and transforms the sequence with global self-attention modeling for discriminative feature representation learning. This model further provided more context for the food recognition task using the ReLeM as proposed by the authors in A Large-Scale Benchmark for Food Image Segmentation. Both SETR and ReLeM are further explained below.
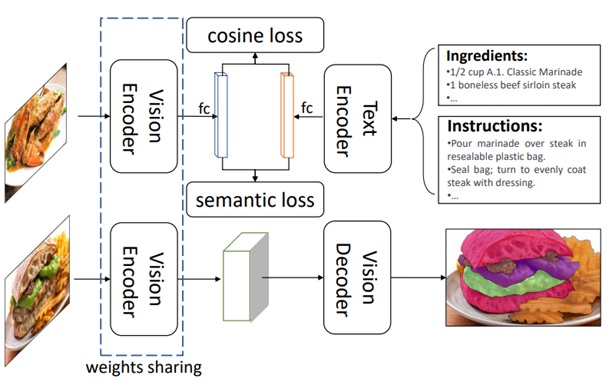
Figure 5: Food image segmentation pipeline diagram. Sourced from A Large-Scale Benchmark for Food Image Segmentation.
Text in image: Vision encoder, fc cosine loss/semantic loss tc, Text Encoder, Ingredients: ½, cup A1 Classic Marinade, 1 boneless beef sirloin steak. Instructions: Pour marinade over steak in resealable plastic bag. Seal bag: turn to evenly coat steak with dressing. Vision encoder (weights sharing), Vision decoder
Recipe Learning Module
The ReLeM provides models with contextual information of the ingredients from food recipes. In the paper, A Large-Scale Benchmark for Food Image Segmentation, the authors describe the ReLeM as a "multi-modality pre-training approach... that explicitly equips a segmentation model with rich and semantic food knowledge".
The module was trained using a Recipe1M dataset (see: Learning Cross-Modal Embeddings for Cooking Recipes and Food Images). This dataset contains over one million recipes and 800,000 food images. Through exposure to recipes and food images, ReLeM forms associations between ingredients, similar to the way humans understand what foods are typically found together.
When training a model for food image classification, it's important to use recipes as training data. This allows the module to create associations between ingredients that may vary visually when prepared differently. ReLeM also learns from the food preparation instructions in the recipe. For example, pureed eggplant differs visually from fried eggplant. On the other hand, there may be different ingredients that look similar, such as milk and yogurt. ReLeM has established associations between ingredients and which foods commonly appear together, which is beneficial in these scenarios. For example, if the image contains a glass with a white substance and a plate of chocolate chip cookies, ReLeM could infer that the white substance is more likely milk as opposed to yogurt since there is a known association between milk and cookies. ReLeM uses cosine and semantic loss to determine the similarity between food items.
Segmentation transformer model
Transformers and self-attention models have improved natural language understanding and processing (NLU/NLP) performance. Widely popular GPT-3 (generative pre-trained transformer 3) and BERT (bidirectional encoder representations from transformer) models in NLP domain are based on Transformer architecture. The same architecture can be used for images, but this sequence-to-sequence learning expects 1D sequences at input. The state-of-the-art SETR encoder model pre-processes 2D images before feeding it to the Transformer architecture. The 2D image is decomposed to smaller fixed-size patches and then each patch is converted to a 1D sequence. This sequence of image patches is represented by learned patch embedding discussed in the paper we mentioned above about semantic segmentation. Once this sequence of feature embedding vectors are provided at input, the transformer learns discriminative feature representation which are returned at the output of the SETR encoder. The encoder model is more complex than the decoder model since it needs to learn and produce intricate feature representation for discriminating each class accurately.
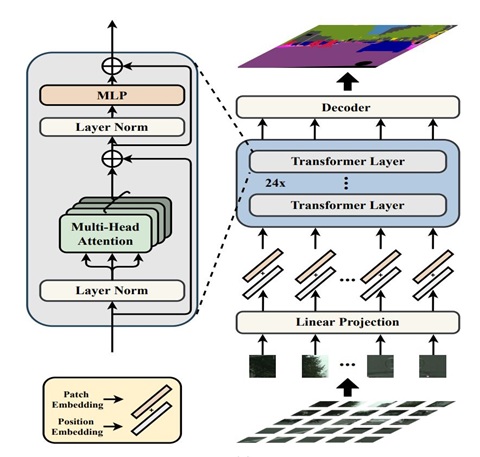
Figure 6: SETR encoder sourced from Rethinking Semantic Segmentation from a Sequence-to-Sequence Perspective with Transformers.
The diagram illustrates the design of the Segmentation Transformer (SETR).
Text in image: Patch Embedding and Position Embedding, Layer Norm, Multi-Head Attention, Layer Norm, MLP (multi-layer perceptron). Linear Projection, 24x, Transformer Layer, Decoder
A decoder is then used to recover the original image resolution with pixel-level classification. In our case, we used the multi-level feature aggregation (MLA) decoder. The MLA decoder accepts feature representations from every SETR layer. All these feature representations share the same resolution (no loss of resolution like with FCN) and go through a series of reshaping and up-sampling to get the pixel labels.
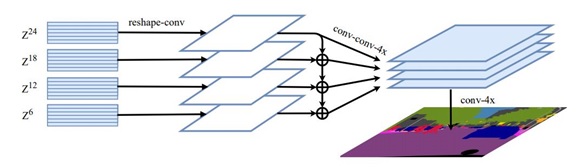
Figure 7: MLA decoder sourced from Rethinking Semantic Segmentation from a Sequence-to-Sequence Perspective with Transformers.
The diagram depicts multi-level feature aggregation. Specifically, a variant called SETR-MLA.
Text in image: Z24, Z18, Z12, Z6, reshape-conv, conv-conv-4x, conv-4x
Results
Here are the validation results based on the mean intersection over union (mIoU), mean accuracy (mAcc) and overall accuracy (aAcc) metrics:
| Metric | Value |
|---|---|
| mIoU | 40.74 % |
| mAcc | 51.98 % |
| aAcc | 83.21 % |
Testing results based on the precision, recall and F1-Score metrics:
| Metric | Value |
|---|---|
| Precision | 81.43 % |
| Recall | 80.16 % |
| F1-Score | 80.79 % |
Without initializing the vision encoder by ReLeM trained weights:
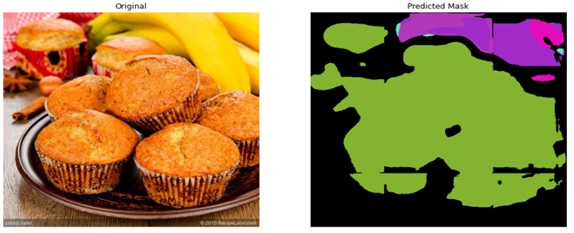
Figure 8: Example of a predicted mask without initializing the vision encoder by ReLeM trained weights.
Image of muffins on the left and an example of predicted masks on the right without initializing the vision encoder by ReLeM trained weights.
| Colour | Colour Name | Predicted Category |
|---|---|---|
| The table cell background is coloured "Yellow Green" | Yellow Green | Bread, whole grain (whole wheat) |
| The table cell background is coloured "Turquoise" | Turquoise | Tea |
| The table cell background is coloured "Orchid" | Orchid | Apple |
| The table cell background is coloured "Medium Orchid" | Medium Orchid | Sweet potato |
| The table cell background is coloured "Magenta" | Magenta | Dumpling |
With initializing the vision encoder by ReLeM trained weights:
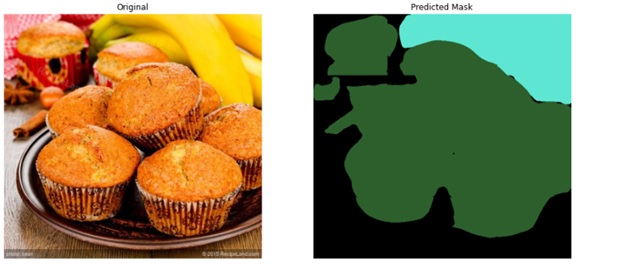
Figure 9: Example of a predicted mask with initializing the vision encoder by ReLeM trained weights.
Image of muffins on the left and an example of predicted masks on the right with initializing the vision encoder by ReLeM trained weights.
| Colour | Colour Name | Predicted Category |
|---|---|---|
| The table cell background is coloured "Turquoise" | Turquoise | Cake |
| The table cell background is coloured "Dark Green" | Dark Green | Banana |
Conclusion
The food recognition model accurately predicts many foods and drinks in an image in just less than a second and does consistently well with certain categories like bread but struggles with categories that are visually similar such as beef and lamb. The performance can be improved by adding more labelled data for minority categories, another round of re-categorization of visually similar foods, and using techniques to combat class imbalance.
Meet the Data Scientist

If you have any questions about my article or would like to discuss this further, I invite you to Meet the Data Scientist, an event where authors meet the readers, present their topic and discuss their findings.
Tuesday, January 17
2:00 to 3:00 p.m. ET
MS Teams – link will be provided to the registrants by email
Register for the Data Science Network's Meet the Data Scientist Presentation. We hope to see you there!
Subscribe to the Data Science Network for the Federal Public Service newsletter to keep up with the latest data science news.
- Date modified: