
Indigenous Communities Food Receipts Crowdsourcing with Optical Character Recognition
By: Shannon Lo, Joanne Yoon, Kimberley Flak, Statistics Canada
Everyone deserves access to healthy and affordable food, no matter where they live. However, many Canadians living in northern and isolated communities face increased costs related to shipping rates and supply chain challenges. In response to food security concerns in the North, the Government of Canada established the Nutrition North Canada (NNC) subsidy program. Administered by Crown-Indigenous Relations and Northern Affairs Canada (CIRNAC), this program helps make nutritious foods like meat, milk, cereals, fruit, and vegetables more affordable and accessible. To better understand the challenges impacting food security, improved price data is needed.
On behalf of CIRNAC, and in collaboration with the Centre for Special Business Projects (CSBP), Statistics Canada’s Data Science Division conducted a proof-of-concept project to investigate crowdsourcing as a potential solution to the data gap. This project evaluated the feasibility of using optical character recognition (OCR) and natural language processing (NLP) to extract and tabulate pricing information from images of grocery receipts as well as developing a web application for uploading and processing receipt images. This article focuses on the text identification and extraction algorithm, while the web application component is not covered.
Data
The input data for the project consisted of images of grocery receipts from purchases made in isolated Indigenous regions, including photos taken with a camera and scanned images. The layout and content of the receipts varied across retailers. From these receipts, we aimed to extract both product-level pricing information as well as receipt-level information, such as the date and location of purchase, which provide important context for downstream analysis. The extracted data were compiled into a database to support validation, analysis, and search functions.
High level design
Figure 1 illustrates the data flow, from receipt submission to digitization, storage, and display. This article focuses on the digitization process.
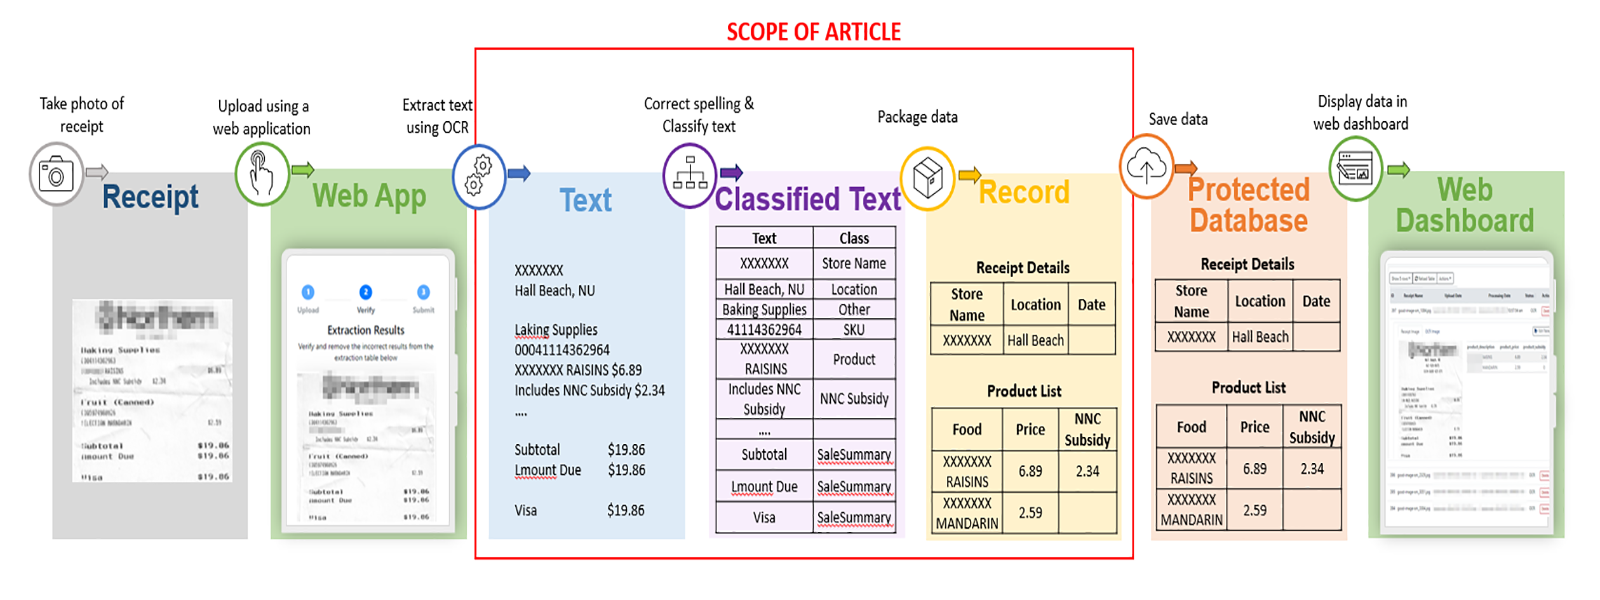
Figure 1: Data flow
This is a process diagram depicting the flow of data between the various processes in the project. It highlights the three digitalization processes that this article will focus on: Extract text using OCR, Correct spelling & Classify text, and Package data.
- Receipt: Take photo of receipt
- Forward to Web App: Upload using a web application
- Web App: Upload using a web application
- Forward to Text: Extract text using OCR
- Text: Extract text using OCR
- Forward to Classified Text: Correct spelling & Classify text
- Classified Text: Correct spelling & Classify text
- Forward to Record: Package data
- Record: Package data
- Forward to Protected Database: Save data
- Protected Database: Save data
- Forward to Web Dashboard: Display data in web dashboard
- Web Dashboard: Display data in web dashboard
Text extraction using OCR
We extracted text from receipts by first detecting text regions using Character-Region Awareness For Text detection (CRAFT) and then recognizing characters using Google's OCR engine, Tesseract. CRAFT was chosen over other text detection models because it effectively detected text even in blurred, low-resolution areas or those with missing ink spots. For more information on CRAFT and Tesseract, refer to the Data Science Network’s article, Comparing Optical Character Recognition Tools for Text-Dense Documents vs. Scene Text .
Tesseract recognized text from detected text boxes. Generally, Tesseract looked for English and French alphabets, digits and punctuation. However, for text boxes that started on the far right (i.e., those with a left x coordinate at least three-quarters of the way toward the maximum x coordinate in the current block), Tesseract only looked for digits, punctuation, and certain single characters used to indicate product tax type, assuming the text box contained price information. By limiting the characters to recognize, we prevented cases such as a zero from being recognized as the character “O.”
If Tesseract did not recognize any text in the text box or if the confidence of the recognition was less than 50%, we first tried cleaning the image. Texts with uneven darkness or missing ink areas were patched using Contrast Limited Adaptive Histogram Equalization (CLAHE). This method improved an image’s overall contrast by calculating the histogram of pixel intensities and distributing these pixels into buckets with fewer pixels. The image’s brightness and contrast were adjusted to make the black text stand out more. These cleaning methods allowed Tesseract to better recognize the text. However, applying this image preprocessing method to all text boxes was not recommended because it hindered Tesseract in some images taken under different conditions. Text recognition after this image preprocessing method was only used when the text recognition probability increased. When Tesseract failed even after image preprocessing, the program used EasyOCR’s Scene Text Recognition (STR) model instead. This alternative text recognition model performed better on noisier images where the text was printed with spotty amounts of ink or where the image was blurry.
Spell check
SymSpell was trained using individual product names from the 2019 Survey of Household Spending (SHS) database. To improve the quality of the correction, the spell corrector selected the most common word based on nearby word information. For example, if the recognized line was “suo dried tomatoes,” the spelling corrector could correct the first word to “sub,” “sun,” and “sum,” but it would choose “sun” since it recognizes the bigram “sun dried,” but not “sub dried.” On the other hand, if the OCR predicted the line to be “sub dried tomatoes,” no words were corrected since each word was a valid entry in the database. We aimed to avoid false corrections as much as possible. If a character was not detected due to vertical lines of no ink, the missing character was also recovered using spell correction. For example, if the recognized line was “sun dri d tomatoes,” the spelling corrector corrected the line to “sun dried tomatoes.”
A separate spell checker corrected the spelling of store names and community names.
Text classification
To identify what each line of extracted text was describing, a receipt-level and a product-level entity classifier was built. The following sections describe the relevant entities, sources of training data, explored models, and their performances.
Entities
Each extracted row of text was classified into one of the 11 groups shown in Table 1. This step enables sensitive information to be redacted, and the remainder of the information to be used meaningfully.
| Receipt-level entities | Price (% correct) |
NNC Subsidy (% correct) |
|---|---|---|
|
Date Store name Store location Sale summary |
Product Price per quantity Subsidy Discount Deposit |
Sensitive information (includes customer’s address, phone number, and name) Other |
Entity classifier training data
Training data was gathered from labelled receipts, the SHS database, as well as public sources such as data available on GitHub. Refer to Table 2 for details about each training data source.
|
Data |
Records |
Source |
Additional Details |
|---|---|---|---|
| Labelled receipts | 1,803 | CIRNAC | Used OCR to extract information from receipt images which were then labelled by analysts. |
| Products | 76,392 | SHS database | 2 or more occurrences. |
| Store names | 8,804 | SHS database | 2 or more occurrences. |
| Canadian cities | 3,427 | GitHub | |
| Canadian provinces | 26 | GitHub | Full names and the abbreviated forms of 13 provinces and territories. |
| Communities | 131 | Nutrition North Canada | Communities eligible for the NNC program. |
| Last Names | 87,960 | GitHub | This is categorized as sensitive information. |
Model selection and hyperparameter tuning
Two multiclass classifiers were used, one to classify receipt-level entities (i.e., store name and location) and the other to classify product-level entities (i.e., product description, subsidy, price per quantity, discount, and deposit). Table 3 describes the various models used in the experiment to classify receipt-level and product-level entities. The corresponding F1 macro scores for the two different classifiers are also displayed.
| Experimented Models | Description | Receipts Classifier F1 Macro Score | Products Classifier F1 Macro Score |
|---|---|---|---|
| Multinomial Naïve Bayes (MNB) | The multinomial Naive Bayes classifier is suitable for classification with discrete features (e.g., word counts for text classification). [1] | 0.602 | 0.188 |
| Linear Support Vector Machine with SGD training | This estimator implements regularized linear models (SVM, logistic regression, etc.) with stochastic gradient descent (SGD) learning: the gradient of the loss is estimated each sample at a time and the model is updated along the way with a decreasing strength schedule (aka learning rate). [2] | 0.828 | 0.899 |
| Linear Support Vector Classification | Similar to SVC with parameter kernel=’linear’, but implemented in terms of liblinear rather than libsvm, so it has more flexibility in the choice of penalties and loss functions and should scale better to large numbers of samples. This class supports both dense and sparse input and the multiclass support is handled according to a one-vs-the-rest scheme. [3] | 0.834 | 0.900 |
| Decision Tree | Decision Trees (DTs) are a non-parametric supervised learning method used for classification and regression. [4] | 0.634 | 0.398 |
| Random Forest | A random forest is a meta estimator that fits a number of decision tree classifiers on various sub-samples of the dataset and uses averaging to improve the predictive accuracy and control over-fitting. [5] | 0.269 | 0.206 |
| XGBoost | XGBoost is an optimized distributed gradient boosting library designed to be highly efficient, flexible and portable. It implements machine learning algorithms under the Gradient Boosting framework. [6] | 0.812 | 0.841 |
Before selecting the best models, hyperparameter tuning was conducted using grid search. Stratified K-Folds cross-validation was then used to train and test the models, addressing challenges with class imbalance in the training dataset which was mostly comprised of sensitive information (49%) and product names and/or prices (44%). The remaining 7% of the dataset included information such as store name, location, subsidy, discount, date, and price per quantity. After testing and training, the best performing models for receipt-level and product-level entities were selected based on the F1 macro score. The F1 macro score was used as a determinant of performance because it weighs the importance of each class equally, meaning even if a class has very few examples in the training data, the quality of predictions for that class is just as important as a class that has many examples. This is often the case in a project where the training dataset is imbalanced where some classes have few examples while other have many examples.
A rule-based approach was used to identify dates because the standard formats for dates make this a more robust method.
The Linear Support Vector Classification (SVC) classifier was chosen as the best model for both the receipt and product classifiers based on its F1 macro score of 0.834 (receipts) and 0.900 (products), which was higher than all the other models that were tested. Despite being the top performing model, it is worth noting that SVC classifiers generally take more time to train compared to MNB classifiers.
Packaging OCR’d text to a receipt record
The trained receipt-level and product-level entity classifiers were used on different parts of the receipt. Assuming the receipt was laid out as seen in figure 2, the receipt-level entity classifier predicted the class of all extracted receipt lines except for section 3: Products, and the product-level entity classifier was only used on section 3: Products. This layout worked for all receipts in our dataset. If a component, such as store names, was cropped out of the photo, that field was left empty in the final output.

Figure 2: Receipt component layout
This is an image of a receipt which shows an example of the different sections on a receipt.
- Store name and address
- Transaction record
- Products (description, SKU, price, discount, subsidy and price per quantity)
- Subtotal, taxes and total
- Transaction record
The beginning of the receipt, including 1) Store name and address and 2) Transaction record, consisted of text lines found before the line that the products classifier predicted to be a product and that had a dollar value. No store name and location were returned if this part was empty, and if the first line directly described a product. Of all text recognized in this section, the text the receipt classifier predicted as the store name with the highest prediction probability was assigned as the store name. A valid community name was extracted from lines predicted as a location. Lines that the receipt classifier predicted to be sensitive information in this section were redacted.
The main body of a receipt included 3) Products list. Each line that the products classifier predicted as a Product and had a dollar value considered as a new product. Any lines of text following this product that were predicted to be a subsidy, discount, deposit, or price per quantity were added as auxiliary information for the product. Subsidies were further broken down into Nutrition North Canada (NNC) subsidy and Nunavik cost of living subsidy depending on its text description.
The end of the receipt included 4) Subtotal, taxes and total and 5) Transaction record. Nothing needed to be extracted from these two sections but lines that the receipt classifier predicted to be sensitive information in this section were redacted.
The date of purchase appeared either at the beginning or the end of the receipt. Dates were thus parsed by searching for known date format regular expression patterns in those sections of the receipt.
Results
The algorithm was evaluated using photos of grocery receipts from northern food retailers in remote Indigenous communities. Analysts from Statistics Canada’s Centre for Special Business Projects labeled products and sales information in each image.
Extracted texts, including store names, community names, product descriptions and dates, were evaluated as a similarity score. The similarity between the two texts was calculated as two times the total number of matching characters divided by the total number of characters in both descriptions. Extracted numbers, such as the product price, subsidy, discount and deposit, were each evaluated to be a match (1) or not (0).
For singular fields such as store names, it was easy to compare the predicted value with the actual value. Nevertheless, a simple one-to-one comparison was not possible for comparing the multiple items captured manually with the multiple items predicted by the OCR algorithm. Consequently, each manually captured item was first matched to the most similar item extracted by the OCR algorithm. The matched items from two sources needed to be at least 50% similar to each other. Items captured manually but not by the algorithm were called missed items. Items captured by the algorithm but not manually were called extra items. Once the common items were matched together, the similarity scores for all pairs were averaged to produce an overall similarity score for all common items found on the receipts.
The OCR algorithm excelled at identifying products from the receipts. Of the 1,637 total products listed on the receipts, 1,633 (99.76%) were captured (Table 4), with an average product description similarity of 96.85% (Table 5). The algorithm failed when text in the image was cut off, blurred, creased, or had areas with no ink. As a result, we recommended that OCR extractions be followed by human verification via the web interface. For the products in common, prices were correctly extracted 95.47% of the time, NNC subsidies were correct 99.14% of the time, Nunavik COL subsidies were correct 99.76% of the time, discounts were correct 100.0% of the time, deposits were correct 99.76% of the time, price per quantities were correct 95.71% of the time, and SKUs were correct 95.22% of the time (Table 5).
Even though product descriptions and prices were always present, other fields such as NNC subsidy were only present when applicable. For this reason, Table 5 also reports accuracies restricted to non-missing fields, in order to evaluate the OCR performance exclusively. No discount entries were included in this batch of receipts, so another batch was used to evaluate that discounts were correctly extracted 98.53% of the time. The text similarity score for fields observed and OCR’d was 87.1%.
| Number of receipts | Number of items | Number of items extracted | Number of items in common | Percentage of items missed | Percentage of extra items |
|---|---|---|---|---|---|
| 182 | 1,637 | 1,634 | 1,633 | 0.24% (4/1,637) | 0.06% (1/1,630) |
Table 4. Products extracted from receipts from CIRNAC
|
Product description |
Price |
NNC Subsidy |
Nunavik COL Subsidy |
Discount |
Deposit |
Price per quantity |
SKU |
|
|---|---|---|---|---|---|---|---|---|
| Accuracy on items in common | 96.85% | 95.47% (1,559/1,633) | 99.14% (1,619/1,633) | 99.76% (1,629/1,633) | 100.0% (1,633/1633) | 99.76% (1,629/1,633) | 95.71% (1,563/1,633) | 95.22% (1,555/1,633) |
| Accuracy on items when fields were present | 96.85% | 95.47% (1,559/1,633) | 99.08% (647/653) | 100.0% (282/282) | Not available. No actual occurrence | 97.56% (160/164) | 72.97% (81/111) | 95.52% (1,555/1,628) |
Receipt information was extracted effectively with no communities, store names, or dates being completely missed or falsely identified. The average text similarity score was consistently high: 99.12% for community, 98.23% for store names, and 99.89% for dates. Using the OCR algorithm and the receipt entity classifier to process receipts appears promising.
Additionally, 88.00% of sensitive texts were correctly redacted. Of the texts that failed to be redacted, most were cashier IDs. These were not redacted because the entity classifier had not seen this type of sensitive information before. Retraining the entity classifier with examples of cashier IDs will improve the results, much like how the classifier recognizes cashier names to be sensitive because of examples like "Your cashier today was <cashier name>" in its training data.
| Number of receipts |
Store name |
Community |
Date |
Sensitive info (Recall %) | |
|---|---|---|---|---|---|
| Evaluation | 182 | 98.23% | 99.12% | 99.89% | 88.80 |
| Evaluation when fields were present | 164 | 99.02% | 99.88% | 98.03% | Not applicable |
Conclusion
This project demonstrated that an entity classification and OCR algorithm can accurately capture various components of grocery receipts from northern retailers. Automating this process makes it easier to collect data on the cost of living in the North. If and when this solution goes into production, the automation should be followed with a human-in-the-loop validation process through a web interface to ensure that the receipt is correctly digitized, and corrections are iteratively used for retraining. This validation feature has been implemented but is not discussed in this article.
Aggregate anonymized data collected through crowdsourcing has the potential to provide better insight into issues associated with the high cost of food in isolated Indigenous communities and could improve the transparency and accountability of Nutrition North Canada subsidy recipients to residents in these communities. If you are interested in learning more about the web application component, please reach out to datascience@statcan.gc.ca.
Meet the Data Scientist

If you have any questions about my article or would like to discuss this further, I invite you to Meet the Data Scientist, an event where authors meet the readers, present their topic and discuss their findings.
Thursday, June 15
1:00 to 4:00 p.m. ET
MS Teams – link will be provided to the registrants by email
Register for the Meet the Data Scientist event. We hope to see you there!
Subscribe to the Data Science Network for the Federal Public Service newsletter to keep up with the latest data science news.
References
- sklearn.naive_bayes.MultinomialNB — scikit-learn 1.2.0 documentation
- sklearn.linear_model.SGDClassifier — scikit-learn 1.2.0 documentation
- sklearn.svm.LinearSVC — scikit-learn 1.2.2 documentation
- 1.10. Decision Trees — scikit-learn 1.2.0 documentation
- sklearn.ensemble.RandomForestClassifier — scikit-learn 1.2.0 documentation
- XGBoost Documentation — xgboost 1.7.2 documentation
- Date modified: