
A Use Case on Metadata Management
By: Ekramul Hoque, Statistics Canada
What is metadata?
Metadata are data that provide information about other data. In other words, it is "data about data." It's one of the core components of data governance as it imposes management disciplines on the collection and control of data. Data scientists spend a significant amount of time gathering and understanding data. We can generate faster insights when we have access to underlying metadata.
Why does an organization need a metadata management system?
When an organization has a metadata management system, it means their employees can add metadata into their repositories quickly and accurately without affecting the access to data within their systems. Doing this improves creative workflows and enhances business processes. For example, one of Statistic Canada's core activities is to do a statistical analysis of a wide range of data types and quantities. To do this effectively, analysts must be able to quickly locate the most useful data to determine its structure and semantics.
Some key benefits of metadata management include:
- maximizing the use of relevant data and improving its quality,
- a common platform by which diverse groups of data citizens can discuss and efficiently manage their work. For example, data engineers who works with technical metadata and data type standards can provide support for generating and consuming metadata
- Creating faster project delivery timelines due to improved data integration across various platforms.
Naturally, successful data analysis relies on strong metadata management. A strong metadata management story can also mean improved data discovery capabilities. It summarizes the most basic information about the data, making it easier to find and track.
Metadata automation is a recent industry trend that is replacing the increasingly tedious process of manual data mapping when managing metadata. Some key benefits of automation include data quality assurance and faster project delivery timelines due to improved data integration across various platforms. Metadata management ensures regulatory compliance through data standardization. It also improves productivity and reduces costs. Metadata management enables knowledge of what data exists and its potential value, thus promoting digital transformation which allows organizations to know what data they have and its potential valueReference 1.
Data standardization
When data are provided by external partners, it's likely their system or application was created independently. Data standardization establishes a mutual understanding of the data's meaning and semantics, allowing its users to interpret and use the data correctly.Reference 2
As a part of the Data Standardization Governance Collaborative (DSGC), Statistics Canada has aligned with the Statistical Data and Metadata eXchangeReference 3 (SDMX), an international initiative that aims at standardizing and modernizing the mechanisms and processes for the exchange of data and metadata. SMDX has been published as an International Organization for Standardization and approved as an official standard within Statistics Canada.
SMDX is a framework that helps to standardize of both data and metadata. Though it's well-entrenched in the System of National Accounts at Statistics Canada, it's still in the initial phase of being introduced to other areas within the organization. This method of data interoperability should lead to:
- a reduction of duplication;
- better understanding of concepts;
- help to identify data gaps;
- facilitate easier reconciliation; and
- allow in-depth analysis.
The SMDX Standard could be leveraged and aligned in an "agile-light-standard" format allowing the use of tools to rapidly produce infrastructure and interoperability layers, which would allow for sharing of information quickly.
Data cataloging
Another key component for metadata management is data cataloging. Data cataloging is commonly defined as the discovery of data assets from participating data holdings. Its primary objective is to use consistent methods to find the data and the information associated with it. Figure 1 illustrates how analysis processes change when analysts work with a data catalog.
Figure 1: Process with and without a Data Catalog. Graph from Alation - Data Intelligence + Human Brilliance
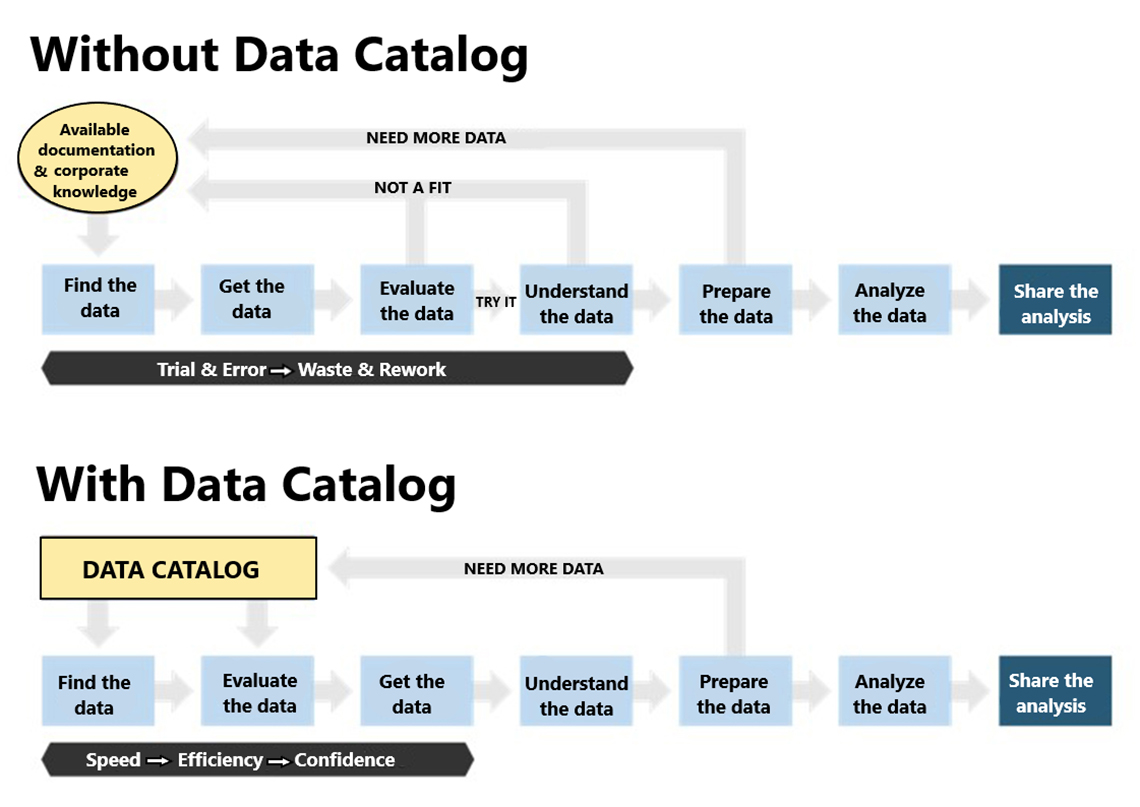
Figure 1: Process with and without a Data Catalog.
There are two diagrams.
The diagram at the top shows how processes work without a data catalog. It shows a yellow circle with the words "Available documentation & corporate knowledge". From there, an arrow points down to a blue box with the words "Find the data" and from that box, an arrow points right to another blue box with the words "Get the data" and then an arrow points to a third blue box with the words "Evaluate the data". This blue box has an arrow pointing up to the words "Not a fit" where the reader is directed to restart at the yellow circle. However, there is another arrow from the "Evaluate the data" box, which points right. This arrow has the words "try it" above it. The arrow brings the reader to another blue box with the words "Understand the data". This box has an arrow pointing up to "Not a fit" again and another arrow pointing right to another blue box with the words "Prepare the data". This blue box also has two arrows – one pointing up to the words "Need more data" where the reader is directed back to the yellow circle to restart at step one, the other arrow points right to a blue box with the words "Analyze the data" and from there, another arrow right to a navy blue box to the words "Share the analysis". This diagram is meant to depict trial and error without a data catalogue.
The diagram at the bottom depicts how processes work with a data catalog. It shows a yellow square with the words "Data Catalog". From this box, there are two arrows pointing down. One to a blue box on the left "Find the data" and another blue box on the right, which says "Evaluate the data". Both boxes are also connected by an arrow, going from the left to the right. From the "Evaluate the data" box, an arrow points right to another blue box, which reads, "Get the data". This points to another blue box, which reads, "Understand the data", itself pointing to another blue box which reads, "Prepare the data". From this box, there is an arrow pointing up which means you need more data and must restart at the yellow box with the word "Data Catalog" or if you follow the arrow pointing right, you continue to another blue box with the words "Analyze the data". This blue box points to a final navy blue box with the words "Share the analysis". This diagram is meant to depict speed, efficiency and confidence in the process with a data catalogue.
Without a data catalog, analysts search for information by figuring out documentation based on its ancestral information, by collaborating with associates and working with other recognizable datasets. This cycle requires experimentation and the need to "squander and improve" data. The analyst is then required to look through familiar datasets.
With a data catalog the analyst can search available datasets, assess the data and make informed decisions on which information to use. They can then examine and plan their information effectively and with greater certaintyReference 4. CKAN (named derived from the acronym for Comprehensive Knowledge Archive Network) has been created to support this process.
What is CKAN?
CKAN - The world's leading open source data management system is an open-source data management system for national and regional data publishers, governments and organizations that want to publish, share and make their data open and available for use.
Why use CKAN?
- It's open source and free, which means users retain all rights to the data and metadata they store within the software.
- It's written in Python and JavaScript. The JavaScript code in CKAN is broken down into modules: small, independent units of JavaScript code. CKAN themes can add JavaScript features by providing their own modules. It keeps the code simple and easy to test, debug and maintain, by breaking it down into small, independent modules. Developers are allowed to write extension which is a Python package that modifies or extends CKAN. Each extension contains one or more plugins that must be added to user's CKAN config file to activate the extension's features
- It provides user management and data management.
- It provides a custom extension development.
- It provides an Automation Programming Interface (API) endpoint to store, edit, extract and analyze data.
Metadata use case
At the end of 2019, Statistics Canada's Data Science and Operationalization team began working with the agency's Integrated Business Statistics Program (IBSP). The IBSP is the common data processing system for the majority of Statistics Canada's economic surveys.
The aim of the project is to address the limitations of the current analytical space. A new solution will help:
- address the need for a self-serve analytical solution;
- improve the ability to connect to analytical tools;
- add searchability and discoverability of datasets;
- avoid data duplication;
- move away from one-size-fits-all security access; and
- allow for horizontal analysis using data outside of IBSP.
IBSP and the Data Science Division partnered with the Fair Data Infrastructure (FDI) to determine whether a prototype could be created using open-source tools.
The FDI aims to provide a collaborative data and metadata ecosystem for all data suppliers and users. The core of this space is a data catalog, as well as data and metadata management tools.
Knowledge transfer from analysts to administrator before a Cloud is established
IBSP have analysts who want to access surveys. These surveys are managed and updated by an administrator from the IBSP team; however, the process of updating and creating access causes duplicate and redundant data. Also, the analysts struggle to search for these data and the corresponding metadata since they're available through shared directories.
Figure 2: Identified bottleneck for the IBSP Proof of Concept (PoC)
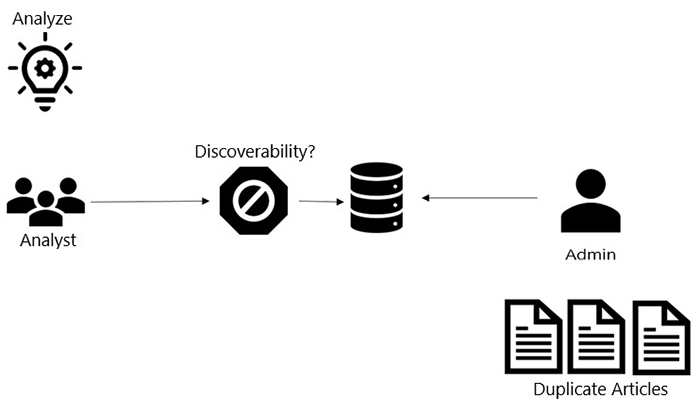
Figure 2: Identified bottleneck for the IBSP Proof of Concept (PoC)
The process of knowledge transfer from analysts to administrator before a Cloud is established. It begins with an image of a light bulb in the top left corner with the word "Analyze" written above it. The figure below shows three figures with the word "Analyst" below it. An arrow points right to the next image in the timeline, which is an octagon shape and a "no icon" within it. An arrow points right from there to an icon with stacked circles, meaning data is being organized. From this icon, an arrow is pointing right to a single person – the admin. There are multiple page icons beneath the admin icon with the words "Duplicate Articles" beneath it.Knowledge transfer from analysts to administrator after a Cloud is established
The team introduced three components to find a solution to the identified bottleneck:
- The Search Service from FDI: The FDI team has been facilitating metadata registration and discoverability through a data virtualization layer.Reference 5 The search engine is written on top of Elastic Search with API endpoints, allowing external and internal users to manage their data assets.
- CKAN
- The Azure Cloud tenant
The IBSP uploads data and metadata into CKAN and the Search Service from FDI. This enables analysts to search and access data and metadata. The two systems are in sync with the Azure Cloud tenant to manage user authentication and data storage
Figure 3: Solution provided for IBSP PoC
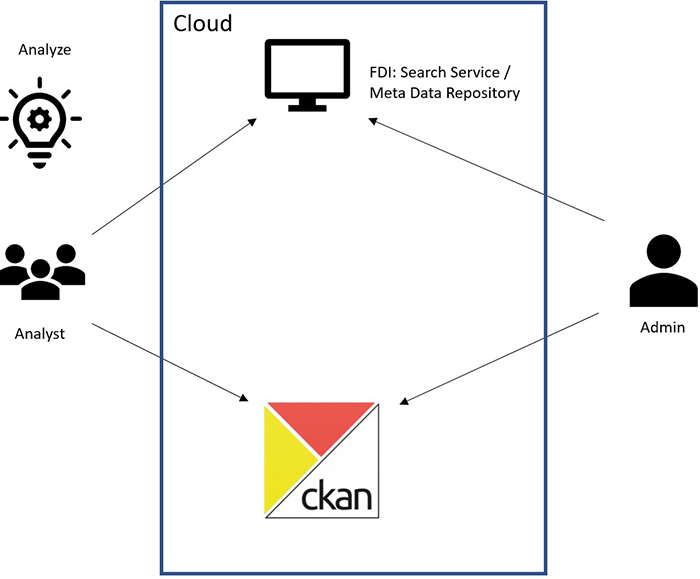
Figure 3: Solution provided for IBSP PoC
This image depicts the process of knowledge transfer from Analysts to Administrator after a Cloud has been established. It begins with an image of a light bulb in the top left corner with the word "Analyze" written above it. Beneath the light bulb shows three people with the word "Analyst" below it. Two arrows point right to a box in the centre of the image with the word "Cloud" above it. One of the arrows from the analyst icon points to a monitor icon at the top of the Cloud box with the words "FDI: Search Service/Meta Data Repository". The other arrow points to a CKAN icon below the monitor icon. On the right side of Figure 3, there is an icon of a single person with the word "Admin" written beneath it. From the admin icon, two arrows point left – one to the monitor icon and the other to the CKAN icon. This depicts both positions working within the Cloud, providing a solution to the bottleneck issue from Figure 3.A metadata management solution
A successful metadata management implementation should include; a metadata strategy, metadata integration and publication, metadata capture and storage, metadata governance and management. A metadata strategy guarantees that an organization's whole data ecosystem is consistent. This strategy explains why the company tracks metadata and identifies all of the metadata sources and methods it employs. Such strategy can be very complex in terms of the volume and the variations of the data along with the company's technological capabilities to support it. The diagram below is a high level overview on how such strategy can be implemented.
Figure 4: Metadata Infrastructure
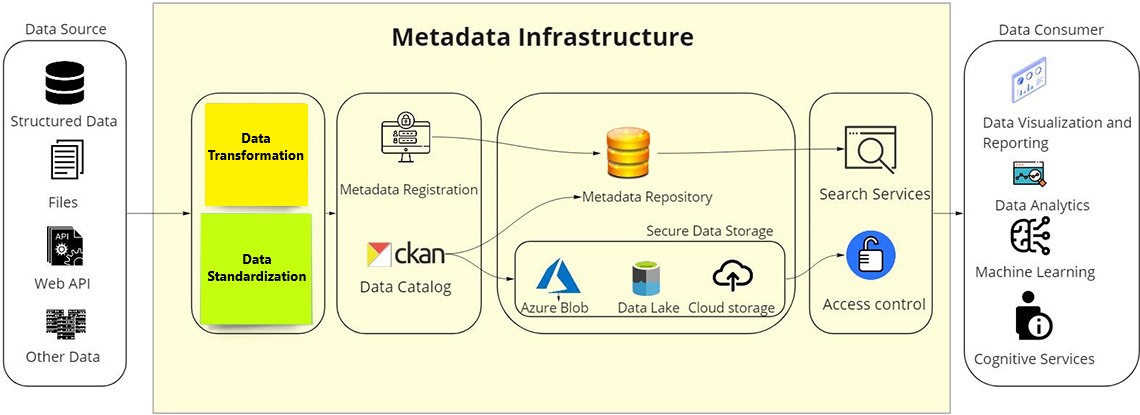
Figure 4: Metadata Infrastructure
The diagram showcases possible metadata infrastructure and how data typically flows from its sources (left to right) through to its consumers. It starts with an oval shaped placeholder with "Data Source" as its title. The placeholder contains four icons and four labels. Each icons are stacked vertically. The first icon represents the files labelled as "Structured Data". The second icon is a "two page" icon labelled as "Files". The third icon is a cog-shaped image labelled as Web API. The fourth and last icon are three squared shaped disks stacked on top of each other that means multiple data sources, representing other data.
From there, an arrow points to a larger icon labelled "Metadata Infrastructure" which outlines over four more oval placeholders stacked horizontally/side-by-side containing pairs of icons and labels with arrows pointing to the right in between them. The first placeholder has two sticky notes – one yellow labelled 'Data Transformation'. The other is green inscribed 'Data Standardization'.
From there, an arrow points to the next placeholder which contains two icons. The first icon is a desktop with a lock sign and two user logos, labelled 'Metadata registration'. Right below it, the second icon represents CKAN labelled "Data Catalog". From the first icon, an arrow points to stacked golden shaped circles labelled "Metadata repository". From the CKAN icon, one arrow points to the "Metadata Repository" and the second arrow points to the "Secure Data Storage". Inside this box there are three icons with labels which are placed horizontally. The first icon is a blue triangle representing "Azure Blob". The second icon is a cylindrical shape representing "Data Lake". The last icon in this box is a cloud shaped with arrow pointing upwards representing "Cloud Storage".
Two arrows point from this placeholder – one to the "Metadata repository" icon and "Search Services". The other arrow points to "Secure Data Storage" to an icon representing 'Access Control'.
From there, an arrow points to "Data Consumer". The placeholder contains four icons. Each icon are stacked vertically. The first icon is a desktop with charts and analytics with "Data Visualization and Reporting" as its label. The second icon is a browser icon that has a graph and a magnifying glass labelled "Data Analytics". The third icon is has a partial brain image with three wires connecting it labelled "Machine Learning". The fourth is a person labelled "Cognitive Services".
For any organization there is a list of data sources that comes in various forms such as structured data, flat file formats or through web APIs. And these data are consumed for analysts to visualize and report, create analytics or cognitive services. A metadata management strategy is central in ensuring that data is well interpreted and can be leveraged to bring results.
The first step of this data management is data ingestion which commonly goes through a set of transformations and classifications. Adopting a data standardization here is a key process as this will establish a common way of structuring and understanding the data, and include principles and implementation issues for using it. The business objective of this process will also allow collaborative analysis and exchange with external partners.
Through this standardization, the data custodians should be able to register data assets and metadata. They should have the ability to ingest and register their metadata, which will make their data assets discoverable and will allow them to continue to manage their data through a data virtualization layer. And this can be achieved by introducing a data cataloging tool that will help facilitate in providing a consistent method to find data and information that is available for both internal and external data partners of the organization.
With the use of open-source technology and modern cloud infrastructure, it's possible to create a platform where internal and external partners can ingest raw data from various sources to a secure storage space (i.e. Data Lake or Blob storage). Rather than having a 'on-prem' database for the data cataloging tool or the metadata registration like Postgres, etc. its more scalable and robust to have a cloud storage as a backend to these systems. It will not only allow to update, sync and share easily, but also help manage access control sensitive data as well.
Search-services can be implemented at the last layer of this strategy to make the data and metadata discoverable to its end users. When there is a data gap, users should be allowed to report so that data stewards could know what data needs in order to fill. All the communication between the components in the diagram can occur through APIs or SSH to allow modular integration system.
Lastly, an organization needs a metadata governance structure, which includes an assessment of metadata responsibility, life cycles, and statistics, as well as how metadata are integrated into various business processes.

If you have any questions about this article or would like to discuss this further, we invite you to our new Meet the Data Scientist presentation series where the author(s) will be presenting this topic to DSN readers and members.
Tuesday, June 21
2:00 to 3:00 p.m. EDT
MS Teams – link will be provided to the registrants by email
Register for the Data Science Network's Meet the Data Scientist Presentation. We hope to see you there!
- Date modified: