
Designing a metrics monitoring and alerting system
By: Simardeep Singh, Statistics Canada
Introduction
Designing a metrics monitoring and alerting system is a crucial step in ensuring the health and performance of any system or application. A well-designed system can help identify potential issues before they become critical, allowing for quick resolution and minimizing downtime.
The first step in designing a metrics monitoring and alerting system is to identify the key metrics that need to be monitored. These metrics should be chosen based on the specific goals and objectives of the system or application, as well as its unique characteristics and requirements. For example, a website may need to monitor metrics such as page load time, user engagement, and server response time, while a mobile app may need to monitor metrics such as battery usage and network performance.
Once the key metrics have been identified, the next step is to determine how they will be collected and stored. This may involve setting up specialized monitoring tools or using existing tools and services. It is important to ensure that the data collected is accurate, reliable, and easily accessible.
The next step is to set up alerts and notifications based on the metrics being monitored. This can be done using a variety of tools and methods, such as email, SMS, or push notifications. The alert thresholds should be carefully chosen to ensure that they are sensitive enough to detect potential issues, but not so sensitive that they generate erroneous alerts.
Finally, it is important to regularly review and assess the performance of the metrics monitoring and alerting system. This can involve analyzing the data collected, identifying areas for improvement, and making any necessary adjustments to the system. By continuously improving the system, it can remain effective and reliable over time.
What are the major components of the system?
A metrics monitoring and alerting system consists of five components:
- Data collection: collects metric data from different resources.
- Data transmission: transfers data from sources to the metrics monitoring system.
- Data storage: organizes and stores incoming data.
- Alerting: analyzes the incoming data, detects anomalies and generates alerts. The system must be able to send alerts to different communication channels configured by the organization.
- Visualization: presents data in graphics, charts, etc. It's easier to identify the patterns, trends or problems when data is presented visually.
How to design the metrics for monitoring and alerting system
In this section, we discuss some fundamentals of building the system, the data model, and the high-level design.
Data modelling: Metrics data is generally recorded as a time series that contains the set of values with their associated timestamps. The series itself can be identified by its name, and operationally by a set of labels. Every time series consists of the following:
Table 1: Time series
| Name | Type |
|---|---|
| A metric name | String |
| A set of tags/labels | List of <key: value> pairs |
| An array of values and their timestamps | An array of <value, timestamp> pairs |
Data access pattern: Consider a real-world scenario where the alerting system must calculate the average CPU load across all the webservers in a specific region. The data must be averaged every 10 minutes, which accounts for about 10 million operational metrics written per day, and many metrics are collected at high frequency. For these systems, the write load is heavy, and the read load is simultaneously spiky. Both visualization and alerting services will send the queries to the database, and depending on the access patterns and alerts, the read volume can either increase or decrease. The system is under constant heavy write load, while the read load is spiky.
Data storage system: A general-purpose database, in theory, could support time-series data, but it will require extensive tuning to make it work on a large scale. A relational database is not optimized for operations commonly performed against time-series data.
There are many storage systems optimized for time-series data. Optimization consumes fewer servers to handle huge volumes of data. Many of these databases have custom query interfaces designed for the analysis of time-series data that are much easier to use than structured query language (SQL).
Two very popular time-series databases are Influx DB (database) and Prometheus, which are designed to store large volumes of time-series data and perform real time analysis. Another feature of the strong time-series database is efficient aggregation. Influx DB builds indexes on the labels to facilitate the fast lookup of time-series by labels.
High level design
Figure 1: High level design for a metrics monitoring and designing system
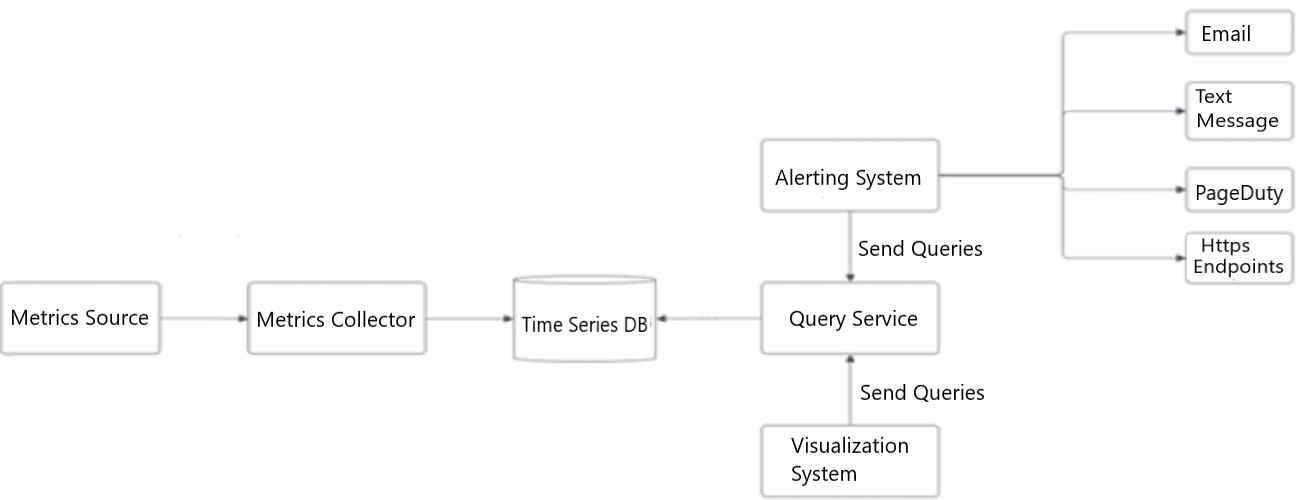
Figure 1: High level design for a metrics monitoring and designing system
Different components of the metrics monitoring and alerting system interacting with each other. The metrics source generates the metrics which are being collected by the metrics collector and being fed to the time-series database. The time-series database is being queried by the visualization system to show the visuals and the altering system to notify the developers.
- Metrics Source
- forward to Metrics Collector
- Metrics Collector
- forward to Time Series DB
- Time Series DB
- back to Metrics Collector
- back to Query Service
- Query Service
- back to Alerting System (send queries)
- back to Visualization System (send queries)
- Visualization System
- forward to Query Service
- Alerting System
- forward to Query Service
- forward to Email
- forward to Text Message
- forward to PageDuty
- forward to Https Endpoints
- Text Message
- PageDuty
- Https Endpoints
- Metrics source:This can be application servers, SQL databases, message queues, etc.
- Metrics collector: Gathers metrics data and writes data into the time-series database.
- Time-series database: This stores metrics data as time series. It usually provides a custom-query interface for analyzing and summarizing a large amount of time-series data. It maintains indexes on labels to facilitate the fast lookup of data using the labels.
- Query service: The query service makes it easy to query and retrieve data from the time-series databases.
- Alerting system: This sends alert notifications to various alerting destinations.
- Visualization system: This shows metrics in the form of various graphs/charts.
Design deep dive
Let's investigate the designs in detail:
- Metrics collection
- Scaling the metrics transmission pipeline
- Query service
- Alerting system
- Visualization system
Metrics collection
There are two ways metrics data can be collected – pull or push.
Figure 2: Metrics collection flow

Figure 2: Metrics collection flow
The metrics source and metrics collector system. These components are discussed in the detailed in the following paragraphs.
- Metrics Source
- forward to Metrics Collector
- Metrics Collector
- forward to Time Series DB
- Time Series DB
- back to Metrics Collector
- back to Query Service
- Query Service
- back to Alerting System (send queries)
- back to Visualization System (send queries)
- Visualization System
- forward to Query Service
- Alerting System
- forward to Query Service
- forward to Email
- forward to Text Message
- forward to PageDuty
- forward to Https Endpoints
- Text Message
- PageDuty
- Https Endpoints
Pull model
In a pull model, the metrics collector pulls the metrics from the sources. Consequently the metrics collector needs to know the complete list of service ends to pull the data. We can use a reliable, scalable and maintainable service like service discovery, provided by ETCD and Zookeeper. A service discovery contains configuration rules about when and where to collect the metrics.
- The metrics collector fetches the configuration metadata of service endpoint from service discovery. Metadata includes pulling interval, IP addresses, timeout and retry parameters.
- The metrics collector pulls the metric data using the HTTP endpoint (for example, web servers) or TCP (transmission control protocol) endpoint (for DB clusters).
- The metrics collector registers a change event notification with the service directory to get an update whenever the service endpoints change.
Figure 3: Pull model in detail
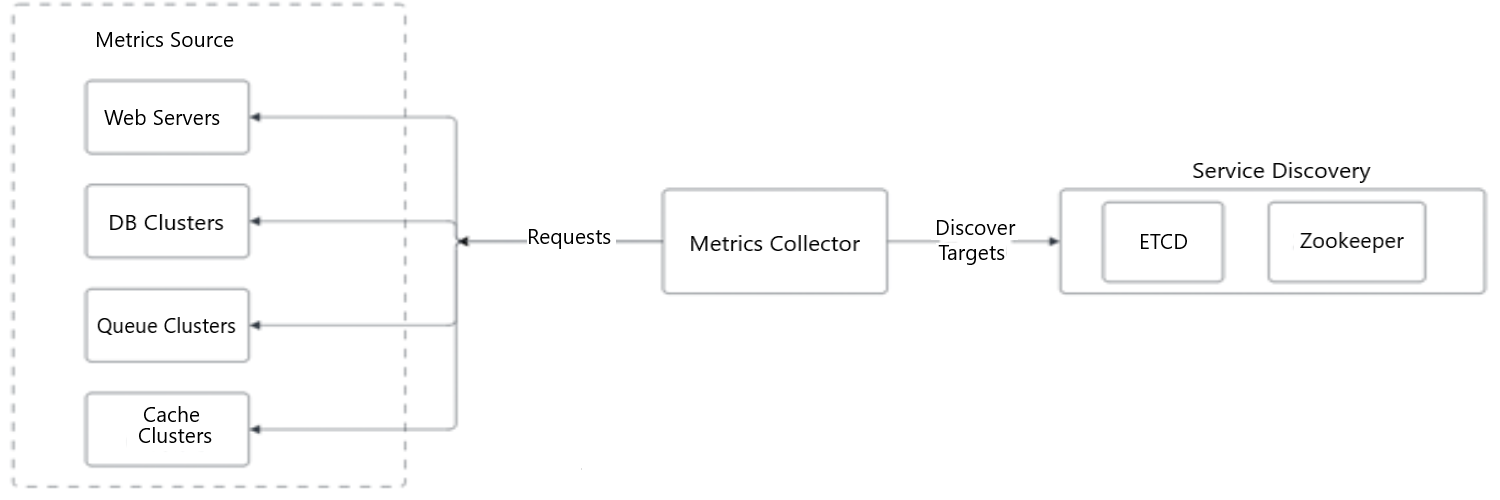
Figure 3: Pull model in detail
The metrics collector pulls the metrics from different sources. The metrics collectors get the information of service-end points from the service directory which includes ETCD and zookeeper.
- Metrics Collector
- forward to Service Discovery - ETCD and Zookeeper (via Discovery Targets)
- forward to Metrics Source – Web Servers, DB Clusters, Queue Clusters, Cache Clusters (via Requests)
- Service Discovery – ETCD Zookeeper
- Metrics Source – Web Servers, DB Clusters, Queue Clusters, Cache Clusters
Push model
In a push model, a collection agent is installed on every server that is being monitored. A collection agent is long-running software that collects the metrics from the service running on the server and pushes those metrics to the collector.
To prevent the metrics collector from falling behind a push model, the collector should always be in an autoscaling position with a load balancer in the front of it (Figure 4). The cluster should scale up or down based on the CPU (central processing unit) load of the metrics collector.
Figure 4: Push model in detail
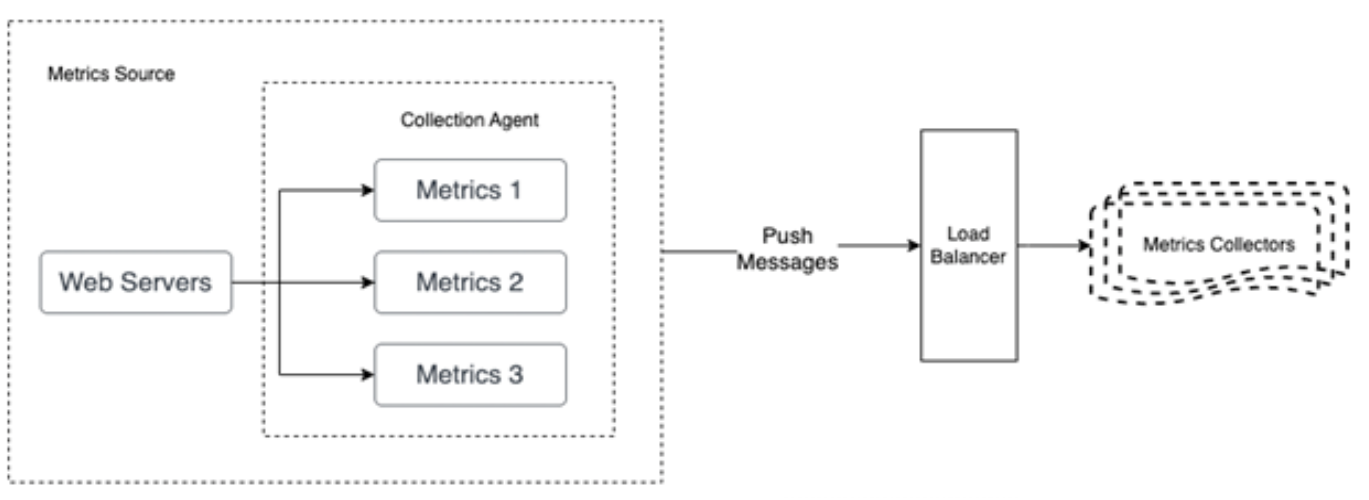
Figure 4: Push model in detail
The collection agent collects the metrics from the web servers and pushes those metrics to a load balancer. The load balancer balances the metrics load and pushes to the group of metrics collectors.
- Metrics Source
- Web Servers
- forward to Metrics 1
- forward to Metrics 2
- forward to Metrics 3
- Forward to Load Balancer
- Web Servers
- Load Balancer (via Push Messages)
- Forward to Metrics Collectors
- Metrics Collectors
Pull or push?
So, what's best for a large organization? Knowing the advantages and disadvantages of each approach is important. A large organization needs to support both, especially serverless architecture.
Push Monitoring System:
Advantages:
- Real-time notifications of issues and alerts
- Can alert multiple recipients at once.
- Can be customized to specific needs and requirements
- Can be integrated with other systems and applications
Disadvantages:
- Requires a constant and reliable internet connection to function properly
- Can be overwhelming with too many notifications and alerts
- Can be vulnerable to cyber-attacks and security breaches
Pull Monitoring System:
Advantages:
- Can be accessed remotely and for multiple devices
- Can be set up to check specific metrics and parameters at regular intervals
- Can be easily configured and customized
- Can provide detailed and historical data for analysis and reporting
Disadvantages:
- Requires manual intervention to check and review the data.
- May not provide the real-time alerts and notifications
- Can be less efficient in identifying and responding to issues and anomalies.
Scaling the metrics transmission pipeline
Whether we use the push or pull model, the metrics collector of servers and the cluster receive enormous amounts of data. There's a risk of data loss if the time-series database is unavailable. To navigate through the risk of losing data, we can use a queueing component as shown in Figure 5.
Figure 5: Add queues
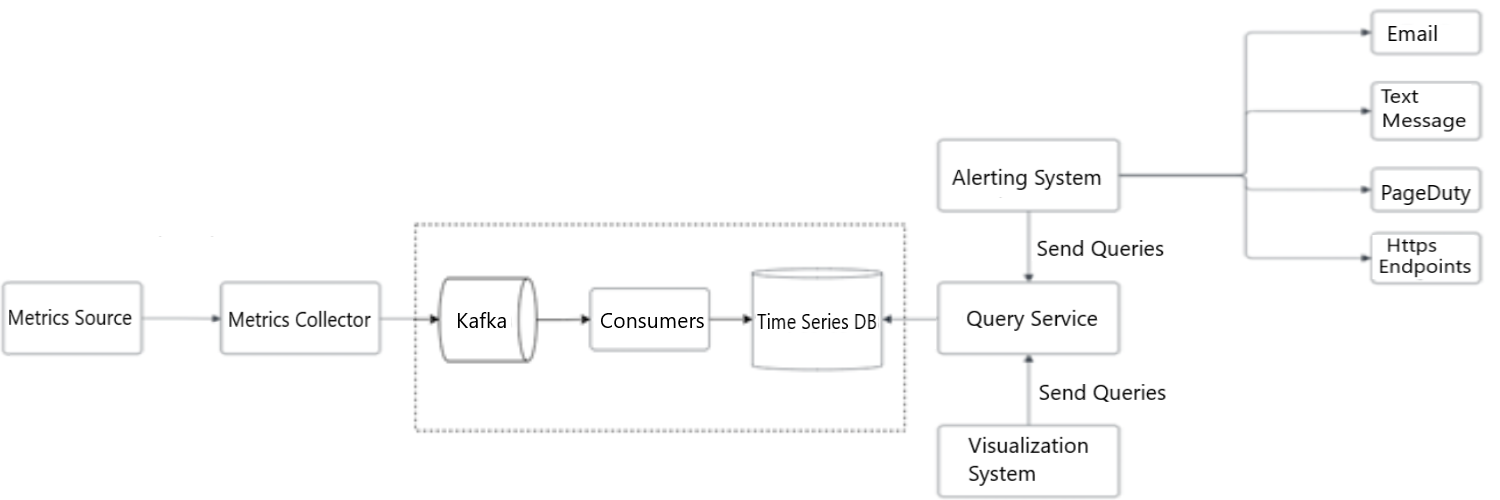
Figure 5: Add queues
Steps to scale the metrics transmission pipeline. The design leverages the use of Kafka's built-in partition mechanism to scale the system. Kafka helps to categorize and prioritize so that the important metrics cane be processed first by the time-series database.
- Metrics Source
- forward to Metrics Collector
- Metrics Collector
- forward to Kafka
- Kafka
- forward to Consumer
- Consumers
- forward to Time Series DB
- Time Series DB
- back to Query Service
- Query Service
- back to Alerting System
- back to Visualization System
- Visualization System
- forward to Query Service (send queries)
- Alerting System
- forward to Query Service (send queries)
- forward to Email
- forward to Text Message
- forward to PageDuty
- forward to Https Endpoints
- Text Message
- PageDuty
- Https Endpoints
In this design, the metrics collector sends metric data to a queuing system like Kafka. Then consumers or streaming processing services such as Apache Spark process and push the data to the time-series database. This approach has several advantages:
- Kafka is used as a highly reliable and scalable distributed messaging platform.
- It decouples the data collection and processing services from one another.
- It can easily prevent data loss when the database is unavailable by retaining the data in Kafka.
Query service
The query service comprises a cluster of query servers which access the time-series database and handle the requests from the visualization or alerting systems. Once you have a dedicated set of query servers, you can decouple time-series database from the visualization and alerting systems. This provides us with the flexibility to change the time-series database or the visualization and alerting systems, whenever needed.
To reduce the load of the time-series database and make the query service more performant, cache servers can be added to store query results, as shown in Figure 6.
Figure 6: Cache layer
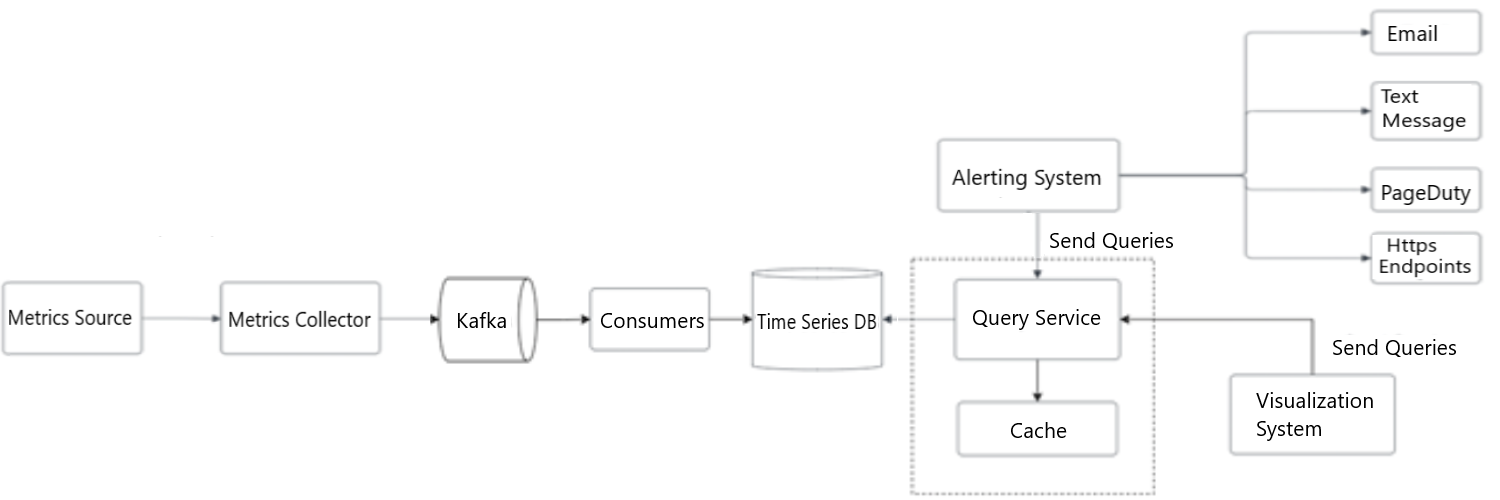
Figure 6: Cache layer
The integration of query service and cache layer. Cache layer reduces the load time of the time-series database and make query more performant.
- Metrics Source
- forward to Metrics Collector
- Metrics Collector
- forward to Kafka
- Kafka
- forward to Consumer
- Consumers
- forward to Time Series DB
- Time Series DB
- back to Query Service
- Query Service
- back to Alerting System
- back to Visualization System
- forward to Cache
- Cache
- Visualization System
- forward to Query Service (send queries)
- Alerting System
- forward to Query Service (send queries)
- forward to Email
- forward to Text Message
- forward to PageDuty
- forward to Https Endpoints
- Text Message
- PageDuty
- Https Endpoints
Storage layer
Space optimization – In order to optimize the storage, following strategies can be used to tackle this problem:
Data encoding and compression: Data encoding is the process of translating data from one format into another, typically for the purposes of efficient transmission or storage. Data compression is a related process that involves reducing the amount of data required to represent a given piece of information. Together data encoding and compression can significantly reduce the size of the data. It is the process of encoding, restructuring, or otherwise modifying data to reduce its size. Essentially, it involves re-encoding information with fewer bits than the original representation.
Downsampling: Downsampling is the process of reducing the number of samples in a dataset by removing some data points. This is often done to reduce the amount of data that needs to be processed and to simply the analysis. Downsampling can be done in a variety of ways, including randomly selecting a subset of the data points, using a specific algorithm to select the data points, or using a specific sampling frequency to reduce the data. If the data retention policy is set to one year, we can sample the data using the following example.
- Retention: seven days, no sampling
- Retention: 30 days, down sample to one minute resolution
- Retention: one-year, down sample to one hour resolution
Alerting system
A monitoring system is very useful for proactive interpretation and investigation, but one of the main advantages of a full monitoring system is that administrators can be disconnected from the system. Alerts allow you to define situations to be actively managed while relying on passive monitoring of software to watch for changing conditions.
The alert flow works as follows:
- Load the config files to the cache servers. Rules are defined as config files on the disk, shown in Figure 7.
Figure 7: Alerting system
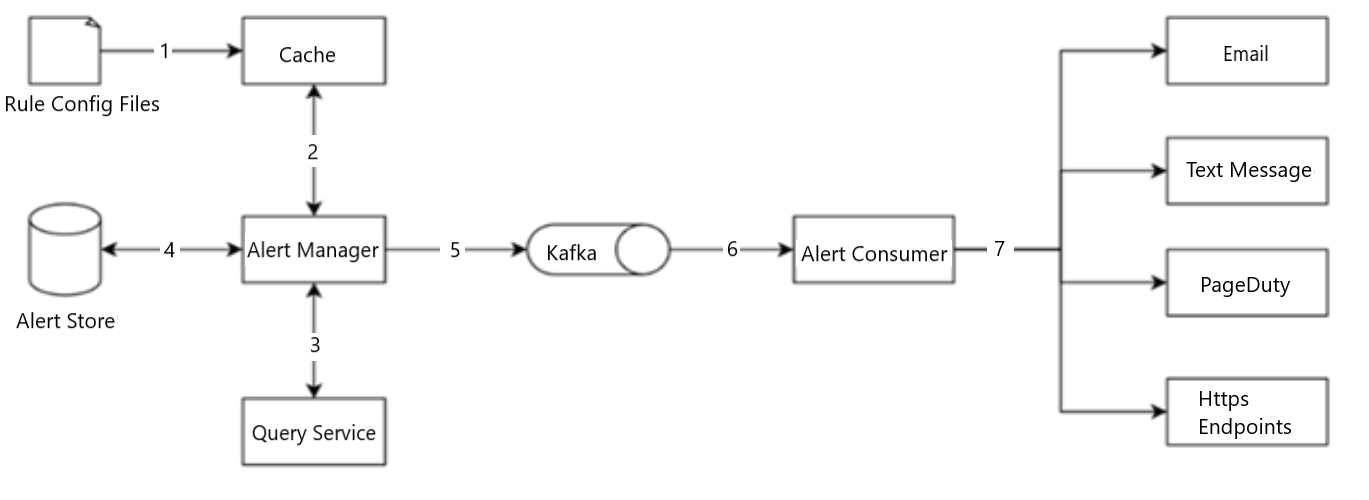
Figure 7: Alerting system
The raw config files are being cached and forwarded to the alert manager. The alert manager forwards those files to Kafka which are further consumed by the Alert consumers including e-mail, text message, page duty and http endpoints.
- Rule Config Files
- forward to Cache
- Cache
- forward to Alert Manager
- Alert Manager
- back to Cache
- forward to Query Service
- lateral to Alert Store
- forward to Kafka
- Query Service
- back to Alert Manager
- Alert Store
- back to Alert Manager
- Kafka
- forward to Alert Consumer
- Alert Consumer
- forward to Email
- forward to Text Message
- forward to PageDuty
- forward to Https Endpoints
- Text Message
- PageDuty
- Https Endpoints
- The alert manager fetches alert configs from the cache.
- Based on the config rules, the alert manager calls the query service at a predefined interval. If the value violates the threshold, an alert event is created. The alert manager is responsible for the following:
- Filter, merge, and dedupe alerts. Here's an example of merging alerts that are triggered within one instance in a short amount of time.
Figure 8: Merge alerts
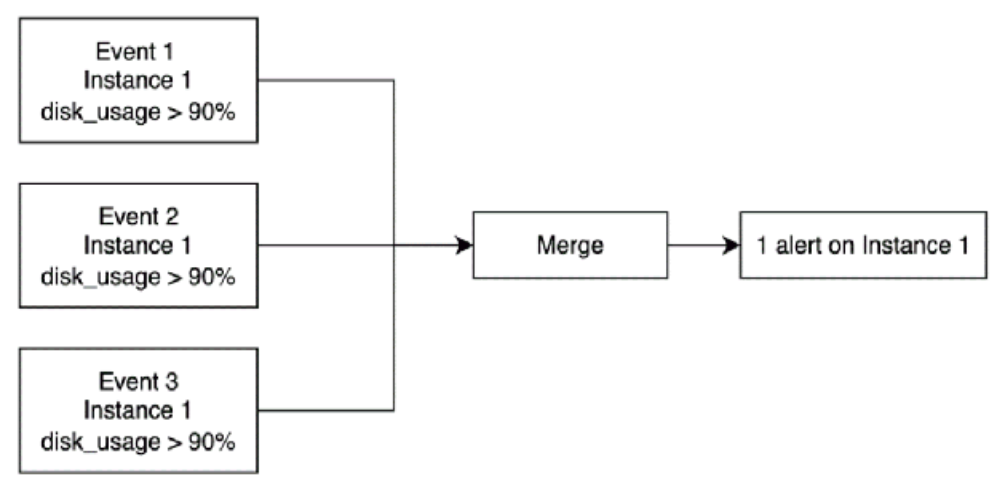
Figure 8: Merge alerts
Merging of the alerts with respect to the different events.
- Event 1, Instance 1, disk_usage > 90%
- forward to Merge
- Event 2, Instance 1, disk_usage > 90%
- forward to Merge
- Event 3, Instance 1, disk_usage > 90%
- forward to Merge
- Merge
- forward to 1 alert on Instance 1
- 1 alert on Instance 1
- Access control—to avoid human error and keep the system secure, it is essential to restrict access to certain alert management operations to authorized individuals only.
- Retry—the alert manager checks alert states and ensures a notification is sent at least once.
- The alert store is a key-value database such as Cassandra, that keeps the state (in-active, pending, firing, resolved) of all alerts. It ensures a notification is sent at least once.
- Eligible alerts are inserted into a messaging and queuing system such as Kafka.
- Alert consumers pull alert events from the messaging and queuing system.
- Alert consumers process alert events from the messaging and queuing system and sends notifications to different channels such as email, text message, PageDuty, or HTTP endpoints.
Visualization system
Visualization is built on top of the data layer. Metrics can be shown on the metrics dashboard over various time scales and alerts can be shown on the dashboard. A high-quality visualization system is hard to build. There's a strong argument for using an off-the-shelf system. For example, Grafana can be a very good system for this purpose.
Wrap up
In this article we discussed the design for a metrics monitoring and alerting system. At a high level, we talked about the data collection, time-series database, alerts and visualization. We also dove into some of the important techniques and components, such as:
- Push versus pull model for collecting metrics data.
- Using Kafka to scale the system.
- Choosing the right time-series database.
- Using down sampling to reduce data size.
- Build versus buy options for alerting and visualization systems.
We went through a few iterations to refine the diagram, and our final design looks like this:
Figure 9: Final design
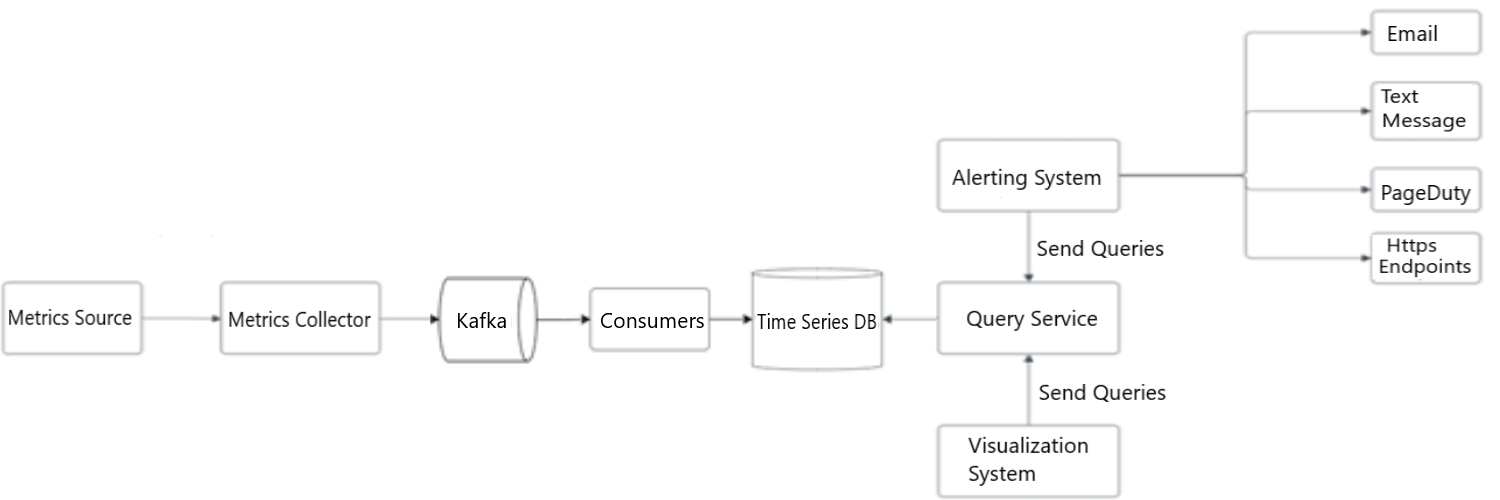
Figure 9: Final design
The refined design for the metrics monitoring and alerting system.
- Metrics Source
- forward to Metrics Collector
- Metrics Collector
- forward to Kafka
- Kafka
- forward to Consumer
- Consumers
- forward to Time Series DB
- Time Series DB
- back to Query Service
- Query Service
- back to Alerting System
- back to Visualization System
- Visualization System
- forward to Query Service (send queries)
- Alerting System
- forward to Query Service (send queries)
- forward to Email
- forward to Text Message
- forward to PageDuty
- forward to Https Endpoints
- Text Message
- PageDuty
- Https Endpoints
In conclusion, designing a metrics monitoring and alerting system is a crucial step in ensuring the health and performance of any system or application. By carefully selecting the key metrics to monitor, collect and store data accurately, setting up effective alerts and notifications, and regularly reviewing and improving the system, it is possible to create a robust and reliable system that can help identify and resolve potential issues before they become critical.
Meet the Data Scientist

If you have any questions about my article or would like to discuss this further, I invite you to Meet the Data Scientist, an event where authors meet the readers, present their topic and discuss their findings.
Thursday, February 16
2:00 to 3:00 p.m. ET
MS Teams – link will be provided to the registrants by email
Register for the Data Science Network's Meet the Data Scientist Presentation. We hope to see you there!
Subscribe to the Data Science Network for the Federal Public Service newsletter to keep up with the latest data science news.
Additional resources
- Datadog
- Splunk
- PagerDuty
- Elastic stack
- Dapper, a Large-Scale Distributed Systems Tracing Infrastructure
- Distributed Systems Tracing with Zipkin
- Prometheus
- OpenTSDB-A Distributed, Scalable Monitoring System
- Data model
- MySQL
- Schema design for time-series data | Cloud Bigtable Documentation
- MetricsDB
- Amazon Timestream
- DB-Engines Ranking of time-series DBMS
- InfluxDB
- etcd
- Service Discovery with Zookeeper
- Amazon CloudWatch
- Graphite
- Push vs. Pull
- Pull doesn't scale or does it?
- Monitoring Architecture
- Push vs. Pull in Monitoring Systems
- Date modified: