
The Rationale Behind Deep Neural Network Decisions
By: Oladayo Ogunnoiki, Statistics Canada
Introduction
In May 2016, Microsoft introduced Tay to the Twittersphere. Tay was an experimental artificial intelligence (AI) chatbot in "conversational understanding". The more you chatted with Tay, the smarter it would become. However, it didn't take long for the experiment to go awry. Tay was supposed to be engaging people in playful conversation, but this playful banter quickly turned into misogynistic and racist commentary.
Of course, the public was perplexed by this turn of events. If this bot was inherently rude, why wouldn't other AI models also go off course? Most Twitter users felt that this bleak event was only a glimmer of what was to come if our future was indeed rich in AI models. However, most data scientists understood the real reason for Tay's negative commentary – the bot was simply repeating what it had learned from the users themselves (Vincent, 2016).
The world of AI continues to grow exponentially and with stories like this happening all the time, there's a strong need to increase the public's trust in AI products. To gain their trust, transparency and explain-ability is of the utmost importance.
One of the primary questions for anyone interacting with an AI model like Tay, is: "why did the model make that decision?" Multiple tools have been designed to explain the rationale behind these models and answer that question. It may be to no one's surprise that visual explanations are an efficient way of explaining this. In their work, Ramprasaath, et al. (2017) outline the requirements of a good visual explanation– they must be class discriminative and should have a high-resolution. These criteria serve as guidelines for identifying the challenge to be addressed: creating a solution that provides a high resolution and class discriminative visual explanation for decisions of a neural network.
Some of the techniques that provide visual explanations include deconvolution, guided backpropagation, class activation mapping (CAM), Gradient-weighted CAM (Grad-CAM), Grad-CAM++, Hi-Res-CAM, Score-CAM, Ablation-CAM, X-Grad-CAM, Eigen-CAM, Full-Grad, and deep feature factorization. For this article, we'll focus on Grad-CAM.
Grad-CAM is an open-source tool that produces visual explanations for decisions from a large class of convolutional neural networks. It works by highlighting the regions of the image that have the highest influence on the final prediction of the deep neural network, thereby providing insight into the decision-making process of the model.
Grad-CAM is based on CAM which uses the activation of the feature maps with respect to the target class. It's specific to certain types of neural networks, such as the Visual Geometry Group network and residual network (ResNet). It uses the gradient of the target class with respect to the feature maps in the final layer. Grad-CAM is a generic method that can be applied to different types of neural networks. Combining features makes Grad-CAM a reliable and accurate tool for understanding the decision-making process of deep neural networks. Guided Grad-CAM is enhanced by incorporating the gradients of the guided backpropagation process to produce a more refined heatmap. One limitation is that it's only able to visualize the regions of the image that are most important for the final prediction, rather than the entire decision-making process of the deep neural network. This means that it may not provide a complete understanding of how the model is making its predictions.
The advantages of Grad-CAM include:
- No trade off of model complexity and performance for more model transparency.
- It's applicable to a broad range of convolutional neural networks (CNNs).
- It's highly class discriminative.
- Useful for diagnosing failure modes by uncovering biases in datasets.
- Helps untrained users to recognize a stronger network than a weaker one, even when the predictions are identical.
Methodology
Grad-CAM can be used in multiple computer vision projects such as image classification, semantic segmentation, object detection, image captioning, visual question answering, etc. It can be applied on CNNs and has recently been made available on transformer architectures.
Highlighted below is how Grad-CAM works in image classification, where the objective is to discriminate between different classes:
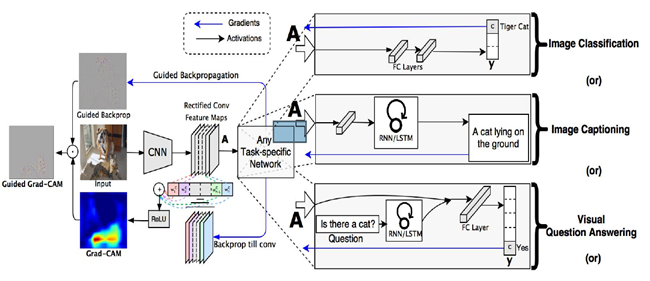
Description - Figure 1The process flow of Gradient-weighted class activation mapping (Grad-CAM)
An image is passed through a CNN and a task specific network to obtain a raw score for the image's class. Next, the gradients are set to zero for all classes except for the desired class, which is set to one. This signal is then backpropagated to the rectified convolutional feature maps of interest, which are combined to compute a blue heatmap that represents where the model needs to look to decide on the class. Finally, the heatmap is pointwise multiplied with guided backpropagation, resulting in guided Grad-CAM visualizations that are high-resolution and concept-specific.
In the case of an image classification task, to obtain the Grad-CAM class-discriminative localization map,
, for a model on a specific class, the steps below are followed:
- For a specific class, c, the partial derivative of the score, , of the class, c, in respect to feature maps, , of a convolutional layer is calculated using backpropagation.
- The gradients flowing back due to backpropagation are pooled via global average pooling. This produces a set of scalars of weights. These are the neuron importance weights.
- The derived scalar weights are applied (linear combination) to the feature map. The result is passed through a Rectified Linear Unit (ReLU) activation function.
- The result is scaled and applied to the image, highlighting the focus of the neural network. As seen, a ReLU activation function is applied to the linear combination of maps, because it's only interested in the pixels or features that have a positive influence on the class score, .
Demonstration of Grad-CAM
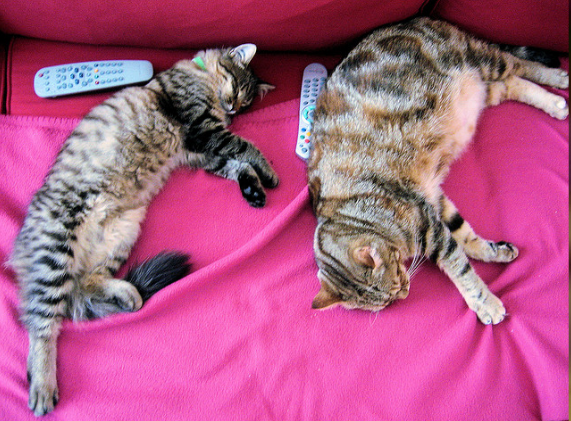
Description - Figure 2A pair of cats and a pair of remote controls
Image consisting of two Egyptian cats lying down on a pink sofa with remote controls on the left-hand side of each cat.
Figure 2 is an image of two Egyptian cats and two remote controls. The image was derived from the Hugging Face's cat image dataset, using their Python library. The objective is to identify the items within the image using different pretrained deep learning models. A PyTorch package called the PyTorch-GradCAM is used. The Grad-CAM feature identifies aspects of the image that activate the feature map of the Egyptian cat class and the remote-control class. After following the PyTorch-GradCAM tutorial, the Grad-CAM results are replicated for different deep neural networks.
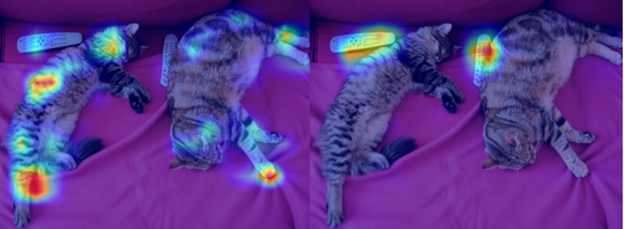
Description - Figure 3Grad-CAM results of a pretrained Resnet-50 architecture to classify the figure 2 image. This image was generated by applying Grad-CAM to figure 2 in a Jupyter Notebook.
Heatmap images generated from a Resnet-50 architecture using Grad-CAM for the Egyptian cat class (left) and Remote-control class (right). The intensity of the red colour shows the regions that contribute the most to the model decision. There are few intense regions for the cat, while the remotes are almost fully captured, but not highly intense.
Figure 2 is parsed through a pretrained residual neural network (Resnet-50) as per the PyTorch-Grad-CAM tutorial. Figure 3 is the image generated using Grad-CAM. For the Egyptian cat class, the leg, stripes, and faces of the cats activated the feature map. For the remote controls, the buttons and profile are what activated the feature map. The top 5k predicted classes in order of logit, are remote control, tiger cat, Egyptian cat, tabby cat, and pillow. This model seems to be more confident the image contains remote controls and cats. Though less confident, the pillow category made the top five of the listed categories. This could be because the model was trained with cat-printed pillows.
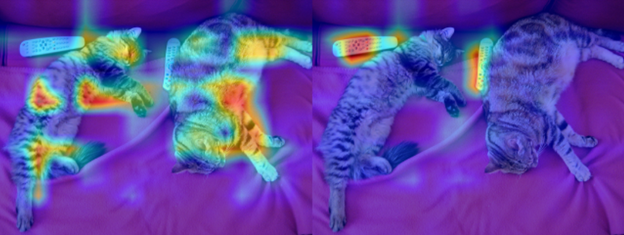
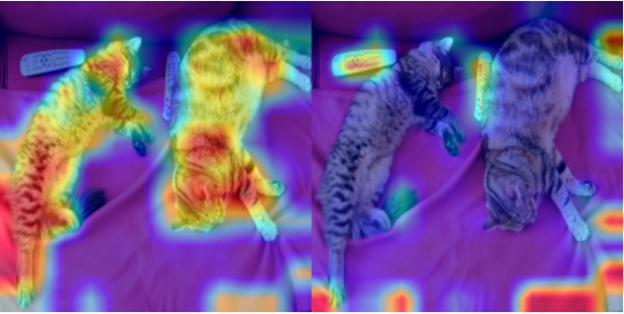
Description - Figure 4Grad-CAM results of a pretrained shifted window transformer to classify figure 2. This image was generated by applying Grad-CAM to figure 2 in a Jupyter Notebook.
Heatmap images generated from a shifted window transformer using Grad-CAM for the Egyptian cat class (left) and remote-control class (right). The intensity of the red colour shows the regions that contribute the most to the model's decision. The cats show more intense regions, while the remote controls are almost fully captured with high-intensity.
Like the Resnet-50 architecture, the same image is parsed through a pretrained shifted window transformer. Figure 4 shows the cats' fur, stripes, faces, and legs as activated regions in the feature map in respect to the Egyptian cat category. The same occurs in relation to the feature map in respect to the remote controls. The top 5k predicted classes, in order of logit, are tabby cat, tiger cat, domestic cat, and Egyptian cat. This model is more confident that cats are in this image than remote controls.
Description - Figure 5Grad-CAM results of a pretrained vision transformer architecture in classifying the image in figure 2 This image was generated by applying Grad-CAM to figure 2 in a Jupyter notebook.
Heatmap images generated from a Vision transformer using Grad-CAM for the Egyptian cat class (left) and remote-control class (right). The intensity of the red colour shows the regions that contribute the most to the model decision. The cats are fully captured in high intensity. The remotes are also captured but not equivalent intensity. In addition, other regions of the images are highlighted despite not being part of either class.
As seen above, more regions of the feature map are activated, including sections of the image that didn't include cat features. The same occurs for regions of the feature map in respect to the remote-control class. The top 5k predicted classes, in order of logit, are Egyptian cat, tiger cat, tabby cat, remote control, and lynx.
The Grad-CAM results with the top 5k categories for different architectures can be used to favour a selection of the vision transformer (VIT) architecture for tasks related to identifying Egyptian cats and remote controls.
Conclusion
Some of the challenges in the field of AI includes increasing the trust of people in the developed models and understanding the rationale behind the decision making of these models during development. Visualizations tools like Grad-CAM provide insight into these rationales and aid in highlighting different failure modes of AI models for specific tasks. It can be used to identify errors in the models and improve their performance. On top of Grad-CAM, there are other visualization tools that have been developed such as Score-CAM, which performs even better in interpreting the decision-making process of deep neural networks. Though Grad-CAM will be selected over Score-CAM due it's simplicity and agnosticism to model architectures. The use of tools such as Grad-CAM, should be encouraged in visually explaining the reason behind the decisions of AI models.
Meet the Data Scientist

If you have any questions about my article or would like to discuss this further, I invite you to Meet the Data Scientist, an event where authors meet the readers, present their topic and discuss their findings.
Thursday, June 15
1:00 to 4:00 p.m. ET
MS Teams – link will be provided to the registrants by email
Register for the Data Science Network's Meet the Data Scientist Presentation. We hope to see you there!
Subscribe to the Data Science Network for the Federal Public Service newsletter to keep up with the latest data science news.
References
- S. R. Ramprasaath, C. Michael, D. Abhishek, V. Ramakrishna, P. Devi and B. Dhruv, "Grad-CAM: Visual Explanations from Deep Networks via Gradient-based Localization," in ICCV, IEEE Computer Society, 2017, pp. 618-626.
- Z. Bolei, K. Aditya, L. Agata, O. Aude and T. Antonio, "Learning Deep Features for Discriminative Localization," CoRR, 2015.
- J. Vincent, "Twitter taught Microsoft's AI chatbot to be racist in less than a day", in The Verge, 2016.
- Date modified: