
Text Classification of Public Service Job Advertisements
By: Dominic Demers and Jessica Lachance, Public Service Commission of Canada
Introduction
The Public Service Commission (PSC) is an independent agency mandated to promote and safeguard a non-partisan, merit based public service that is representative of all Canadians. Among its many responsibilities, the PSC also oversees over 50,000 hiring activities that fall under the Public Service Employment Act (PSEA), each year.
This rich data environment includes over a million resumes and 8,000 job advertisements yearly. Some of the data are structured, like the organization name or the position's group and level. But, most human resource (HR) data collected by the PSC is unstructured. The unstructured data, such as job advertisements or screening questions, can be used for analytical purposes.
The PSC's Data Services and Analysis Division is responsible for data requests, statistical studies, surveys, forecasting models and data visualizations for staffing and recruitment activities that fall under the PSEA.
This article will give an overview of two natural language processing (NLP) techniques used by our team to extract valuable insights from two open-ended fields – Educational Requirements and the Area of Selection variables. We'll also explain how they were subsequently used to feed the Applications Forecasting Tool, a data visualization tool that reports on job advertisements.
Applications Forecasting Tool
In 2019, the PSC developed the Applications Forecasting Tool to help managers and HR advisors within the Government of Canada prepare for selection processes. Users can select the characteristics of a job advertisement and get an estimate on the number of candidates, based on similar jobs that were previously advertised.
The first version of the tool only worked with structured data from the job advertisement. But, the PSC received feedback about two open-ended fields users wanted to use to obtain a better estimate of the number of candidates for their selection process. These fields included the level of education in the essential qualifications; and for internal processes, details about the Area of Selection such as the department, location or classification.
As such, the PSC used text classification techniques for the education and Area of Selection fields to structure the information into categories that fed into the Applications Forecasting Tool. These algorithms enabled more precise and useful reporting capabilities for the PSC.
Text Classification
Text classification is a subset of problems that fall under NLP. The goal of text classification is to take open-ended fields and assign each text a label from a limited set of options.
In our case, we explored two different models to reach our goal. For the education variable, we used a rules-based approach using regular expressions. For the Area of Selection, we used a machine learning based approach called Name-entity-recognition (NER).
Although text classification using any model can produce good results, the capability of the algorithm to extract information from text is not always reliable. As such, we had to evaluate the algorithm's efficacy in extracting the correct information. We evaluated the model using a test dataset and examined metrics to determine how the classifier performed.
Evaluating text classification models
To evaluate the performance of our text classification algorithms, we used a confusion matrix. A confusion matrix is a table that describes the performance of the classification model on a set of test data for which the true values are known.
The number of correct and incorrect predictions are summarized in a table, and include count values. It also summarizes the number of errors made by our classifier and, most importantly, error type.
The confusion matrix is comprised of four types of predicted and actual value combinations. In our text classification context, the algorithm will provide a "true" (or "positive") value when the text is predicted as part of the classification. For example, if the text is classified as "high school diploma" it will return "true" (or "positive") for this classification.
The four categories are described below.
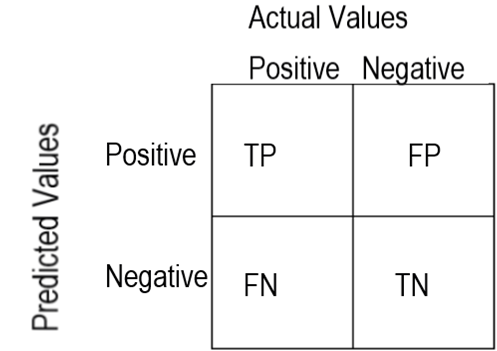
Figure 1: Confusion Matrix
Description - Figure 1: Confusion Matrix
Quadrant diagram with four combinations of predicted and actual values.
Positive Predicted Value + Positive Actual Value = True Positive
Positive Predicted Value + Negative Actual Value = False Positive
Negative Predicted Value + Positive Actual Value = False Negative
Negative Predicted Value + Negative Actual Value = True Negative
The True Positive (TP) Combination: The classification is predicted as true and is correct.
The True Negative (TN) Combination: The classification is predicted as false and is correct.
The False Positive (FP) or Type 1 Error: The classification is predicted as true but is incorrect.
The False Negative (FN) or Type 2 Error: The classification is predicted as false but is incorrect.
Using these combinations, we derived the following performance metrics:
- Accuracy: The percentage of texts that were categorized with the correct classification. Used to determine how many classifications the model got right.
- Precision : The percentage of texts correctly classified out of the total number of texts classified as positive. Used to determine the proportion of positive identification that were correct.
- Recall : The percentage of actual positive values that are predicted correctly. Used to determine the proportion of actual positives that were correctly identified.
- F1 Score: The harmonic mean of precision and recall.
In the context of this article, these statistics will be used to evaluate the performance of classifying two variables – Educational Requirement and the Area of Selection.
Educational Requirement field
In accordance with the PSEA, the Treasury Board Secretariat established Qualification standards for the core public administration by occupation group or classification. The qualification standards give the minimum educational requirements for each occupational group. Job advertisements for positions under the PSEA must include this merit criteria.
Managers generally use the qualification standard as their essential requirement. But they have the ability to set higher educational levels when required. For example, a hiring manager might require that an EC-06 senior policy analyst have a masters degree, even though the minimum requirement is a bachelors degree.
We might expect less candidates that have a masters instead of a bachelors. Parsing the level of education would allow us to give users of the Applications Forecasting Tool more relevant estimates and historical job advertisements.
Method
There are just over 100 qualification standards across all occupational groups which are also written in natural language. We decided that these standards could be summarized as belonging to one of eight education levels:
- Some high school
- High school
- Some post-secondary
- Post-secondary
- Professional degree (e.g. Law degree, medical degree)
- Master's degree
- Ph.D. or above
- Education unknown/not listed
To label the job advertisements according to education level, we used regular expressions to find key phrases and then apply the label. Regular expressions are a sequence of characters that specify a pattern in text. To analyze the education level we:
- found key phrases, using regular expressions, which signal a type of education
- mapped these phrases to a common level
- labeled the education requirements text with one of these common levels
In total, we used 30 different rules to map the job descriptions to the eight education levels. These rules were created manually, using an iterative process. We started with regular expressions that capture the sentence structure and key phrases used in many qualification standards. Then, we added additional rules to capture cases which did not follow the qualification standards.
Here's a visual representation of what this looks like:
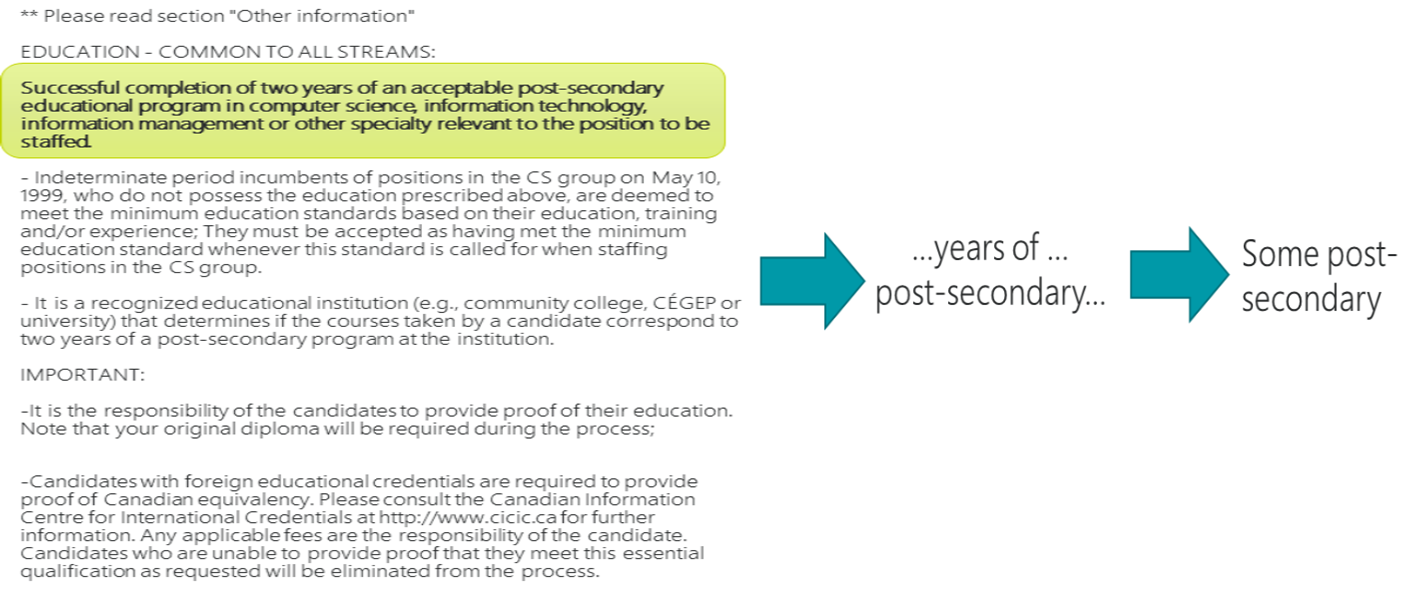
Figure 2: Educational requirement classification
Description - Figure 2: Educational requirement classification
**Please read section *Other information*
EDUCATION – COMMON TO ALL STREAMS
Successful completion of two years of an acceptable post-secondary educational program in computer science, information technology, information management or other specialty relevant to the position to be staffed.
-Indeterminate period incumbents of positions in the CS group on May 10, 1999, who do not possess the education prescribed above, are deemed to meet the minimum education standards based on their education, training and/or experience; They must be accepted as having met the minimum education standard whenever this standard is called for when staffing positions in the CS group.
-It is a recognized educational institution (e.g., community college, CÉGEP or university) that determines if the courses taken by a candidate correspond to two years of a post-secondary program at the institution.
IMPORTANT:
-It is the responsibility of the candidates to provide proof od their education. Note that your original diploma will be required during the process;
-Candidates with foreign educational credentials are required to provide proof of Canada equivalency. Please consult the Canadian Information Centre for International Credentials for further information. Any applicable fees are the responsibility of the candidate. Candidates who are unable to provide proof that they meet this essential qualification as requested will be eliminated from the process.
…years of post-secondary…
Some post-secondary
In this image, the first section represents our input. The segment highlighted in green states the relevant portion of the text related to the educational requirement. "Successful completion of two year of an acceptable post-secondary educational program in computer science, information technology, information management or other speciality relevant to the position to be staffed".
Then the second block represents the rule which was applied to the text using regular expressions. The text was flagged containing the phrase "… years of … post-secondary".
This flag, and the absence of a flag from a higher qualification (e.g. "degree", "doctorate") means this job advertisement was labelled as having the level of education as "Some post-secondary".
Model evaluation
To evaluate the model, we extracted a sample of 1,000 advertisements from the 2019-2020 Fiscal Year and manually labelled the level of education. The table below presents the precision, recall and f1-score of our rules-based algorithm, for each of the eight levels of education.
| Sample size | Precision | Recall | F1-score | |
|---|---|---|---|---|
| Education level unknown/not listed | 45 | 97.7% | 95.6% | 96.6% |
| Some high school | 30 | 100.0% | 100.0% | 100.0% |
| High school | 418 | 99.3% | 98.3% | 98.8% |
| Some post-secondary | 72 | 94.4% | 94.4% | 94.4% |
| Post-secondary | 391 | 96.0% | 97.7% | 96.8% |
| Professional degree | 17 | 100.0% | 88.2% | 93.8% |
| Master's degree | 17 | 83.3% | 88.2% | 85.7% |
| Ph. D or above | 10 | 100.0% | 90.0% | 94.7% |
Results
We applied the algorithm to a total of 18,055 job advertisements between April 1, 2016 and March 31, 2019. The following table provides a breakdown of the EX-01 job advertisements, by the level of education derived from the algorithm. As shown below, the vast majority require either a high school education or a post-secondary education.
| Educational Requirement | Number of Job Advertisements | % Total |
|---|---|---|
| Post-secondary | 676 | 83% |
| Master's degree | 81 | 10% |
| Some post-secondary | 27 | 3% |
| Education level unknown/not listed | 16 | 2% |
| High school | 13 | 2% |
| Professional degree | 2 | 0% |
| Total | 815 | 100% |
Using this methodology, when accessing the AFT to estimate the number of job applications, users can filter results on this new education field. For instance, since April 1, 2015, 921 EX-01 jobs were advertised with a median of 30 applicants. Out of those advertisements, 806 required a post-secondary degree and had a median of 32 applicants.
Area of Selection field section
Background
In accordance with PSEA article 34 (1), for the purpose of eligibility in an appointment process, an organisation may limit the Area of Selection for internal job processes by establishing geographic, organizational, or occupational criteria. This restriction is written in the "Who can apply" field of a job advertisement.
Having a restricted Area of Selection will reduce the pool of potential applicants. Users of the Applications Forecasting tool wanted to know how many applicants they could expect if they only limited their Area of Selection to at-level employees in their department, as oppose to all public servants in Canada.
Method
Our objective was to parse the Area of Selection field to extract the department(s), location(s), and level(s) mentioned by using a technique called name-entity recognition (NER). An NER model is an NLP technique that identifies “entities” in a block of text, such as proper nouns (a person’s name, a country) or category of things (animals, vehicles).
In our case, the entities extracted are
- organizations (e.g. “Transport Canada”, “the Federal Public Service”),
- locations (e.g. “Canada”, “Atlantic Region”, “a 40 km radius of Winnipeg, MB”)
- occupation classifications (e.g. “EC-04”, “EX-01”)
To apply the NER model we used spaCy, a free, open-source library used for advanced NLP in Python.
SpaCy's NER algorithm includes the entities “ORG” (organization), “LOC” (location) and “GPE” (Geopolitical).
To reduce the amount of manual tagging, we took an iterative approach to building our training set. First, we used SpaCy's default algorithm to tag a random sample of 1000 Area of Selections. Then, we made the following changes:
- Merged the “LOC” and “GPE” tags into one “LOC” tag
- Added a “LEVEL” tag which identifies occupational classifications
- Corrected any other issues with the “ORG” and “LOC” tags
Building off this, we created an additional 200 training examples, which were targeted to include additional examples of the “LEVEL” tag, and other cases the initial algorithm consistently failed to identify.
With the training set ready, the SpaCy NER algorithm performs the following tasks:
- Creates a prediction model using a portion of the labeled training data
- Sends an unlabeled version of another portion of the training data to model and predicts the entities
- Compares predicted labels to true labels
- Updates model to account for incorrect labels. The amount of change between models is called the gradient.
- Repeat until gradient is small and model predictions change very little between iterations
This process resulted in a final model that can identify the different criteria in an Area of Selection. The following image illustrates an example of the tagging the model performed:
Figure 3: Area of Selection classification

Description - Figure 3: Area of Selection classification
Employees of the public service at the PM-04 or an equivalent classification who occupy a position within 40km of Edmonton, Alberta. Employees of the public service ORG at the PM-04 LEVEL or an equivalent classification who occupy a position within 40km of Edmonton, Alberta LOC.
At the top of the image, we have the complete text of the Area of Selection, then at the bottom of the image, we have our three “entities” highlighted. “the public service” is labelled as ORG, “PM-04” is labelled as LEVEL and “within 40km of Edmonton, Alberta” is labelled “LOC”
Model evaluation
We evaluated the model using a random sample of 465 Area of Selection statements which we manually labeled. The following table shows the precision and recall scores for each entity typeFootnote 1
| Entity tag | Precision | Recall | F1-score |
|---|---|---|---|
| ORG | 92.6% | 90.8% | 91.7% |
| LOC | 80.2% | 74.9% | 77.5% |
| LEVEL | 95.0% | 76.0% | 84.4% |
Results
Using the results of the model, we produced the following exploratory analysis. This analysis is based on of 13,362 internal job postings between April 1, 2016 and March 31, 2019.
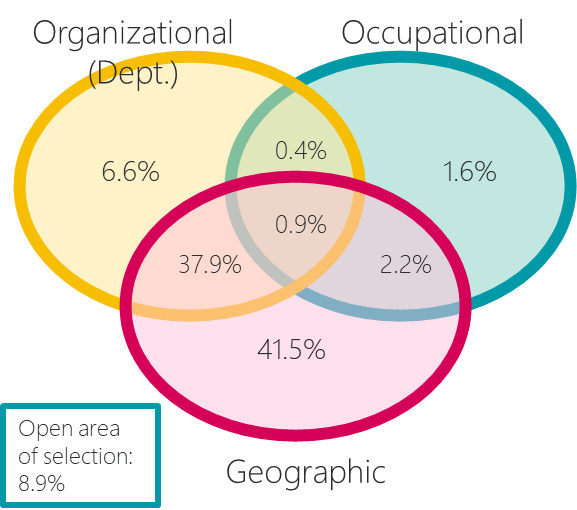
Figure 4: Venn diagram of Area of Selection field, by organization, occupational group and geography
Description - Figure 4: Venn diagram of Area of Selection field, by organization, occupational group and geography
Venn diagram of an Area of Selection field split into three.
| Organizational (Dep't.) = 6.6% | Organizational & Occupational share 0.4% |
| Occupational = 1.6% | Occupational & Geographic share 2.2% |
| Geographic = 41.5% | Geographic & Organizational share 37.9% |
| All three share 0.9% | Open area of selection = 8.9% |
What we found is that most internal advertisements chose to use at least one of the filters outlined in the PSEA and that most of the areas of selection with a geographic filter were for “Persons employed by the Public Service occupying a position in the National Capital Region (NCR)”.
However, we realized that some areas of selection proved to be harder to parse. These included:
1) Employees of Transport Canada who occupy a position in Calgary, Edmonton, Saskatoon, Winnipeg, Whitehorse, Yellowknife or Churchill.
2) Should an insufficient number of applicants be identified, persons employed in the Public Service, who occupy a position within 40km of Winnipeg, Manitoba or within 40km of Edmonton or Calgary, Alberta may be considered without re-advertising. Therefore, applicants in this expanded area of selection are encouraged to apply.
Our model performed well, but due to multi-criteria areas, we decided to use our analysis with a broader set of categories. Previously in the Applications Forecasting Tool, users could only select “internal job advertisement” or “external job advertisement”. Now, users have more precision for internal job advertisements. They can select:
- Internal job advertisements, open to all public servants
- Internal job advertisements, open to public servants in the NCR
- Internal job advertisement, other areas of selection
This addition improved our model and allowed users to search a narrower set of advertisements to find any that matched their intended selection process.
Conclusion
Open-ended fields are a valuable way of collecting information and shouldn't be excluded from forms or surveys. It allows for a catch-all response when questions don't allow for users to give information within a fixed set of choices.
But this flexibility will come at the cost of accuracy of the classifications. Classification systems can generate the right predictions (true positives and true negatives), but can also make the wrong ones (false positives, false negatives). Cross validating the performance of your algorithm will be essential in determining if the classifications are sufficiently accurate for your reporting purposes.
This article showed methods to structure information from open-ended fields for reporting purposes in the Application Forecasting Tool. The categories derived from the area of selection and level of education fields were used to populate to drop-down menus allowing users to fine-tune their search results.
You're encouraged to visit the Application Forecasting Tool, or our other data visualization tools on the PSC's Data Visualization Hub.

If you have any questions about this article or would like to discuss this further, we invite you to our new Meet the Data Scientist presentation series where the author will be presenting this topic to DSN readers and members.
Tuesday, October 18
2:00 to 3:00 p.m. EDT
MS Teams – link will be provided to the registrants by email
Register for the Data Science Network's Meet the Data Scientist Presentation. We hope to see you there!
- Date modified: