
Writing a Satellite Imaging Pipeline, Twice: A Success Story
By: Blair Drummond, Statistics Canada
Statistics Canada is modernizing agriculture data collection by using satellite imagery to predict crop growth. The data scientists were faced with a series of challenges throughout this project, including the seemingly prohibitive expense of scaling the project to production requirements (despite promising initial results). They rose to the occasion by considering all options, including non-obvious ones, and experienced first-hand the value in having a diversely skilled team.
A team of Statistics Canada data scientists, working with experts from the agency's agriculture program, created a successful machine-learning proof-of-concept. They implemented a neural network which achieved 95% accuracy in predicting what crop was growing in a quarter-section (160 acre lot), using freely available satellite imagery. This represented a great opportunity for StatCan's Agriculture program, because the use of satellite imagery offers a way to get mid-season estimates, or even near real-time estimates, and the new approach helps to reduce the response burden for agricultural operators who were required to fill out surveys regularly.
But there was just one problem. The implementation produced by the proof-of-concept had a preprocessing step that extracted pixel data from the Landsat 8 satellite images and applied some transformations. On a single image, this process took approximately one day to complete, used over a 100 gigabytes of RAM, and the cost was estimated at $50 per image on a basic cloud desktop Virtual Machine (VM). The training set consisted of seven years and three provinces worth of data, or around 1,600 images total. If everything worked the first time using available public cloud infrastructure, the project would cost $80,000, before even getting to the step of training the model.
This cost would have been prohibitive for this project, which was still in the experimentation phase. It was not clear if the model would work well on a larger scale than this experiment, and the cost to develop a new model had this substantial hurdle in front of it. The data scientists were fairly confident that they could find a model that would work, but they had to make it more economical. Unphased, they set out on a small proof-of-concept to see if they could get over this hurdle and make the preprocessing steps economically viable.
The proof-of-concept: the first three pipelines
When the data scientists started the pipeline experiment for this project in the fall of 2019, the cloud was still relatively new to them, Data Analytics as a Service (DAaaS) was a young project, and the team was familiarizing themselves with what was newly available. The proof-of-concept was certainly aimed at solving a particular problem, but it was also a division-wide experiment to figure out how to navigate the cloud. For that reason, they took this on as a joint project with the DAaaS team and cloud solution architects. The aim was to get experience with a range of different technologies, including:
The Azure Batch and Azure Machine Learning solutions were to be implemented by a team who had expertise in those, in close collaboration with the Data Science Division (DScD). The DScD worked also with the DAaaS team to see what the DAaaS platform could offer. Each team was handed the same set of code and a couple of test images, and over the span of four months they worked to implement their solutions.
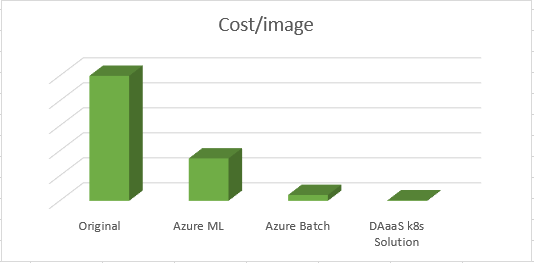
At the end of the implementation period, each approach was analyzed to produce cost-estimates for the processing of a single image (Figure 1).
The pipelines ran on different VM types chosen by the architect. The Azure solutions used low-priority instances, and the Kubernetes solution pricing is based on three-year reserved pricing (which is more expensive than low-priority). The real question became: why such huge differences in cost?
Comparing apples and oranges
The difference was the code. While each team received the same code at the start with the objective of parallelizing it, the Azure Machine Learning and Azure Batch solutions encouraged slightly different approaches to that parallelization. The small changes to the code led to significant differences in outcome. This was not really about the pipeline technology itself; all things being equal the performance would have been comparable, but one implementation bypassed a serious performance issue whereas another did not touch that part of the code.
For example, one of the issues with the original implementation was the way that it parallelized processing of an image. In its original form, it split up what needed to be extracted from the image into 30 groups and then it created 30 parallel processes, each handling a share of the image. On the surface, this was a great idea; but unfortunately there was a complexity. The extraction algorithm needed to load a large geographic data file into memory, as well as the image itself, which combined to about 3 GB of RAM. This would be fine for one process, but since the processes do not share memory, doing this across 30 processes in parallel ballooned the RAM usage to 90 GB. In addition, all processes wrote many small files to disk in the extraction process, and the parallel disk writes slowed down the program substantially. This first implementation used a large number of resources, and took longer than it should have because it was stuck writing data to disk.
This was one area where Azure Machine Learning and Azure Batch diverged. The Azure Batch solution made it convenient to parallelize at the level of those groups within the image to extract, and so those processes were split up across different machines. The RAM was much more manageable, and the processes did not compete while writing to the disk. It was less natural to do this in Azure Machine Learning, and so by no fault of its own, it appeared to have much worse performance.
In contrast, on the DAaaS / Kubernetes implementation, the data scientists carefully read through, rewrote and re-architected components, and, before even touching the pipeline, had an extraction process which:
- Used 6 GB of RAM per image, not 100 GB
- Ran in under 40 minutes, not several hours
- Used 6 CPUs, not 30+
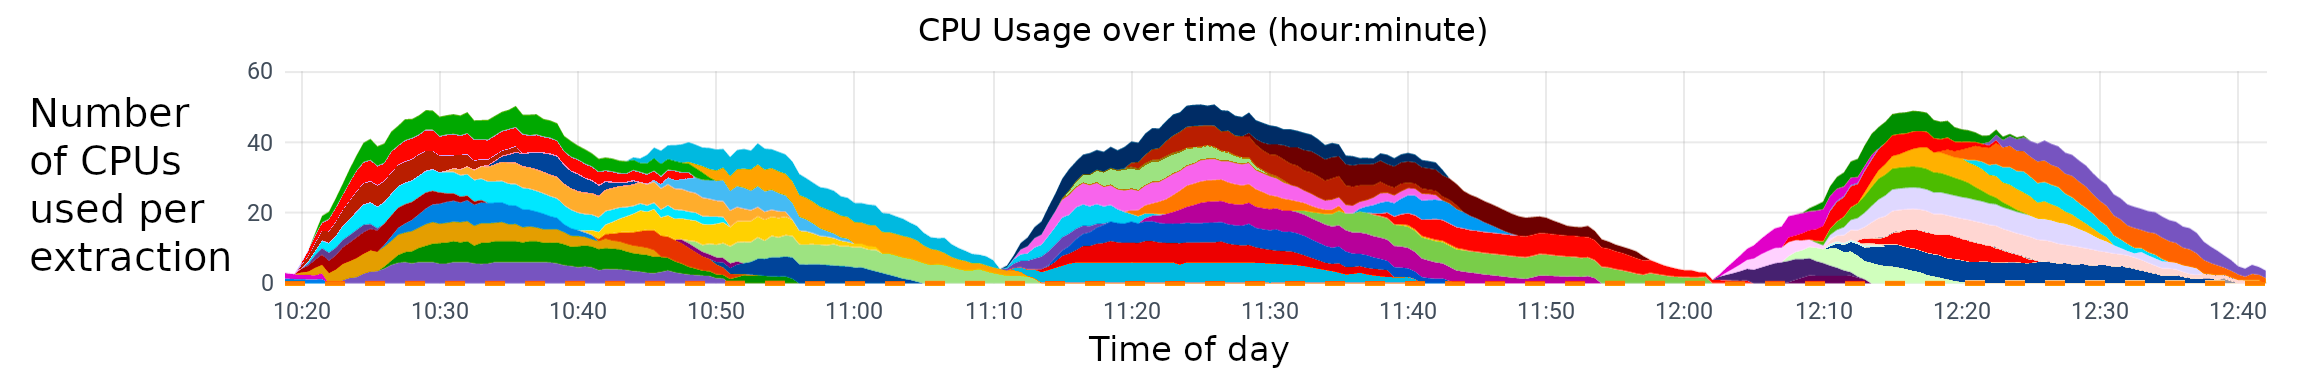
Description for Figure 2 - CPU usage over time
The processing of three batches of fifteen images each, 45 images in total. Each colour is one image being extracted and the CPU usage over time.
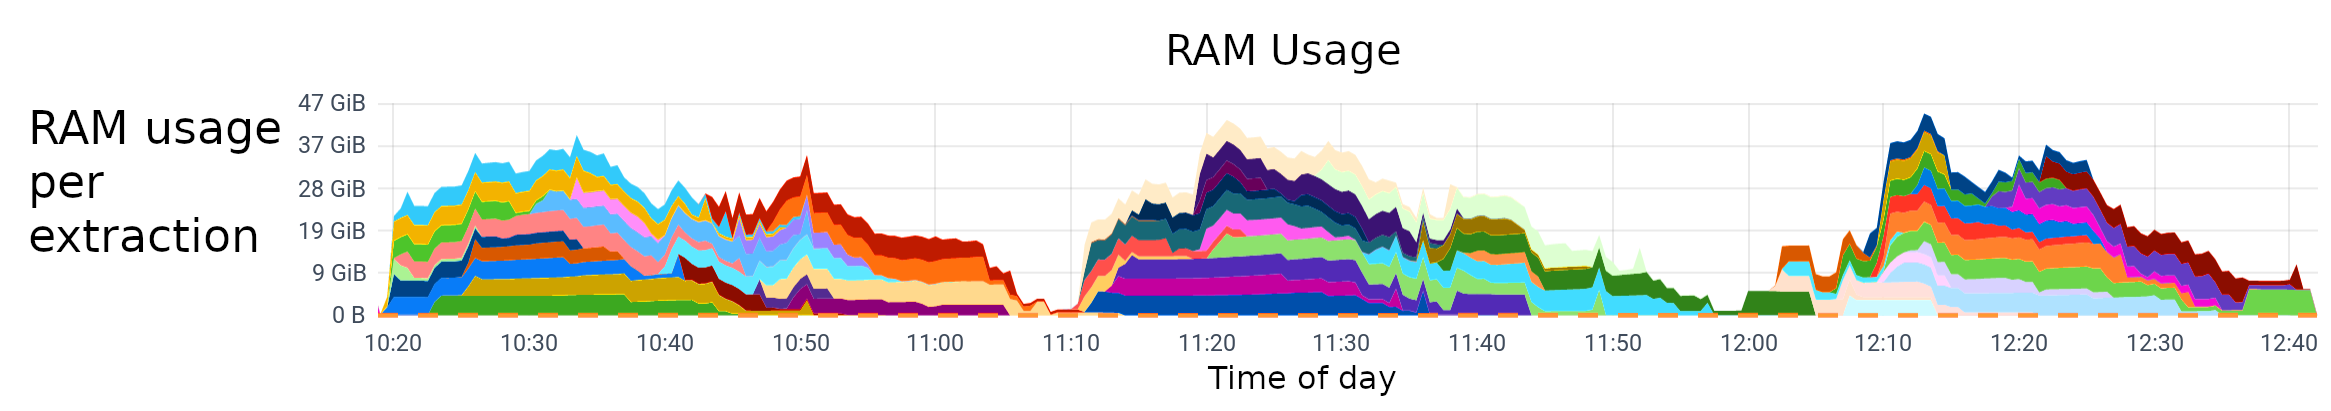
Description for Figure 3 - RAM usage
The processing of three batches of fifteen images each, 45 images in total. Each colour is one image being extracted and the RAM usage over time.
Before even getting to the pipeline, the problem was reduced from one that required large clusters to one that would run on a mid-tier laptop. Since the pipeline no longer needed to constrain its imagination to making one image economical, it was possible to move on to the stage of making the processing of a season's worth of images simple, manageable and automated.
How do we know this now? Why was this not noticed?
The team focused on the Azure Batch and Azure Machine Learning solutions did not have the benefit of a mandate that included redesigning code. They were explicitly not supposed to be modifying the code, as that would have potential methodological impacts, and has little to do with the Cloud solutions or proofs-of-technology. It simply did not fall under their purview.
On the other hand, the DScD team had just hired someone specifically to invest in their data engineering capacity, so in addition to working on a proof-of-technology with DAaaS, the team was also undergoing an effort to develop more expertise in this area. The data engineer undertook a thorough code-review, and had the benefit of having the original author of the code in-house to answer questions. They simply had more freedom to solve the problem in a range of ways by having resources in-house, which led to more efficient outcomes as well as new insights.
It is important to note that without this analysis and review of the code, not only would they not have had this new solution, but they also would not have known why the two Azure solutions had such performance differences! It was only clear after review what caused the differences between the three solutions.
Lessons learned
The team did not compare apples with apples in this situation, and it was a far more informative experience as a result. What they inadvertently compared was really
- what happens when you try to Lift-and-Shift an existing application?
with
- what can you achieve with an analysis on the existing application?
The former is basically a platform/infrastructure question, and the latter is an engineering/application question. What was uncovered in this proof-of-concept was that while the platform is a necessary context, without which this exercise would have been impossible, the real value was delivered by the core engineeringFootnote 1, and it was the work invested in the application itself that differentiated the outcomes.
The team was wiser for the experience and learned about where to focus their expertise. Because of this project, and similar experiences, they were able to make strategic decisions in the division about how and where to grow capacity. In the year since the experiment, the DScD's efforts to boost data engineering skills across the division has paid dividends on many projects.
Choosing a pipeline technology and what went wrong the first time
In the previous section it was demonstrated that the underlying pipeline technology was not really what affected the efficiency or cost. So what drove the decisions? And what mistakes were made the first time?
As alluded to earlier, the DScD's business value is in developing models and applications, not in provisioning or maintaining infrastructure. In addition, the division is only a small part of a much larger organization, and it is important that they keep their technology strategy aligned with the organization and leverage the horizontal services offered by solutions like DAaaS.
For the DScD, it was an easy decision. Aligning with and working with DAaaS enables the DScD's work by letting them focus on the things that bring business value to clients, and working with the DAaaS platform helps the DAaaS team build up a robust and flexible platform that meets customer needs—for the DScD, for Statistics Canada, for external partners and ultimately, for Canadians.
Going with the DAaaS / Kubernetes solution was obvious in the end. They implemented a fully automated pipeline which queried the United States Geological Survey Application Programming Interface for the images, downloaded and processed them, and did all of this automatically and in a version-controlled and artifact-driven way. The team had a successful close-out and the team and the clients were very happy with this solution.
Unfortunately, the pipeline ran on a specific piece of pipeline software, and about a month later, that software was moved to a new licensing model that caused a rethink of its use. It was found that continued use of the software was impossible (as purchasing the software was not deemed a viable option). As a result, the rewrite was inevitable anyway.
The rewrite and the benefit of hindsight
In many ways, the rewrite gave the team a chance to revisit and simplify the original implementation. The first pipeline had many small components which each tackled one function, and then the pipeline code orchestrated them.
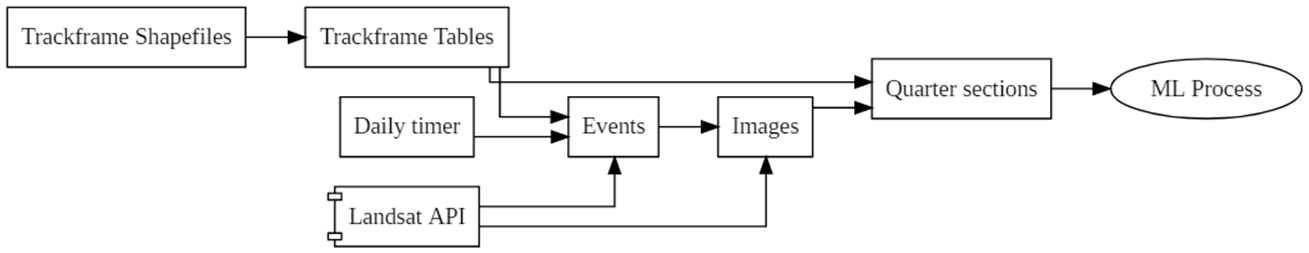
Description for Figure 4 - The original pipeline
The breakdown of each component in the original pipeline and how they flowed into each other:
A flow chart with the following labelled boxes: Trackframe Shapefiles > Trackframe Tables > Quarter Sections > ML process, Daily timer > Events > Images, Landsat API.
In the revised pipeline, using Kubeflow Pipelines, the complexity was shifted out of the pipeline orchestration and into the application code itself.
While this sounds counter-intuitive, the reality is that the pipeline is no more or less complicated whether the logic is encoded into the ‘components' of the pipeline, or in the fabric which stitches them together. The difference is more people know regular Python or R than they know pipeline orchestration code, so it is simpler and more maintainable (for projects like this) to not be over-zealous with the pipeline code. As a result, from the Kubeflow Pipelines side, the pipeline looks like this:
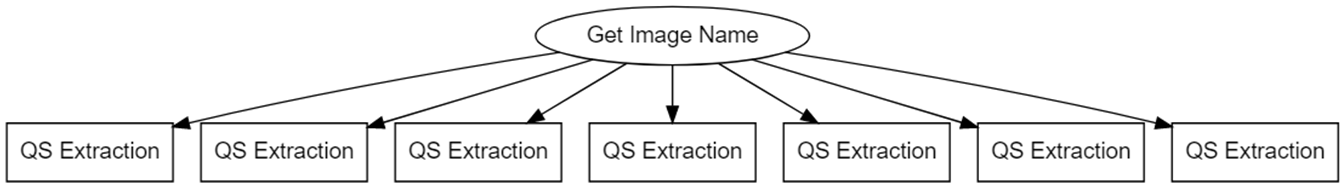
Description for Figure 5 - The Kubeflow pipeline
The updated pipeline combines many of the original components into a single process to identify images of interest, then Kubeflow creates parallel processes to handle each one.
A circle labelled "Get Image Name" points toward seven boxes labelled "QS Extraction."
It simply gets the list of images that it needs to process that day, fans out in parallel across the Kubernetes cluster, and extracts each image separately. The component itself is encapsulated in a Docker image, which keeps the component portable and makes it easy to test and deploy. The pipeline orchestration code is about 20 lines of Python.
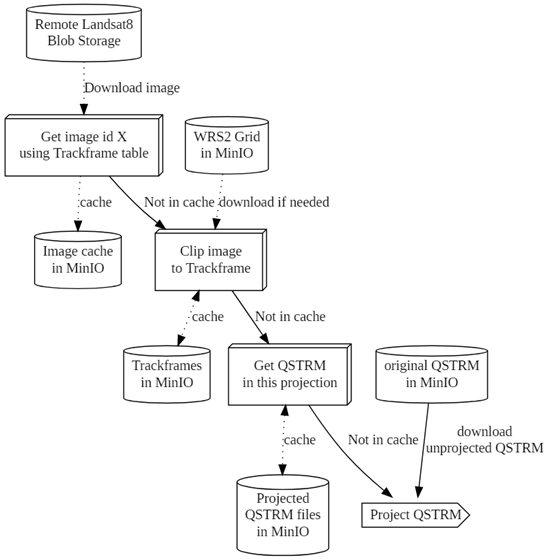
Description for Figure 6 - The Pipeline
A flow chart with the following labelled boxes: Remote Landsat 8 Blob Storage > Download image > Get image id X using Trackframe table > cache > Image cache in MinIO
WRS2 Grid in MinIO > Not in cache download if needed > Clip image to Trackframe > cache > Trackframes in MinIO
Not in cache > Get QSTRM in this projection > cache > Projected QSTRM files in MinIO
Original QSTRM in MinIO > Not in cache / download unprojected QSTRM > Project QSTRM
The data flow within the extractor is still a little complicated, but it is easily and efficiently managed within the extractor, using an S3 Bucket (implemented by MinIO) as a storage location and cache.
The team was happy with the result, and successfully processed 1,600 images without issue.
The end?
This is not actually the end of the story as the last chapter has yet to be written. With the new pipeline, the project will be expanded and transitioned to production, and soon the team will begin training the new model.
We look forward to sharing our developments in future articles as the project moves ahead. Who knows, you might get the chance to read about a fancy new neural network that can figure out what is growing from space!
- Date modified: