

Table of contents
Table of contents
Revision History
| Date | Version | Description | Author |
|---|---|---|---|
| December 2017 | 1.0 | User Guide | Dissemination Division |
| April 2018 | 1.1 | Edits | Dissemination Division |
| April 2022 | 2.0 | Updated Guide | Dissemination Division/Census |
Purpose
The purpose of this document is to provide users with a guide to the full table downloadable output files available from the Statistics Canada website.
Objectives/Requirements
The general requirements for the full table download are
- Users can access and download an entire updated data table in CSV (.csv) format from Statistics Canada's website, via a download options button.
- Updated data is available at 8:30am on release day
- Users receive all data and relevant metadata.
General Information
- Download files are unilingual; there is a separate English and French version for each table.
- Previously used CANSIM table numbers have been replaced by numeric Product Identification codes, called PIDs. Each table has a unique PID.
- English downloads are in CSV format and use commas as the separator. French downloads are also in CSV format but use semi-colons as the separator. This is by design to accommodate the decimal display standard in French, which uses a comma (,) instead of the period (.) used in English.
- Data is 'bundled' in a .zip format containing 2 .csv files; a data file containing both data and textual 'stub' information, and a corresponding metadata file. Users receive both on download.
- The .zip filename has the format 'PID-eng.zip' in English and 'PID-fra.zip' in French. The filenames for the data and metadata files have the structures "PID.csv and PID_Metadata.csv', in both English and French.
- Some information (i.e. dimension names, member names) appears in both the data and metadata file. This redundancy is by design. It accommodates the advanced user who requires the ability to sort and filter on the data, and it also allows the novice user to understand the information being presented through the presence of basic descriptions.
- For 2021 Census cubes (98-XXXX-XX) there have been changes introduced in both the metadata and data files, which makes the record layouts for both files different than non-Census cubes. These differences have been described in this document.
Data File (non-Census cubes)
- A Statistics Canada data table contains a minimum of 1 dimension (variable) and a maximum of 10. A standard record layout for the .csv data output file includes a minimum of 14 fields, and always includes a geography dimension. These fields are listed below and described in the record layout section of this document
- REF_DATE
- GEO
- DGUID
- UOM
- UOM_ID
- SCALAR_FACTOR
- SCALAR_ID
- VECTOR
- COORDINATE
- VALUE
- STATUS
- SYMBOL
- TERMINATED
- DECIMALS
- The number of fields in the data output file varies based on the complexity of the table. For example, a table with 6 dimensions contains at least 4 more fields in the output file as compared to a table with only 2 dimensions.
- The sort order within the data files has been modified from previous .csv outputs. Data will now be sorted by ref_date in ascending order.
- For data points requiring decimal representation, the value in the data file has the decimal applied. However, by design, an additional separate, specific decimal precision field is also included in the file in order to explicitly identify the decimal precision for each data point.
- The scalar factor description and scalar identification (ID) fields are paired together and are systematically included in the data output file.
- The unit of measure description and unit of measure identification (ID) fields are paired together and are systematically included in the data output file.
- Where symbols are used to replace data on the web (i.e. F and X), these same symbols appear in designated status fields in the downloadable file. When such symbols appear in the status field, the corresponding value field will remain blank.
Data File Record Layout (non-Census cubes)
Ref_date
Reference period for the series being released. Spanned reference periods (2011/12) will be displayed in the same format as on the website.
Dimension name
Name of dimension. There can be up to 10 dimensions in a data table.
(i.e. Geography)DGUID
Dissemination Geography Unique Identifier - DGUID.
It is an alphanumeric code, composed of four components. It varies from 10 to 20 characters in length. The first 9 characters are fixed in composition and length.
Vintage (4) + Type (1) + Schema (4) + Geographic Unique Identifier (2-11) :
VVVV T SSSS GGGGGGGGGGGUnit of measure
The unit of measure applied to a member given in text. There can be multiple units of measure in a table. See Appendix B.
(i.e. acres, hectares)Unit of measure ID
The unique reference code associated with a particular unit of measure. See Appendix B.
(i.e. 28 = acres)Scalar factor
The scalar factor associated with a data series, displayed as text. There can be multiple scalar factors in a table. See Appendix C.
(i.e. hundreds)Scalar_ID
The unique numeric reference code associated with a particular scalar factor. See Appendix C.
(i.e. 2 = hundreds)Vector
Unique variable length reference code time-series identifier, consisting of the letter 'V', followed by up to 10 digits. (i.e. V1234567890, V1, etc.)
Coordinate
Concatenation of the member ID values for each dimension.
One value per dimension.
Maximum of 10 dimensions.
(i.e. 1.1.1.36.1)Value
Data point value (the decimal is applied to the value where applicable)
(i.e. 12397.13)Status
Shows various states of a data value using symbols. These symbols are described in the symbol legend and notes contained in the metadata file. Some symbols accompany a data value while others replace a data value. i.e. – A, B, C, D, E, F,.., X, 0s
Standard table symbolsSymbol
Describes data points that are preliminary or revised, displayed using the symbols p and r. These symbols accompany a data value.
Terminated (where applicable)
Describes a data value that has been terminated (no longer updated) by Statistics Canada. Termination of a data point is displayed using the symbol t.
Decimals
This field displays the decimal precision for a given value.
Metadata File (non-Census cubes)
- The archived status of a file is indicated in the metadata file. The options for this field are
- ARCHIVED - a table publicly available but no longer being updated
- CURRENT - a table available to the public and that is still being updated
- A comprehensive symbol legend describing the symbols is presented in the metadata file, regardless of whether a selected symbol appears in a particular table.
- Data quality symbols A through D found in the data file are described in a note at the bottom of the metadata file.
- Notes and their unique reference numbers appear in the metadata file.
- Notes can be applied at the table, dimension, and member level.
- If a table undergoes a correction, the correction is recorded in the in the metadata file in three fields; correction ID, correction date, and correction note.
Metadata File Record Layout (non-Census cubes)
*please note that the word "cube" is used interchangeably with the word 'table'
Cube Title
The title of the table. The output files are unilingual and thus will contain either the English or French title.
Product Id (PID)
The unique 8 digit product identifier for the table.
CANSIM Id
The ID number which formally identified the table in CANSIM. (where applicable)
URL
The URL for the representative (default) view of a given data table.
Cube Notes
Each note is assigned a unique number. This field indicates which notes, if any, are applied to the entire table.
Archive Status
Describes the status of a table as either 'Current' or 'Archived'. Archived tables are those that are no longer updated.
Frequency
Frequency of the table.
(i.e. annual)
See Appendix A.Start Reference Period
The starting reference period for the table.
End Reference Period
The end reference period for the table.
Total Number of Dimensions
The total number of dimensions contained in the table.
Dimension Name
The name of a dimension in a table. There can be up to 10 dimensions in a table.
(i.e. – Geography)Dimension ID
The reference code assigned to a dimension in a table. A unique reference Dimension ID code is assigned to each dimension in a table.
Dimension Notes
Each note is assigned a unique number. This field indicates which notes are applied to a particular dimension.
Dimension Definitions
Reserved for future development.
Member Name
The textual description of the members in a dimension.
(i.e. – Nova Scotia, Ontario (members of the Geography dimension))Member ID
The code assigned to a member of a dimension. There is a unique ID for each member within a dimension. These IDs are used to create the coordinate field in the data file. (see the 'coordinate' field in the data record layout).
Classification (where applicable)
Classification code for a member.
Definitions, data sources and methodsParent Member ID
The code used to display the hierarchical relationship between members in a dimension.
(i.e. – The member Ontario (5) is a child of the member Canada (1) in the dimension 'Geography')Terminated
Indicates whether a member has been terminated or not. Terminated members are those that are no longer updated.
Member Notes
Each note is assigned a unique number. This field indicates which notes are applied to each member.
Member definitions
Reserved for future development.
Symbol Legend
The symbol legend provides descriptions of the various symbols which can appear in a table. This field describes a comprehensive list of all possible symbols, regardless of whether a selected symbol appears in a particular table.
Standard table symbolsSurvey Code
The unique code associated with a survey or program from which the data in the table is derived. Data displayed in one table may be derived from one or multiple surveys or programs.
Survey Name
The name of the survey (s)/program. Data displayed in one table may derived from one or multiple surveys or programs.
Subject Code
The unique 2 digit ID associated with the subject or subjects for which the table is associated. The code can be from 2 to 6 digits depending on where the table has been tagged in the subject hierarchy.
Subject Name
The descriptive text of the subject (s) for which a table is associated. This text will show the hierarchal relationship between subjects if such a relationship exists.
(i.e. Health/Diabetes)Note ID
The code assigned to a particular note in a table.
Note
The actual textual note which can contain information at the table, dimension, and members levels. These notes are linked using the table notes, dimension notes, and member notes fields.
Definitions
Reserved for future development.
Correction ID
The code assigned to a correction.
Correction date
The date of a correction.
Correction note
The description of a correction that has taken place on a table.
Data File (Census of Population cubes: 98-XXXX-XX)
Transposition
The primary difference in the layout of the data file for Census of Population cubes and non-Census cubes is the 'transposing 'of the data that has been applied. This has been done to reduce the size and maximize the usability of the data file. Simply put, for 2021 Census of Population files, the last dimension in a cube is transposed so that the data points appear vertically (in columns when viewing the file in Excel). This differs from non-Census cubes, which have one datapoint per row.
2021 Census of Population files are transposed by moving the last dimension of a cube and its associated members into columns. The headers for these data columns will express the total number of members in a dimension as well as the specific member, including the applicable coordinate value, within that dimension which the column represents. A user can determine the last dimension in a cube by viewing its metadata file.
98-10-0001 metadata file (this image does not represent the entire file)

To illustrate, see the full table download .csv data file for cube 98-10-0001 (2021 Census of Population). In this image, you can see that the last dimension, in this case 'Population and dwelling counts', has been transposed into columns.
98-10-0001 data file (this image does not represent the entire file)
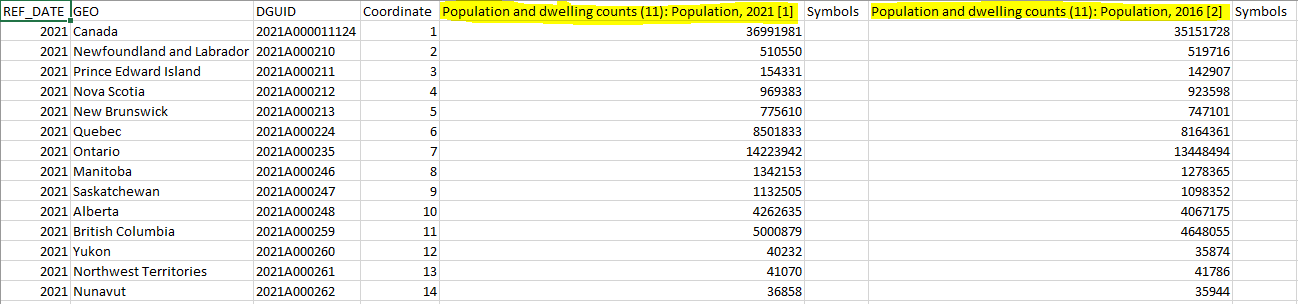
The headings of each column are now structured in the following manner. Population and dwelling counts (11): Population, 2021 [1] where;
| Population and dwelling counts | Dimension name |
|---|---|
| (11) | Total number of members in the 'Population and dwelling counts' dimension |
| Population, 2021 | Member name |
| [1] | Coordinate value for member 'Population, 2021' |
| Population and dwelling counts | Dimension name |
|---|---|
| (11) | Total number of members in the 'Population and dwelling counts' dimension |
| Population, 2016 | Member name |
| [2] | Coordinate value for member 'Population, 2016' |
In this example, there will be 11 columns of data representing the 11 members of the 'Population and dwelling counts' dimension. The coordinate for any datapoint will be the concatenation of the coordinate for the GEO dimension (this value appears in the coordinate field) and the value of coordinate for a specific member, as shown in the column header.
Record Layout
- The transposing of 2021 Census of Population cubes has resulted in a record layout that differs from non-Census cubes. The record layout for these cubes contains the following fields.
- REF_DATE
- GEO
- DGUID
- COORDINATE
- DIMENSION NAME AND MEMBER NAME
- SYMBOLS
- The number of fields in the data output file varies based on the number of members in the transposed last dimension.
- Symbols fields (columns) have been added for each data column to allows for instances where symbols may be necessary (data quality, suppression etc.)
Data File Record Layout (Census of Population cubes: 98-XXXX-XX)
Ref_date
Reference period for the series being released.
GEO
The geographic dimension. The members of this dimension will differ based on the particular cube.
DGUID
Dissemination Geography Unique Identifier - DGUID.
It is an alphanumeric code, composed of four components. It varies from 10 to 20 characters in length. The first 9 characters are fixed in composition and length.
Vintage (4) + Type (1) + Schema (4) + Geographic Unique Identifier (2-11) :
VVVV T SSSS GGGGGGGGGGG
Coordinate
Concatenation of the member ID values for all dimensions, excluding the last 'transposed' dimension.
To get the full coordinate for a datapoint, a user will have to concatenate the value from the 'Coordinate field' and the coordinate value from the column header for a specific member from the last 'transposed' dimension.Dimension/Member
Transposed last dimension and member name.
Symbol
Field used to associate any necessary symbols to specific datapoints.
Metadata File (Census of Population cubes: 98-XXXX-XX)
The metadata file for 2021 Census of Population cubes is very similar to the metadata file for non-Census cubes, with some notable exceptions. Additional fields included within the Census cubes include;
- Universe
- Variable List
- Dimension Correction Notes
- Member Correction Notes
- Member Geo Attribute Keys
- Various Geographic Attributes
*please note that the word "cube" is used interchangeably with the word 'table'
Metadata File Record Layout (Census of Population cubes: 98-XXXX-XX)
Cube Title
The title of the table. The output files are unilingual and thus will contain either the English or French title.
Product Id (PID)
The unique 8 digit product identifier for the table.
CANSIM Id
The ID number which formally identified the table in CANSIM. (where applicable)
URL
The URL for the representative (default) view of a given data table.
Cube Notes
Each note is assigned a unique number. This field indicates which notes, if any, are applied to the entire table.
Archive Status
Describes the status of a table as either 'Current' or 'Archived'. Archived tables are those that are no longer updated.
Frequency
Frequency of the table.
(i.e. annual)
See Appendix A.Start Reference Period
The starting reference period for the table.
End Reference Period
The end reference period for the table.
Total Number of Dimensions
The total number of dimensions contained in the table.
Universe
The Universe label found within Census data tables provides three main pieces of information.
1) The population of interest or focus of the table i.e. Population aged 15 years and over in private households;
2) The Census years the data are representing i.e. 2021 Census; 2021 and 2016 Censuses;
3) The Census form that data was collected i.e. short form 100% Data or long form 25% Sample Data.Variable List
The Variable label found within census tables, indicates the Variable name along with the number of categories i.e. Age (127) indicates it is an age variable with 127 categories for age.
Dimension Name
The name of a dimension in a table. There can be up to 10 dimensions in a table.
(i.e. – Geography)
Dimension ID
The reference code assigned to a dimension in a table. A unique reference Dimension ID code is assigned to each dimension in a table.
Dimension Notes
Each note is assigned a unique number. This field indicates which notes are applied to a particular dimension.
Dimension Correction Notes
Corrections applied at the dimension level.
Dimension Definitions
Reserved for future development.
Member Name
The textual description of the members in a dimension.
(i.e. – Nova Scotia, Ontario (members of the Geography dimension))
Member ID
The code assigned to a member of a dimension. There is a unique ID for each member within a dimension. These IDs are used to create the coordinate field in the data file. (see the 'coordinate' field in the data record layout).
Member Correction Notes
Corrections applied at the member level.
Member Geo Attribute Keys
Numeric code indication which geographic attributes apply to individual members.
Classification (where applicable)
Classification code for a member.
Definitions, data sources and methodsParent Member ID
The code used to display the hierarchical relationship between members in a dimension.
(i.e. – The member Ontario (5) is a child of the member Canada (1) in the dimension 'Geography')
Terminated
Indicates whether a member has been terminated or not. Terminated members are those that are no longer updated.
Member Notes
Each note is assigned a unique number. This field indicates which notes are applied to each member.
Member definitions
Reserved for future development.
Symbol Legend
The symbol legend provides descriptions of the various symbols which can appear in a table. This field describes a comprehensive list of all possible symbols, regardless of whether a selected symbol appears in a particular table.
Survey Code
The unique code associated with a survey or program from which the data in the table is derived. Data displayed in one table may be derived from one or multiple surveys or programs.
Survey Name
The name of the survey (s)/program. Data displayed in one table may derived from one or multiple surveys or programs.
Note ID
The code assigned to a particular note in a table.
Note
The actual textual note which can contain information at the table, dimension, and members levels. These notes are linked using the table notes, dimension notes, and member notes fields.
Definitions
Reserved for future development.
Correction ID
The code assigned to a correction.
Correction date
The date of a correction.
Correction note
The description of a correction that has taken place on a table.
Various Geographic Attributes
Within the various download tables a variety of geographic attributes may be available for the geography member, these could include:
- GeoName – the name of the geographic area;
- GeoTypeDesc – if a geography has a type description, this with be the description in full i.e. City for Ottawa, City;
- GeoTypeAbbr – if a geography has a type, this will be the abbreviation of the geography's type i.e. CV for City; Ottawa, CV
- GeoLevelDesc – this is the level of the geography i.e. Census Subdivision;
- DGUID – this is a unique geography identifier, that includes the vintage of the geographic boundaries, whether is it an administrative or statistical unit, a four digit geographic level identifier then the geography's geographic code;
- AltGeocode – is an alternate geographic code that is usually equal to the ending digits of the DGUID This code is often the geographic code found in previous census cycle products;
- DqfCode – this is a five digit data quality string about data quality information for the geography i.e. whether an area is suppressed due to confidentiality;
- DqfNote – this can be the written expression of the five digit data quality string;
- TnrShortForm – this value would be the total non-response rate to the short-form questionnaire.
Appendices
Appendix A - Frequency
Appendix A - Frequency
The various frequencies and their associated codes are:
| CODE | English | French |
|---|---|---|
| 1 | Daily | Quotidien |
| 2 | Weekly | Hebdomadaire |
| 4 | Every 2 weeks | Aux 2 semaines |
| 6 | Monthly | Mensuel |
| 7 | Every 2 months | Aux 2 mois |
| 9 | Quarterly | Trimestriel |
| 11 | Semi-annual | Semi-annuel |
| 12 | Annual | Annuel |
| 13 | Every 2 years | Aux 2 ans |
| 14 | Every 3 years | Aux 3 ans |
| 15 | Every 4 years | Aux 4 ans |
| 16 | Every 5 years | Aux 5 ans |
| 17 | Every 10 years | Aux 10 ans |
| 18 | Occasional | Occasionnel |
| 19 | Occasional Quarterly | Occasionnel trimestriel |
| 20 | Occasional Monthly | Occasionnel mensuel |
| 21 | Occasional Daily | Occasionnel quotidien |
Appendix B - Units of Measure
Appendix B - Units of Measure
The various units of measure and their associated codes are:
| CODE | English | French |
|---|---|---|
| 1 | 1981=100 | 1981=100 |
| 2 | 198203=100 | 198203=100 |
| 3 | 1986=100 | 1986=100 |
| 4 | 198812=100 | 198812=100 |
| 5 | 1992 constant dollars | Dollars constants de 1992 |
| 6 | 1992 constant dollars per square kilometre | Dollars constants de 1992 par kilomètre carré |
| 7 | 1992=100 | 1992=100 |
| 8 | 199412=100 | 199412=100 |
| 9 | 1996=100 | 1996=100 |
| 10 | 199712=100 | 199712=100 |
| 11 | 1997=100 | 1997=100 |
| 12 | 1999=100 | 1999=100 |
| 13 | 2000=100 | 2000=100 |
| 14 | 2002 constant dollars | Dollars constants de 2002 |
| 15 | 2002/2003 constant dollars | Dollars constants de 2002-2003 |
| 16 | 200212=100 | 200212=100 |
| 17 | 2002=100 | 2002=100 |
| 18 | 2007 constant dollars | Dollars constants de 2007 |
| 19 | 200704=100 | 200704=100 |
| 20 | 2007=100 | 2007=100 |
| 21 | 2010=100 | 2010=100 |
| 22 | 201104=100 | 201104=100 |
| 23 | 2012 constant dollars | Dollars constants de 2012 |
| 24 | 2012/01=100 | 2012/01=100 |
| 25 | 2013=100 | 2013=100 |
| 26 | Access lines | Lignes d'accès |
| 27 | Accidents | Accidents |
| 28 | Acres | Acres |
| 29 | Age-sex-standardized rate per 100,000 population | Taux normalisé selon l'âge et le sexe pour 100 000 personnes |
| 30 | Age-standardized rate per 100,000 population | Taux normalisé selon l'âge pour 100 000 personnes |
| 31 | Agreements | Conventions |
| 32 | Average hours per day | Moyenne des heures par jour |
| 33 | Bankruptcies | Faillites |
| 34 | Barrels | Barils |
| 35 | Barrels per day | Barils par jour |
| 36 | Benefit periods | Périodes de prestations |
| 37 | Birds | Oiseaux |
| 38 | Births | Naissances |
| 39 | Blocks | Blocs |
| 40 | Board feet | Pied planche |
| 41 | Bricks | Briques |
| 42 | Bushels | Boisseaux |
| 43 | Bushels per acre | Boisseaux par acre |
| 44 | Businesses | Entreprises |
| 45 | Calves | Veaux |
| 46 | Canada = 100 | Canada = 100 |
| 47 | Canadian dollars | Dollars canadiens |
| 48 | Canadian dollars per hundredweight | Dollars canadiens par poids de cent livres |
| 49 | Canadian dollars per unit of foreign currency | Dollars canadiens par unité de devise étrangère |
| 50 | Carriers | Transporteurs |
| 51 | Cars | Wagons |
| 52 | Cassettes | Cassettes |
| 53 | Cattle | Bovins |
| 54 | Cent/dozen | Cent/douzaine |
| 55 | Cents | Cents |
| 56 | Cents per cubic metre | Cents par mètre cube |
| 57 | Cents per litre | Cents par litre |
| 58 | Cents per pound | Cents par livre |
| 59 | Cents per pound of butter fat | Cents par livre de gras de beurre |
| 60 | Chained (2002) dollars | Dollars enchaînés (2002) |
| 61 | Chained (2002) dollars per hour | Dollars enchaînés (2002) par heure |
| 62 | Chained (2007) dollars in thousands | Dollars enchaînés (2007) en milliers |
| 63 | Chained (2007) dollars per hour | Dollars enchaînés (2007) par heure |
| 64 | Chicks | Poussins |
| 65 | Children | Enfants |
| 66 | Cigarettes | Cigarettes |
| 67 | Cigars | Cigars |
| 68 | Claims | Demandes |
| 69 | Corporations | Corporations |
| 70 | Corporations | Sociétés |
| 71 | Crude rate per 100,000 population | Taux brut pour 100 000 personnes |
| 72 | Cubic metres | Mètres cubes |
| 73 | Cubic metres dry | Mètres cubes sec |
| 74 | Cubic yards | Verges cubes |
| 75 | Current dollars | Dollars courants |
| 76 | Customers | Clients |
| 77 | Days | Jours |
| 78 | Degrees Celsius | Degrés Celsius |
| 79 | Discs | Disques |
| 80 | Dollar per 100 pound | Dollar par 100 livre |
| 81 | Dollars | Dollars |
| 82 | Dollars per 1.81 kilograms | Dollars par 1,81 kilogrammes |
| 83 | Dollars per 10 kilograms | Dollars par 10 kilogrammes |
| 84 | Dollars per 10 litres | Dollars par 10 litres |
| 85 | Dollars per 10 x 400 grams | Dollars par 10 x 400 grammes |
| 86 | Dollars per 10,000 feet | Dollars par 10 000 pieds |
| 87 | Dollars per 15 kilograms | Dollars par 15 kilogrammes |
| 88 | Dollars per 2 kilograms | Dollars par 2 kilogrammes |
| 89 | Dollars per 2.5 kilograms | Dollars par 2,5 kilogrammes |
| 90 | Dollars per 20 kilograms | Dollars par 20 kilogrammes |
| 91 | Dollars per 20 litres | Dollars par 20 litres |
| 92 | Dollars per 205 litres | Dollars par 205 litres |
| 93 | Dollars per 22.7 litres | Dollars par 22,7 litres |
| 94 | Dollars per 25 kilograms | Dollars par 25 kilogrammes |
| 95 | Dollars per 3 kilograms | Dollars par 3 kilogrammes |
| 96 | Dollars per 3.3 litres | Dollars par 3,3 litres |
| 97 | Dollars per 4 litres | Dollars par 4 litres |
| 98 | Dollars per 4.45 litres | Dollars par 4,45 litres |
| 99 | Dollars per 5 litres | Dollars par 5 litres |
| 100 | Dollars per 8 litres | Dollars par 8 litres |
| 101 | Dollars per 9 litres | Dollars par 9 litres |
| 102 | Dollars per 9,000 feet | Dollars par 9 000 pieds |
| 103 | Dollars per 9.5 litres | Dollars par 9,5 litres |
| 104 | Dollars per bushel | Dollars par boisseaux |
| 105 | Dollars per carton | Dollars par carton |
| 106 | Dollars per dozen | Dollars par douzaine |
| 107 | Dollars per hour | Dollars par heure |
| 108 | Dollars per hundredweight | Dollars par quintal |
| 109 | Dollars per hundredweight | Dollars par poids de cent douze livres |
| 110 | Dollars per hundredweight | Dollars par poids de cent livres |
| 111 | Dollars per hundredweight | Dollars par quintaux |
| 112 | Dollars per hundredweight of milk | Dollars par poids de cent douze livres de lait |
| 113 | Dollars per kilogram | Dollars par kilogramme |
| 114 | Dollars per kilolitre | Dollars par kilolitre |
| 115 | Dollars per kilometre | Dollars par kilomètre |
| 116 | Dollars per litre | Dollars par litre |
| 117 | Dollars per metric tonne | Dollars par tonne métrique |
| 118 | Dollars per person | Dollars par personne |
| 119 | Dollars per pound | Dollars par livre |
| 120 | Dollars per ton | Dollars par tonne |
| 121 | Dollars per tonne | Dollars par tonne métrique |
| 122 | Dollars per tonnes | Dollars par tonnes métriques |
| 123 | Dollars per unit of real GDP | Dollars par unité de PIB réel |
| 124 | Dollars, 1972=100 | Dollars, 1972=100 |
| 125 | Dollars, 1981=100 | Dollars, 1981=100 |
| 126 | Dollars, 1982=100 | Dollars, 1982=100 |
| 127 | Dollars, 1986=100 | Dollars, 1986=100 |
| 128 | Dollars, 1992 | Dollars, 1992 |
| 129 | Dozens | Douzaines |
| 130 | Dozens per person, per year | Douzaines par personne, par année |
| 131 | Duration | Durée |
| 132 | Eggs | Oeufs |
| 133 | Employees | Employés |
| 134 | Employees | Travailleurs |
| 135 | Enterprises | Entreprises |
| 136 | Establishments | Établissements |
| 137 | Evenings | Soirées |
| 138 | Families | Familles |
| 139 | Firms | Entreprises |
| 140 | Foreign-born persons | Personnes nées à l'étranger |
| 141 | Full-time equivalent | Équivalence temps plein |
| 142 | Gallons | Gallons |
| 143 | Gigajoules | Gigajoules |
| 144 | Gigajoules per thousand current dollars of production | Gigajoules par millier de dollars courants de production |
| 145 | Gigalitres | Gigalitres |
| 146 | Gigawatt hours | Gigawatt-heures |
| 147 | Grams | Grammes |
| 148 | Head | Tête |
| 149 | Hectares | Hectares |
| 150 | High 95% confidence interval | Limite supérieure de l'intervalle de confiance de 95 % |
| 151 | Hogs | Porcs |
| 152 | Hours | Heures |
| 153 | Hours in thousands | Heures en milliers |
| 154 | Households | Ménages |
| 155 | Hundredweight | Poids de cent douze livres |
| 156 | Hundredweight | Poids de cent livres |
| 157 | Hundredweight | Quintaux |
| 158 | Hundredweight per acre | Quintaux par acre |
| 159 | Hundredweight per harvested acres | Quintaux à l'acre récolté |
| 160 | Index | Indice |
| 161 | Index, 1926=100 | Indice, 1926=100 |
| 162 | Index, 1948=100/1968=100 | Indices, 1948=100/1968=100 |
| 163 | Index, 1961=100 | Indice, 1961=100 |
| 164 | Index, 1967=100 | Indice, 1967=100 |
| 165 | Index, 1971=100 | Indice, 1971=100 |
| 166 | Index, 1972=100 | Indice, 1972=100 |
| 167 | Index, 1975=1000 | Indice, 1975=1000 |
| 168 | Index, 1977=100 | Indice, 1977=100 |
| 169 | Index, 1981=100 | Indice, 1981=100 |
| 170 | Index, 1982-84=100 | Indice, 1982-84=100 |
| 171 | Index, 1986=100 | Indice, 1986=100 |
| 172 | Index, 1990=100 | Indice, 1990=100 |
| 173 | Index, 1992=100 | Indice, 1992=100 |
| 174 | Index, 199712=100 | Indice, 199712=100 |
| 175 | Index, 1997=100 | Indice, 1997=100 |
| 176 | Index, 2000=1000 | Indice, 2000=1000 |
| 177 | Index, 2001=100 | Indice, 2001=100 |
| 178 | Index, 2002=100 | Indice, 2002=100 |
| 179 | Index, 2003=100 | Indice, 2003=100 |
| 180 | Index, 2006=100 | Indice, 2006=100 |
| 181 | Index, 2007=100 | Indice, 2007=100 |
| 182 | Index, 2008=100 | Indice, 2008=100 |
| 183 | Index, 2009=100 | Indice, 2009=100 |
| 184 | Index, 2010=100 | Indice, 2010=100 |
| 185 | Index, 2011=100 | Indice, 2011=100 |
| 186 | Index, 2013=100 | Indice, 2013=100 |
| 187 | Index, 82-90=100 | Indice, 82-90=100 |
| 188 | Index, combined city average=100 | Indice, moyenne des villes combinées=100 |
| 189 | Index,1992=100 | Indice, 1992=100 |
| 190 | Jobs | Emplois |
| 191 | Kilocalories | Kilocalories |
| 192 | Kilograms | Kilogrammes |
| 193 | Kilograms per hectare | Kilogrammes par hectare |
| 194 | Kilograms per person, per year | Kilogrammes par personne, par année |
| 195 | Kilolitres | Kilolitres |
| 196 | Kilometres | Kilomètres |
| 197 | Kilometres per hour | Kilomètres par heure |
| 198 | Kilotonnes | Kilotonnes |
| 199 | Kilowatt-hours | Kilowattheures |
| 200 | Kilowatts | Kilowatts |
| 201 | Layers | Pondeuses |
| 202 | Lines | Lignes |
| 203 | Litres | Litres |
| 204 | Litres absolute alcohol | Litres d'alcool absolu |
| 205 | Litres per person, per year | Litres par personne, par année |
| 206 | Low 95% confidence interval | Limite inférieure de l'intervalle de confiance de 95 % |
| 207 | Mean number | Nombre moyen |
| 208 | Megalitres | Mégalitres |
| 209 | Megatonnes | Mégatonnes |
| 210 | Megawatt hours | Mégawatt heures |
| 211 | Message | Appel |
| 212 | Metric bundles | Paquets métriques |
| 213 | Metric rolls | Rouleaux métriques |
| 214 | Metric tonnes | Tonnes métriques |
| 215 | Metric units | Unités métriques |
| 216 | Micrograms | Microgrammes |
| 217 | Milligrams | Milligrammes |
| 218 | Millimetres | Millimètres |
| 219 | Minutes | Minutes |
| 220 | Months | Mois |
| 221 | Month/day | Mois/jour |
| 222 | National currency per Canadian dollar | Monnaie nationale par dollar canadien |
| 223 | Number | Nombre |
| 224 | Niacin equivalent | Équivalent en niacine |
| 225 | Nights | Nuitées |
| 226 | Number in thousands | Nombre en milliers |
| 227 | Number of farms reporting | Nombre de fermes déclarantes |
| 228 | Number of visits | Nombre de visites |
| 229 | Number per square kilometre | Nombre par kilomètre carré |
| 230 | Other British- and foreign-born persons | Personnes nées dans un autre pays britannique et à l'étranger |
| 231 | Other British-born persons | Personnes nées dans un autre pays britannique |
| 232 | Oven-dry metric tonnes | Tonnes métriques séchées au four |
| 233 | Pairs | Paires |
| 234 | Passenger-kilometres | Passagers-kilomètres |
| 235 | Passenger-kilometres | Voyageur-kilomètres |
| 236 | Passengers | Passagers |
| 237 | Passengers | Voyageurs |
| 238 | Passengers-miles | Voyageurs-mille |
| 239 | Percent | Pourcent |
| 240 | Percent change (1986=100) | Variation en pourcentage (1986=100) |
| 241 | Percent change (1992=100) | Variation en pourcentage (1992=100) |
| 242 | Percentage | Pourcentage |
| 243 | Percentage of gross domestic income | Pourcentage du revenu intérieur brut |
| 244 | Percentage of gross domestic product | Pourcentage du produit intérieur brut |
| 245 | Percentage of households | Pourcentage des ménages |
| 246 | Percentage share | Part en pourcentage |
| 247 | Person-trips | Voyages-personnes |
| 248 | Person-visits | Visites-personnes |
| 249 | Persons | Personnes |
| 250 | Petajoules | Pétajoules |
| 251 | Point | Point |
| 252 | Policies | Polices |
| 253 | Poults | Dindonneau |
| 254 | Pounds | Livres |
| 255 | Pounds of milk | Livres de lait |
| 256 | Pounds per acre | Livres par acre |
| 257 | Rate | Taux |
| 258 | Rate per 1,000 births | Taux pour 1 000 naissances |
| 259 | Rate per 1,000 legally married females | Taux pour 1 000 femmes mariées légalement |
| 260 | Rate per 1,000 legally married males | Taux pour 1 000 hommes mariés légalement |
| 261 | Rate per 1,000 live births | Taux pour 1 000 naissances vivantes |
| 262 | Rate per 1,000 males | Taux pour 1 000 hommes |
| 263 | Rate per 1,000 marriages | Taux pour 1 000 mariages |
| 264 | Rate per 1,000 total births | Taux pour 1 000 naissances totales |
| 265 | Rate per 100,000 population | Taux pour 100 000 personnes |
| 266 | Rates per 1,000 females | Taux pour 1 000 femmes |
| 267 | Rates per 1,000 population | Taux pour 1 000 personnes |
| 268 | Rates per 1,000 unmarried females | Taux pour 1 000 femmes non mariées |
| 269 | Rates per 1,000 unmarried males | Taux pour 1 000 hommes non mariés |
| 270 | Ratio | Rapport |
| 271 | Ratio | Ratio |
| 272 | Ratio | Taux |
| 273 | Records | Disques |
| 274 | Retinol equivalent | Équivalent rétinol |
| 275 | Seat-kilometres | Sièges-kilomètres |
| 276 | Shares | Actions |
| 277 | Shares | Parts |
| 278 | Shelters | Refuges |
| 279 | Square feet | Pieds carrés |
| 280 | Square kilometres | Kilomètres carrés |
| 281 | Square metres | Mètres carrés |
| 282 | Tapes | Rubans |
| 283 | Terajoules | Térajoules |
| 284 | Thousands of dollars | Milliers de dollars |
| 285 | Tonne-kilometres | Tonne-kilomètres |
| 286 | Tonne-miles | Tonne-mille |
| 287 | Tonnes | Tonnes |
| 288 | Tonnes | Tonnes métriques |
| 289 | Tonnes of oil equivalent | Équivalent des tonnes du pétrole |
| 290 | Tonnes per thousand current dollars of production | Tonnes par millier de dollars courants de production |
| 291 | Tons | Tonnes |
| 292 | Tons | Tonnes impériales |
| 293 | Tons per acre | Tonnes par acre |
| 294 | Troy ounces | Onces troy |
| 295 | Twenty foot equivalent units | Unités équivalentes à vingt pieds |
| 296 | US dollars per unit of real GDP | Dollars américains par unité de PIB réel |
| 297 | United States Dollars | Dollars des États-Unis |
| 298 | United States dollars | Dollars des États-Unis |
| 299 | United States dollars per Canadian dollar | Dollars États-Unis par dollar canadien |
| 300 | Units | Unités |
| 301 | Vehicle-kilometres | Véhicule-kilomètres |
| 302 | Vehicles | Véhicules |
| 303 | Weeks | Semaines |
| 304 | Weights | Pondérations |
| 305 | Weights, 1986=100 | Pondérations, 1986=100 |
| 306 | Weights, 1997=100 | Pondérations, 1997=100 |
| 307 | Women | Femmes |
| 308 | Years | Années |
| 309 | Dollars, 2002 | Dollars, 2002 |
| 310 | Micrograms per litre (µg/L) | Microgrammes par litre (µg/L) |
| 311 | Minutes per day | Minutes par jour |
| 312 | Nanograms per millilitre (ng/mL) | Nanogrammes par millilitre (ng/mL) |
| 313 | Nanomoles per litre (nmol/L) | Nanomoles par litre (nmol/L) |
| 314 | 2013 constant dollars | Dollars constants de 2013 |
| 315 | Dollars per head | Dollars par pomme |
| 316 | Quarts | Pintes |
| 317 | Dollars per thousand cubic metres | Dollars par millier de mètres cubes |
| 318 | Litres per person per day | Litres par personne par jour |
| 319 | Twenty feet equivalent units | Unités équivalent à vingt pieds |
| 320 | Gigajoules per thousand cubic metres | Gigajoules par millier de mètres cubes |
| 321 | 2007 chained dollars | Dollars enchaînés 2007 |
| 322 | 2014 constant dollars | Dollars constants de 2014 |
| 323 | Cubic kilometres | Kilomètres cube |
| 324 | 2015=100 | 2015=100 |
| 325 | Weight in carats | Poids en carats |
| 326 | Number of gross | Nombre en grosses |
| 327 | Volume in hectolitres | Volume en hectolitres |
| 328 | Weight in kilograms of named substance | Poids en kilogrammes de la matière mentionnée |
| 329 | Weight in air dry kilograms | Poids en kilogrammes séchés à l'air |
| 330 | Volume in litres of pure alcohol | Volume en litres d'alcool pur |
| 331 | Volume in litres | Volume en litres |
| 332 | Area in square metres | Superficie en mètres carrés |
| 333 | Volume in cubic metres | Volume en mètres cubes |
| 334 | Length in metres | Longueurs en mètres |
| 335 | Megawatt-Hour | Mégawattheure |
| 336 | Number of packages | Nombre de paquets |
| 337 | Thousands of cubic metres | Milliers de mètres cubes |
| 338 | Weight in metric tonne | Poids en tonne métrique |
| 339 | Metric tonne air dry | Tonne métrique séchée à l'air |
| 340 | Number of dozens | Nombre de douzaines |
| 341 | Weight in grams | Poids en grammes |
| 342 | Weight in kilograms | Poids en kilogrammes |
| 343 | Blank | Blanc |
| 344 | Number of pairs | Nombre de paires |
| 345 | 2015 constant dollars | Dollars constants de 2015 |
| 346 | 2014=100 | 2014=100 |
| 347 | Index, 201612=100 | Indice, 201612=100 |
| 348 | Index, 2012=100 | Indice, 2012=100 |
| 349 | Available seat-kilometres | Sièges-kilomètres disponibles |
| 888 | Null | Nul |
Appendix C - Scalar Factors
Appendix C - Scalar Factors
The various scalar factors and their associated codes are:
| CODE | English | French |
|---|---|---|
| 0 | units | unités |
| 1 | tens | dizaines |
| 2 | hundreds | centaines |
| 3 | thousands | milliers |
| 4 | tens of thousands | dizaines de milliers |
| 5 | hundreds of thousands | centaines de milliers |
| 6 | millions | millions |
| 7 | tens of millions | dizaines de millions |
| 8 | hundreds of millions | centaines de millions |
| 9 | billions | milliards |