For a century, Statistics Canada has been using data from public and private sector sources responsibly. We are entrusted to ensure that Canadians have key information on Canada's economy, society and environment.
Statistics Canada uses administrative data to complement or to replace survey data. Using this data responsibly ensures that we meet Canada's new and ongoing information needs, and reduce response burden. Administrative data are especially helpful to measure social and economic phenomena pertaining to populations or topics that may be difficult to obtain through surveys. Learn more about the use of administrative data sources in the production of official statistics.
How we protect your privacy and confidentiality
Statistics Canada has the obligation to keep administrative data, such as vital statistics or tax data; private, secure, and confidential. The confidentiality of data is governed by the Statistics Act, the Access to Information Act, and the Privacy Act, and by departmental policies and directives.
Strict measures are in place to ensure the protection of information at all times:
Direct identifiers are removed as soon as possible; they are deleted if there is no further need for them, or stored separately if there is a reasonable probability that there will be a future need.
Data is aggregated, compiled and anonymized to ensure your privacy is protected.
Statistics Canada uses state-of-the-art tools, software and processes that prevent disclosure and ensure the confidentiality and privacy of individual data.
Statistics Canada employees are sworn to secrecy, and subject to fines and/or imprisonment, should they reveal confidential information.
What you need to know:
Statistics Canada uses administrative data responsibly to improve data quality, meet new and ongoing information needs, and to reduce data collection costs and response burden.
Statistics Canada has rigorous processes in place to keep your data private, safe and confidential.
Your data is fully protected by laws and relevant policies designed to safeguard your privacy.
Administrative data sources in the production of official statistics
Statistics Canada is committed to openness and transparency. We continue to evaluate administrative data sources responsibly to address known data gaps. Learn more about Statistics Canada's use of administrative data in the production of official statistics in the examples outlined below.
Statistics Canada is modernizing its methods of providing access to data under federal legislation and Government of Canada security protocols to improve its service. As part of this initiative, Statistics Canada will introduce the use of authorized workspaces, in addition to designated certified rooms where the virtual data lab may be accessed, to allow federal government employees access to anonymized data (direct personal identifiers removed) Statistics Canada's household and business survey and administrative data holdings.
Objective
This privacy impact assessment explores privacy and security risks associated with accessing anonymized data in authorized workspaces outside of the designated certified room at the Canada Mortgage and Housing Corporation (CMHC) virtual Federal Research Data Centre (vFRDC) and makes recommendations for issue resolution or mitigation. Statistics Canada is piloting modern data access methods to increase collaboration with trusted partners and to fully realize the potential of the data holdings created for the public good while ensuring that all data assets are protected against unauthorized use and disclosure.
Description
Building on the first prototype, where secure data access to anonymized data for statistical research projects is provided through the Virtual Federal Research Data Centre (vFRDC) located at CMHC headquarters in Ottawa, Statistics Canada and CMHC have entered into agreement to regulate access for approved CMHC employees to use anonymized research files in authorized workspaces outside of the designated certified room. CMHC will benefit from this access by being able to create statistical information to improve policy decision-making, specifically, the Federal Government's National Housing Strategy.
The anonymized data are housed only on secure servers at Statistics Canada headquarters and authorized researchers will be required to use Statistics Canada secure encrypted devices in the workspaces to connect to these central servers through Virtual Desktop Image (VDI). Statistics Canada's Confidentiality Classification Tool (CCT) is used to determine the level of sensitivity of the content of the data files and to determine which anonymized data files have a moderate to low risk of re-identification. Anonymized data accessed in authorized workspaces are less sensitive than the data accessed in the designated certified room in that the anonymized data include one or more of the following to reduce identifiability: the data are based on an inherently less sensitive topic, have been perturbed to increase disclosure protection, have sensitive variables removed from the file or contain additional aggregation for sensitive variables. Statistics Canada most sensitive anonymized data will only be accessed from the designated certified room.
Statistics Canada will continue to evaluate this prototype for its security, privacy and user-centric improvements to data access. Statistics Canada will analyze any incidents related to violations of security protocols and implement additional mitigation factors if necessary.
Risk Area Identification and Categorization
The PIA also identifies the risk areas and categorizes the level of potential risk (level 1 representing the lowest level of potential risk and level 4, the highest) associated with the collection and use of personal information of employees.
Type of program or activity – Level 1: Program does NOT involve a decision about an identifiable individual
Type of personal information involved and context – N/A: Only anonymized data held by Statistics Canada are accessed and used by authorized researchers in this pilot.
Program or activity partners and private sector involvement – Level 2: With other government institutions.
Duration of the program or activity – Level 3: Long-term (ongoing) program.
Program population – N/A: The program's use of personal information is not for administrative purposes. Information is accessed for statistical purposes, under the authority of the Statistics Act.
Personal information transmission – Level 2: The personal information is used in a system that has connections to at least one other system.
Technology and privacy: The pilot does not involve the implementation of new technologies.
Privacy breach: There is a very low risk of a breach of some of the personal information being disclosed:
The impact on the individual would be minimal as the information is not linked to an individual's name, address or any other personal identifiers.
The impact on the institution would be moderate, resulting in possible loss of trust and a small impact on the reputation of Statistics Canada.
Conclusion
Access to Statistics Canada’s anonymized data in an authorized workspace will improve user experience of data access while maintaining secure disclosure control.
Statistics Canada has ensured that there are measures in place that meet central agency and Statistics Canada security standards for the protection of personal information.
This assessment concludes that, with the existing safeguards and ongoing monitoring, any remaining risks are such that Statistics Canada is prepared to accept and manage the risk.
CVs for Total sales by geography - April 2019
Table summary
This table displays the results of Annual Retail Trade Survey: CVs for Total sales by geography - April 2019. The information is grouped by Geography (appearing as row headers), Month and Percent (appearing as column headers).
CVs for Total Sales by Geography
Table summary
This table displays the results of CVs for Total Sales by Geography. The information is grouped by geography (appearing as row headers), Month, 201804, 201805, 201806, 201807, 201808, 201809, 201810, 201811, 2018012, 201901, 201902, 201903 and 201904 (appearing as column headers), calculated using percentage unit of measure (appearing as column headers).
Annual Survey of Manufacturing and Logging Industries
CANSIM
Canadian Socioeconomic Information Management System
CMA
Census metropolitan area
EQ
Electronic questionnaire
GDP
Gross domestic product
IBSP
Integrated Business Statistics Program
ISTD
Investment, Science and Technology Division
MWTD
Manufacturing and Wholesale Trade Division
MWTRSIP
Manufacturing, Wholesale Trade, Retail and Service Industries Program
NAICS
North American Industry Classification System
NDM
New Dissemination Model
OECD
Organisation for Economic Co-operation and Development
RSID
Retail and Service Industries Division
The report in short
This report presents the findings of the evaluation of the Manufacturing, Wholesale Trade, Retail and Service Industries Program (MWTRSIP). The evaluation was conducted by Statistics Canada's Evaluation Division and covers the period of 2012/2013 to 2016/2017 and, to some extent, 2017/2018. The evaluation examined the relevance and performance of the program in accordance with the Treasury Board Secretariat's Policy on Results (2016). The evaluation also studied specific areas of interest to the program in support of decision making, accountability and improvement.
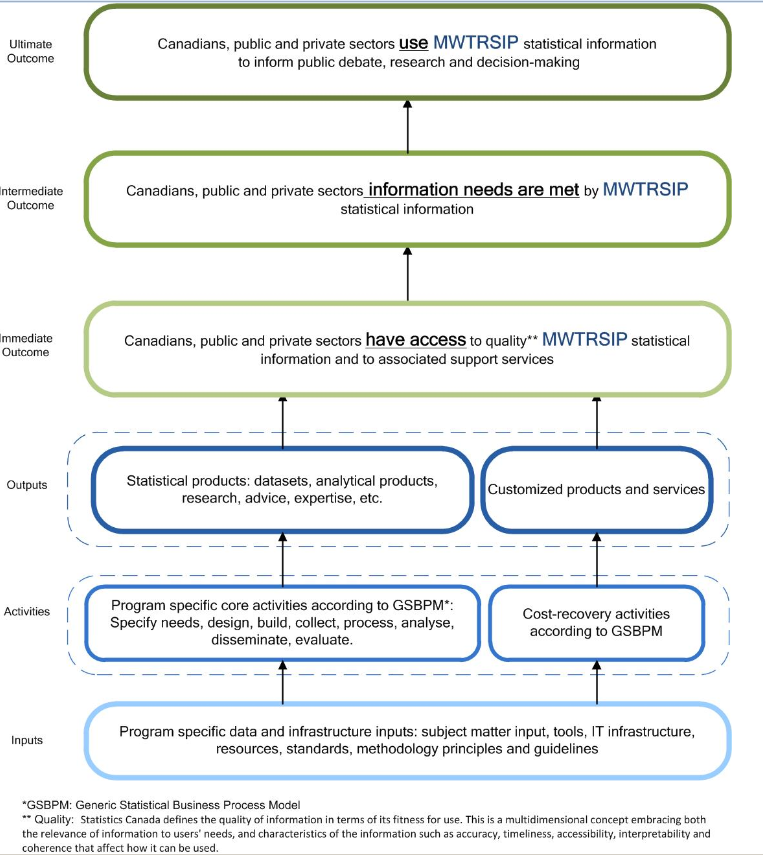
The MWTRSIP is responsible for the provision of statistical information and advice on distributive trades, manufacturing, and service industries to governments, private organizations and institutions. The program aims to provide Canadians and the public and private sectors with access to quality statistical information and associated support services to inform public debate, research and decision making.
Key findings
The MWTRSIP is well aligned with federal roles and responsibilities, government priorities, and Statistics Canada's objectives. MWTRSIP activities support government priorities on economic growth and innovation, and the program provides key data for the calculation of gross domestic product (GDP), an indicator used to assess the health of the economy.
There is a clear continued need for the MWTRSIP. The program's statistical information is used for a variety of needs and by a wide range of users. The program is considered a trusted source of information and, while some complementary sources of information exist, no duplicate source was identified. Consultations with external users help the program stay connected, which contributes to meeting users' current and emerging needs—although participants in these consultations felt that more could be done to keep them informed. Gaps were identified during the evaluation, including scope, access, frequency, level of detail and timeliness; several initiatives were underway to fill some of them.
The evaluation found that MWTRSIP statistical information was generally considered accessible, accurate, coherent and interpretable, although there were ways to improve in each area. Most survey respondents and interviewees were quite satisfied with the quality of their customized data and the responsiveness of support service areas once they were able to reach the appropriate contact.
Timeliness is the dimension of quality where some issues were raised. While there was high interest from users to have information earlier, especially for the monthly retail survey, most were not willing to trade timeliness for accuracy—they preferred the status quo. The evaluation found there may be opportunities to improve timeliness by reducing the accompanying analytical information with each release, so long as information on coherence and methodological changes is provided. Finally, there may be opportunities to improve timeliness through the release process.
Overall, evidence indicated that the management of financial resources was challenging because of changes in program operations and resources during the scope of the evaluation. During the period, there were a number of measures implemented to cut costs and increase operational efficiency. The adoption of common tools will bring benefits and efficiency in the long term, but the transition period had an impact on the capacity to maintain quality and on employee workloads. Generally, there appears to be sound management and monitoring in place, although there are opportunities to further integrate activities and provide more guidance for staff.
Recommendations
Recommendation 1: Data gaps
The evaluation found that the program maintains effective relationships with its users and stakeholders and, as a result, has a good understanding of the gaps in the program. Comprehensive consultations took place during the evaluation period, and the program used the information gathered to develop plans to address as many gaps as possible within their resource allocation.
It is recommended that plans address the following key gaps:
E-commerce and the new economy—an agency-wide approach is required, given that the subject spans several programs. While efforts are currently underway in several areas, there is a lack of coordination, roles and responsibilities are not clear, and senior management engagement needs to increase.
Greater level of detail—over time, there has been a loss of detail for users. The MWTRSIP should continue working with key partners and stakeholders (internal and external) to explore avenues to address this.
Data on services—while services make up a large share of the economy, statistical information is rather limited. It is recommended that the MWTRSIP explore opportunities to increase the frequency of its surveys and to increase the scope of the services covered.
In exploring these gaps, the program should continue to use a strong user-centric approach.
Recommendation 2: Timeliness
There were mixed results regarding the level of satisfaction with the timeliness of releases (82% of survey respondents and 55% of interviewees were satisfied with the current release times). When presented with different scenarios trading off timeliness for accuracy, users were generally unwilling to give up accuracy (with more than half preferring the status quo). Some users noted they would be willing to accept a loss in quality for more timely information during their peak seasons (e.g., retail data around Christmas).
It is recommended that the MWTRSIP
review its process for releases to ensure they are as timely as possible, taking into consideration other key objectives such as relevance and accuracy; this includes exploring the possibility of reducing contextual analysis to improve timeliness, and targeting and coordinating the setting of release dates
undertake a comprehensive consultation of its key users prior to taking any steps to improve timeliness that would impact accuracy.
Recommendation 3: Priority setting
The MWTRSIP is currently trying to address gaps/needs identified during previous consultations, and respond to the modernization agenda and other agency initiatives. These activities are in addition to its regularly mandated program.
It is recommended that, during this transitional period, MWTRSIP management provide greater clarification on priorities to employees.
Recommendation 4: Outreach and client services
Given the rapid evolution taking place in the program, and the broad, diverse range of users, it is vital that the MWTRSIP maintain strong relationships with users and actively promote its statistical information. During the evaluation, evidence was found of ongoing awareness-raising activities, but little evidence was found of a strategic element such as a written plan.
Client services are a key contact point with users. During discussions on access and cost-recovery services with interviewees, it was noted by several that client services could be improved. More specifically, it was noted that the level and quality of responsiveness were inconsistent (e.g., being less responsive during peak periods).
It is recommended that the MWTRSIP
develop and implement a comprehensive outreach plan based on information from consultations, staff and other relevant partners (internal and external); the plan should include mechanisms for ongoing communication with users to inform them of program developments and to raise awareness
prepare a strategy to strengthen client service delivery.
1. What is covered
This evaluation was conducted in accordance with the Treasury Board Secretariat's Policy on Results (2016) and Statistics Canada's Risk-Based Audit and Evaluation Plan (2017/2018 to 2021/2022). The main objective of the evaluation was to provide a neutral, evidence-based assessment of the relevance and performance of the Manufacturing, Wholesale Trade, Retail and Service Industries Program (MWTRSIP) to support decision making, accountability and improvement. The evaluation covered activities undertaken from 2012/2013 to 2016/2017 and, to some extent, 2017/2018. This was the first time the program had been evaluated.
The program
The mandate of the MWTRSIP is to provide trusted, relevant and comprehensive information on the manufacturing, wholesale trade, retail trade and service sectors to inform public debate on economic issues; support economic policy development, implementation and evaluation; and guide business decision making. Total MWTRSIP expenditures over the five-year period (2012/2013 to 2016/2017) were approximately $127 million.
The Manufacturing and Wholesale Trade Division (MWTD) and the Retail and Service Industries Division (RSID) are the two divisions responsible for compiling, analyzing, and disseminating a broad range of comprehensive and integrated statistics that depict the production, sales, financial operations and product types for the manufacturing, retail, wholesale and service sectors in Canada.
The evaluation
Following discussions with the MWTRSIP and senior management, the following seven areas were identified for review in the evaluation:
Relevance and responsiveness to needs
1. Alignment with federal roles and responsibilities, government priorities, and objectives
2. Continued need for the program
3. Responsiveness to user needs
Performance: Effectiveness
4. Quality—access, accuracy, coherence and interpretability
5. Quality—timeliness
Performance: Efficiency
6. Utilization of resources
7. Efficiency
Guided by a utilization-focused evaluation approach, the following quantitative and qualitative collection methods were used:Footnote 1
Administrative and financial reviews
Review of MWTRSIP administrative data on activities, outputs and results.
Review of MWTRSIP financial data.
Literature review
Review of published reports, peer-reviewed journal articles, grey literature, websites and periodicals, including evidence from similar programs in other jurisdictions (e.g., OECD countries) relating to design and delivery.
Survey n=82
Online survey with respondents from a population of the MWTRSIP and statistics users, from November 27 to December 15, 2017 (response rate of 14%):
Review of internal departmental strategic documents.
Key informant interviews n=60
Semi-structured individual interviews undertaken between November 16, 2017, and February 7, 2018:
Federal (n=4)
Provincial/territorial (n=4)
Business community (n=23)
Academics (n=4)
MWTRSIP and other Statistics Canada officials (n=25)
Bibliometric and webometric assessment
A webometric assessment of uptake of 1,019 MWTRSIP releases and a bibliometric assessment of the MWTRSIP outputs in the peer-reviewed scientific literature published between 2000 and 2017 resulted in:
5,841 web page citations
75 peer-reviewed journal articles (from 2000 to 2017).
The program also requested that the following four topics undergo greater examination:
balance between timeliness and accuracy
increased frequency of the Retail Commodity Survey
quicker release of the program's key annual surveys (Annual Survey of Manufacturing and Logging Industries, Annual Retail Trade Survey, Annual Wholesale Trade Survey)
reduction of contextual analysis to expedite release.
2. What we learned
2.1. Alignment with federal roles and responsibilities, government priorities, and objectives
Evaluation question
To what extent did the activities of the MWTRSIP align with federal roles and responsibilities, government priorities, and objectives?
As stipulated in the Statistics Act, Statistics Canada is required "to collect, compile, analyze, abstract and publish statistical information relating to the commercial, industrial, financial, social, economic and general activities and condition of the people."Footnote 2 The act also assigns Statistics Canada the responsibility "to promote and develop integrated social and economic statistics pertaining to the whole of Canada and to each of the provinces thereof and to coordinate plans for the integration of those statistics."Footnote 3 Topics such as manufacturing, wholesale and retail trade are specifically listed in the act.Footnote 4
Data from the MWTRSIP are vital for the measurement of gross domestic product (GDP). The program includes 15 of 24 sectors as classified in the North American Industry Classification System (NAICS). As a significant contributor to the measurement of GDP, the MWTRSIP also supports the constitutional commitment of the federal government and Parliament to provide equalization payments to the provinces and territories.Footnote 5 The annual calculations for the equalization payments are made in accordance with the Federal-Provincial Fiscal Arrangements Act, which includes GDP.Footnote 6 The MWTRSIP's statistical information is also used to determine harmonized sales tax transfers in accordance with the Comprehensive Integrated Tax Coordination Agreements between the federal government and the provinces.
Reflecting the relative importance of the industries covered under the program, the government introduced a number of targeted measures through budgets to support its growth between 2012 and 2017. For example, Speeches from the Throne, budget documents and mandate letters have all identified growth in manufacturing and exports as a key priority. The MWTRSIP also supports the government by producing and disseminating statistical information required under a number of international agreements such as the International Monetary Fund's Special Data Dissemination Standard.
2.2. Continued need for the program
Evaluation question
To what extent do Canadians and the public and private sectors use statistical information to inform public debate, research and decision making?
The evaluation found evidence that the MWTRSIP was the main source of information for manufacturing, wholesale trade, retail and service industries—all important indicators of the economic performance of the country. The business community, federal government and provincial governments were the main users of MWTRSIP products.
Business community representatives noted that they primarily used MWTRSIP data to conduct economic analysis of trends and industry developments, specifically to understand and interpret how manufacturing, wholesale trade, retail and service industries are faring in the context of the Canadian economy as a whole. Another key use for MWTRSIP data was for econometric modelling and forecasting. For example, the data were used to predict the impact of economic policy changes on corresponding sectors of the economy and to forecast sales for different holiday seasons. Finally, some business community representatives (including those who represented consulting firms and business associations) used MWTRSIP data to develop reports and publications for clients.
Similar to business community users, federal and provincial government stakeholders also used MWTRSIP data for economic forecasting. Provincial government representatives reported they used MWTRSIP data to develop provincial economic accounts estimates, report on provincial GDP estimates and estimate provincial household expenditures.
The evaluation also found that secondary distributors were repackaging program CANSIM data into more user-friendly formats for clients; academic institutions were using MWTRSIP data for research purposes and to contribute to their own publications; and, finally, media were requesting and using the information to support specific research and articles.
When web trends were examined, the Government of Canada was the most frequent user of MWTRSIP products, with Innovation, Science and Economic Development Canada being the most frequent user. Monthly retail trade data were accessed the most frequently, followed by monthly manufacturing data and then monthly wholesale data. Respondents and interviewees reported that MWTRSIP data were used frequently on a daily basis.
Findings also indicated that the program did not duplicate or overlap with any other information sources. Interviewees noted that statistical information produced by commercial data providers and other organizations was complementary to the program's outputs and was used only for specific purposes or to fill specific gaps. Other information sources, such as surveys conducted by industry and professional associations or data published by market research firms, usually covered only a subset of the MWTRSIP population (e.g., data from members of associations, panels, and data on e-commerce). Informants also noted that Statistics Canada data were more accessible and more reliable than other information sources. Only a few researchers responded that they used Statistics Canada data as a secondary source to supplement, verify or double-check their own data.
2.3. Responsiveness to user needs
Evaluation questions
To what extent does the MWTRSIP statistical information respond to current and emerging needs of different groups of stakeholders? Are there gaps in the response?
To what extent are consultation activities effective in supporting the development and the responsiveness of the MWTRSIP?
Interviewees mentioned that Statistics Canada can play an important role in helping users define emerging trends and in clarifying how information should be gathered and classified. NAICS and other classification systems (e.g., North American Product Classification System) were seen as barriers that were not keeping pace with the rapidly evolving new economy. Internal documentation indicated that the Standards Division within Statistics Canada is currently working on this issue and that discussions are ongoing with trilateral partners to better reflect the digital economy in the next revision of NAICS in 2022.
Overall, the evaluation team found that MWTRSIP representatives had a good understanding of the current and emerging needs and that several initiatives were underway to fill gaps identified by the evaluation participants.
Level of detail
The main gap identified by key informants was the level of detail available. Close to 60% of survey respondents reported dissatisfaction with the level of detail, and many interviewees shared the same view. Areas of improvement that were suggested included greater disaggregation at the five- and six-digit NAICS levels; more retail and manufacturing data for lower levels of geography; and more detailed analysis at the regional, sub-regional, and sub-metropolitan levels.
Evaluation participants also raised concerns regarding data suppressions for confidentiality reasons for certain regions. While key informants understood the rationale for the data suppressions, they wondered whether Statistics Canada could suppress less data.
Several initiatives were put in place by the program following consultations in 2015 for manufacturing and wholesale, and in 2016 for RSID. These included the following:
More detailed constant dollar estimates for three mission-critical surveys were released in July 2018 for wholesale, and later for the others.
More local data: starting in June 2017, three CMAs were included in the monthly retail survey that covered 30% of the total retail sales in Canada (five new CMAs were added in January 2019). For manufacturing, 11 CMAs were released in November 2016, and additional data for 12 CMAs will be released in 2018/2019.
More detailed industry-level seasonal adjustments were added in the Monthly Wholesale Trade Survey starting August 2017.
The G-Confid softwareFootnote 7 was implemented and the specs were reviewed to ensure the appropriate level of protection for confidential cells while minimizing the loss of information.
Internal users indicated that, to get more detailed information for users, businesses would face an increased survey response burden (e.g., survey length, capacity of businesses to collect information). The MWTRSIP understands this trade-off and strives to find the appropriate balance.
E-commerce and the new economy
Another gap, and the most common trend identified by respondents, was the rise in, and increasing economic importance of, e-commerce. Interviewees indicated that a greater emphasis on e-commerce was needed. They pointed to items such as the development of e-commerce series, e-commerce data categorized by product category and type of store (e.g., e-groceries), separation of shipping costs from true e-commerce costs, and the extent to which retailers are participating in the digital economy. It was noted that improved e-commerce data would allow retailers to better understand the market (and degree of market saturation), compete for shares of retail sales, and prioritize merchandise for online versus in-person sales.
Another important gap identified was the extent to which Canadians are purchasing goods from international online retailers, particularly American retailers. This gap makes it difficult to understand the impact of e-commerce on the Canadian economy. One respondent indicated, "We are almost blind [to] what is going on."
Program representatives were aware of the gap; however, they noted that options are limited and that all countries are struggling with these issues. At the time of the evaluation, the program was taking steps to increase the number of outputs related to e-commerce, with some expected to be released in 2018. It was noted that options were limited for data on household transactions (peer to peer) and on issues around international online retailers. External interviewees generally acknowledged that Statistics Canada recognizes the importance of the issue and has improved the availability of e-commerce data over the past couple of years.Footnote 8
Defining e-commerce also presents a challenge. Some interviewees pointed out that different e-commerce definitions between Statistics Canada and other organizations can lead to vastly different estimates and forecasts related to the proportion of sales made online versus in stores. Furthermore, as mentioned in an internal document, there remains a need for a common definition among survey programs since the word "digital" can be used as a synonym for "Internet/online," which causes conceptual problems with product classification and, de facto, how the sale of a digital product is reported.
Many informants indicated that the boundaries between the sectors and industries of the economy are increasingly blurred. For instance, all supply chain intermediaries can now sell directly to end consumers via e-commerce, services are being bundled with manufactured outputs, and businesses are diversifying their products and services, which makes them harder to differentiate and classify. For example, some grocery stores now serve food and beverages in much the same way as a restaurant ("grocerants"), and some also sell clothing.
Program representatives noted that nebulous boundaries between sectors have always existed, though they have become more prominent with the growth of the service industry and the use of digitalization. Efforts are being made by the MWTRSIP to compare data across the different sectors (manufacturing, wholesale and retail) and to continuously review the Business Register to ensure businesses are classified accurately. However, despite these efforts, limitations still remain. Some program representatives suggested developing multidisciplinary studies by industry and creating online related tables to integrate the three sectors, but this would require resources.
Another trend mentioned was how the expansion of digitalization creates new products and services, such as online marketplaces (e.g., eBay and Amazon), digital publishing, data streaming (e.g., Netflix), and products and services generated by households (e.g., Uber, Airbnb, vloggers). Several factors—such as the statistical framework and tools available to measure the number of household transactions (peer to peer), the organizational structure of businesses that own e-platforms, and Canadian legislation—are hindering the ability to fully assess the sharing economy. It was generally agreed that digital commerce is a gap that needs to be addressed. Statistics Canada is undertaking many initiatives to fill this gap, including a rapid response survey of Canadian households on their use of digital platforms and technologies, and the development of a new digital economy economic account. The Investment, Science and Technology Division (ISTD) is also planning to launch a Canadian Internet Use Survey that will cover some aspects.
Overall, it appeared that better cohesion was required on this issue within Statistics Canada. When the evaluation team discussed concerns about e-commerce and the new economy with program representatives, no clear response arose. While all agreed that it is an important gap and referred to several ad hoc actions and initiatives taken so far, it appeared that there was no clear vision or coordinated approach. This could be explained by the fact that Statistics Canada's economic statistics divisions are primarily organized by industry, so there is no natural home for the subject. In 2016, the ISTD, identified by many as the internal expert on e-commerce, put in place the Subject-Matter Committee on Digital Economy Statistics to improve the exchange of information between the divisions currently working on the digital economy. It was noted that, since the committee's inception, only six meetings had taken place, and attendance was low. It was agreed by many participants that more involvement and commitment from senior management were needed to create more synergies, improve awareness among the different divisions and reinforce divisional accountability to ensure a collaborative effort on digital commerce.Footnote 9
Other trends and needs
Among other trends, informants pointed to changes in the food service industry (third-party food delivery options and higher-quality fast food operations, such as Freshii), growth of the "circular" economy involving the resale and reuse of goods, the impact of the legalization of cannabis, and the impact of fluctuating gasoline prices on retail sales data. The need to capture the impact of the political context, including NAFTA negotiations and other trade agreements, on manufacturing sales was also identified by interviewees.
Some interviewees identified the changing use of retail space as an emerging trend. Physical retailing is no longer as predictable as it once was; large retailers are vacating retail space, and traditional retail space is increasingly being used for services. This phenomenon increases the need for greater detail on commercial real estate vacancy rates, including data on the number of stores available by geographical location, price and sales per square foot.
Finally, key informants mentioned technological changes as an important trend. Data will be needed on labour, employment and productivity. It was also noted that there is a lack of understanding of how these technologies are currently being used, who is using them,Footnote 10 and their impact on the economy (e.g., blockchain technologies and cryptocurrencies).
Services
Virtually all users of services data thought improvements were required. Data users universally reported that, although services make up a large share of the economy, statistical information is rather limited. Several specific gaps were identified:
information on industries such as personal care services (e.g., eyeglass services, hair salons, massage parlours, fitness centres, gyms) and health care services
more information (historic and current) on intra- and inter-industry trade in services
more regional and sub-regional disaggregation (e.g., to help meet targets set in provincial growth plans), metropolitan data (tourism), and more industry categories and subcategories (e.g., a subcategory within restaurants that would cover fast casual; clarification between engineering, architecture and other firms)
greater disaggregation by firm size/type (e.g., according to restaurant type—whether or not it is part of a chain)
financial and other statistics for the annual food services and drinking places survey (e.g., number of years in business, sales per seat, square footage of the restaurant, number of meals served, franchise affiliation, average bill per customer, number of liquor licences).
Improvements related to access, frequency and timeliness were also raised. In terms of access, many use The Daily as an entry point. They felt that more frequent releases in The Daily, and a dedicated web page with service industry information, would be useful. Grouping service data together and high-profile releases would also make the information more visible to potential users.
The frequency of the data was also viewed as being inadequate, with biannual releases being desired. Internal users indicated that more frequent data releases would provide better quality inputs for estimates such as GDP. The evaluation found that Statistics Canada had produced Quarterly Services Indicators in the past, but no one could speak to the quality of these products. One possible alternative proposed was to release an integrated product on services, similar to what is released in the United States.
Consultations and outreach
The evaluation found that MWTRSIP representatives generally stayed connected through conferences; formal and informal discussions with key users (i.e., provincial, federal, cost-recovery clients and main associations) and counterparts in the United States; business visits; and interdepartmental working groups and committees led by Statistics Canada or other departments, such as Canadian Heritage on culture.
A review of documents and internal interviews showed that initiatives like the manufacturing and wholesale environmental scan in 2015, the retail expert panel in 2016 and the cultural round table in 2018 were the formats that were most successful in identifying needs. As noted in the previous sections, most of the initiatives undertaken by the program to fill the gaps were the result of these larger consultations. Although considered the best formats by some program representatives, these types of consultations are most appropriate when the users and associations are well known. These formats are less effective when consulting with users who are not represented by major industry associations (e.g., service industries).
Some interviewees indicated that the purpose, expectations and outcomes of consultations should have been clearer. For example, post-consultation debriefs could have been conducted. Finally, some respondents noted that consultations were an opportunity to raise awareness of products, especially those that were not available on the website.
All internal informants noted they have excellent collaboration and effective bilateral communication with the MWTRSIP. The majority of the external stakeholders interviewed indicated a high level of satisfaction with the consultation process and believed their concerns were being taken seriously. Those who participated in the consultations agreed that a wide range of stakeholders were brought together and that discussions were facilitated effectively. However, they did comment that more representatives could have been invited, such as retailers, as opposed to those who monitor retail. According to the survey, 19% of the respondents who had never participated in a consultation would be willing to participate and collaborate with Statistics Canada.
It was also suggested that Statistics Canada regularly reach out to users to ensure they are aware of available data (i.e., new products and services). The evaluation found little evidence of strategic formal outreach plans/approaches;Footnote 11 instead, activities appeared to be tied to travel/conference plans. The only exception found was a communication plan in Wholesale Trade from a few years ago. Based on this plan, Wholesale Trade did a one-day public question-and-answer session. There were several other activities that took place during the period, including a Talking Stats session, a Data Story, a chat with an expert and several company visits. Limited activities took place afterward because of other priorities. In addition, there was little evidence of program representatives working with regional offices and the Statistical Information Service to inform them of their products.
2.4. Quality—access, accuracy, coherence and interpretability
Evaluation question
To what extent do Canadians and the public and private sectors have access to quality MWTRSIP statistical information and to associated support services?
Overall, the evidence indicated that MWTRSIP statistical information is considered accessible, accurate, coherent and interpretable. However, there were suggestions on how it could be improved.
Access
Website
Statistical information on the website is generally considered accessible once users are familiar with the website. Issues with the website included poor navigation, difficulty finding specific information, technical problems with the website and with downloading information, and challenges around the manipulation of CANSIM tables.Footnote 12 Two specific suggestions were the publication of release dates for non-monthly surveys and the inclusion of information on the availability of microdata files. On a more positive note, some key informants acknowledged improvements to the website over the past few years.
Client services
Overall, most survey respondents and interviewees were quite satisfied with the quality of their customized data and the responsiveness of support service areas once they were able to reach the appropriate contact. Some frequent users noted that the level of service offered by different parts of the agency is inconsistent and that, at times, they experienced long turnaround times.
Some frequent users of customized products believed that the availability of information depended on whom they spoke to in the agency. They cited examples where requests were first rejected and then approved. Some interviewees also noted a declining level of program knowledge and of knowledge of their past requests. For these reasons, some interviewers avoided using the client service units (and the main contact line) and instead searched for contacts directly in the subject-matter areas.
Program representatives indicated that, depending on the timing of a request, capacity could be an issue. For example, responding to requests during major releases or to requests that require a significant amount of resources can be challenging. This was confirmed by external clients who noted that responsiveness was uneven at times, with some requests being delayed or not fulfilled.
In general, the main reasons for not fulfilling requests, according to program representatives, were concerns over quality and/or confidentiality.
The evaluation found that proactive preparation for releases may help manage some requests. For example, in MWTD, because there are many requests for detailed data, the dissemination group develops tables in advance that take into consideration accuracy and confidentiality. These tables allow the dissemination group to skip the analysis needed to determine whether or not the statistical information can be shared. This increases responsiveness since clients no longer need to go through a pre-assessment stage.
Finally, some key informants and program representatives indicated that cost was also a barrier for customized products and cost-recovered surveys. Over the last few years, the program noted the loss of some cost-recovery surveys. Confidentiality and long turnaround times were also cited as reasons.
Accuracy
The vast majority of survey respondents reported they were either satisfied or very satisfied with the accuracy of the data (88.5%). This level of satisfaction was also confirmed during interviews, where the majority indicated that accuracy was high or at least suitable for their needs. A review of accuracy indicators from 2015 to 2017 found that the program adequately met its targets (Table 1).
Table 1 - Level of accuracy of the MWTRSIP surveys
Percent of estimates meeting their target for coefficient of variationFootnote 13
99.4%
95.5%
96.7%
Percent of surveys meeting their response rate target (target 85%)
96.6%
86.9%
84.9%
Mission-critical monthly surveys
Mean absolute revisions for monthly survey of manufacturing—total sales (target 0.5)
0.35
0.35
0.20
Mean absolute revisions for monthly survey of manufacturing—total inventories (target 0.5)
0.25
0.14
0.17
Mean absolute revisions for monthly survey of wholesale trade—total sales (target 0.5)
0.20
0.36
0.24
Mean absolute revisions for monthly survey of wholesale trade—total inventories (target 0.5)
0.12
0.25
0.39
Mean absolute revisions for monthly survey of retail—total sales (target 0.5)
0.24
0.22
0.44
Table note 1
Preliminary estimates based on partial data and trends compiled by the Evaluation Division, sourced from corporate indicator information and historical CANSIM tables.
In addition, the majority of survey respondents (75.4%) and interviewees stated that the existing revision rates for monthly mission-critical surveys were acceptable. Interviewees believed the revisions were minor and, in most cases, did not impact the story.
While there was overall satisfaction with accuracy, there were some concerns raised about the variability of estimates at lower levels of detail. Some informants (external and internal) had questions about the reliability of annual estimates since the implementation of the Integrated Business Statistics Program (IBSP) in 2013. The evaluation found that, while the accuracy level generally remained within targets during the implementation, there was some decline. The imputation of data for establishments was also questioned by internal users, especially for small entities. During discussions with some program representatives, they confirmed that additional work is now required to ensure accuracy and that they no longer release information at the five- to six-digit levels because of concerns with accuracy (e.g., Annual Survey of Manufacturing and Logging [ASML]).
Coherence and interpretability
Although they were generally satisfied with the coherence of the data, key informants were nonetheless dissatisfied with how the break in series, which occurred when surveys were transferred to the IBSP, was handled. They indicated that, to date, no information has been made available to determine the detailed magnitude of the impact.Footnote 14
Both internal and external users noted that there were challenges when comparing monthly estimates with annual estimates (such as between the Monthly Survey of Manufacturing [MSM] and the ASML) and when examining sectors across surveys (i.e., manufacturing vs. wholesale vs. retail). Program representatives explained that reconciliations between monthly and annual surveys are problematic since different methodologies are used and annual periods may differ between businesses (e.g., some may use calendar years while others use fiscal years or different periods). Furthermore, annual and monthly surveys serve different purposes—annual for structural aspects and monthly for trends/indicators. In terms of comparability with external data, some interviewees felt that the categorizations and breakdowns used by Statistics Canada were not always consistent with the way retailers categorized commodities or how other research firms reported data.
In terms of interpretability, several areas of improvement were mentioned. Some key informants indicated that definitions accompanying data can be difficult to understand, especially for e-commerce. A need for more and better documentation was identified (e.g., to help better interpret the accuracy of the estimates, information on who is being sampled and how this is achieved, descriptions of survey developments, seasonal adjustments, and how data should be transformed). A review of the Integrated Metadatabase based on a sample of surveys indicated that important information such as response rates and accuracy values either was not systematically updated or was simply missing, especially for 2013 and 2014. Program representatives noted that providing coefficients of variation required several days of work and resources and that they preferred to update the information periodically.
Finally, aggregated variables such as "other expenditures" or "miscellaneous subsector" hindered users from getting a complete picture. For instance, important variations in the wholesale sector are sometimes caused by the "miscellaneous subsector."Footnote 15
2.5. Quality—timeliness
Evaluation question
To what extent does the MWTRSIP provide statistical information that adequately balances users' needs for timeliness and data accuracy?
In the evaluation, the quality dimension of timeliness was explored more in depth. More specifically, respondents and interviewees were first asked whether they wanted more timely data, and then they were asked how their responses would be different if there was an impact on accuracy.
Timeliness
In terms of levels of satisfaction with the current release timelines, the evaluation found a difference between survey respondents/internal users and interviewees. Among survey respondents, 82%Footnote 16 indicated that they were satisfied with the current release times, and internal users within the agency also expressed a high level of satisfaction with release times for monthly surveys. The percentage was lower, however, for interviewees (roughly 55%). Interviewees had issues that extended to all domains (i.e., manufacturing, retail trade, wholesale, and the service industry) and covered both annual and monthly surveys.
When asked about the timeliness of annual surveys, the very few intervieweesFootnote 17 who used these products stated that it would be useful to have the estimates a maximum of 12 months after the reference period, as opposed to 18 months, and it was acknowledged that there had been a great improvement with the release of the ASML. Among survey respondents, 52%, especially provincial and municipal users, indicated that shortening the annual releases to 12 months would have a positive impact on their analysis and economic monitoring. There were also indications that the current release times for some culture surveys were too long (as the frequency of some surveys was 24 months) and that this impacted the relevance of the information.
Survey respondents and interviewees were specifically asked about increasing the frequency of the Retail Commodity Survey from quarterly to monthly. While most viewed it positively, they noted that it was not a high priority for them.
Program data on the release times for annual surveys suggest there were challenges in meeting release targets. In 2013 and 2014, 91% and 53%, respectively, of the annual statistical products did not meet Statistics Canada's internal release standard of 18 months. Starting in 2015, improvements were found, and this trend has since continued. Evidence from internal interviews confirmed that there were challenges as a result of the implementation of the IBSP, electronic questionnaires and the 2012 NAICS from 2013 to 2015. Consistent with these findings, internal interviews found that, starting in 2015, implementation issues began to be resolved, and there has since been a gradual return to meeting release times and even beating them in some cases. In the case of the ASML, additional funding from Global Affairs Canada helped to shorten the release time to 12 months.
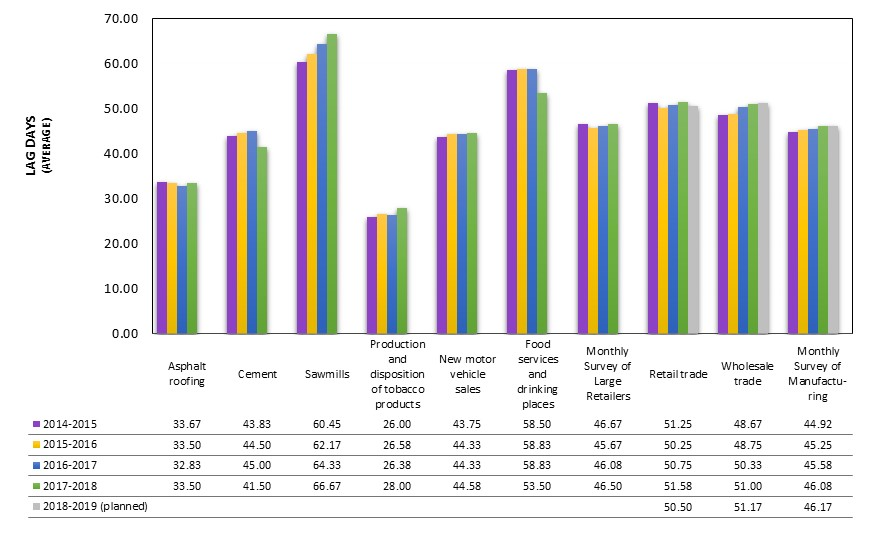
Figure 1 - Number of lag days after reference period (on average) for monthly surveys
Description for Figure 1 - Number of lag days after reference period (on average) for monthly surveys
This vertical bar chart shows the number of lag days after reference period (on average) per monthly survey, from fiscal years 2014-2015 to 2017-2018. This bar charts also shows the planned number of lag days after reference period (on average) per monthly survey for fiscal year 2018-2019. The following data table provides further details:
Number of lag days after reference period (on average) for monthly surveys covering the period of 2014-2015 to 2018-2019.
Asphalt roofing
Cement
Sawmills
Production and disposition of tobacco products
New motor vehicle sales
Food services and drinking places
Monthly survey of large retailers
Retail trade
Wholesale trade
Monthly survey of manufacturing
2014-2015
33.67
43.83
60.45
26.00
43.75
58.50
46.67
51.25
48.67
44.92
2015-2016
33.50
44.50
62.17
26.58
44.33
58.83
45.67
50.25
48.75
45.25
2016-2017
32.83
45.00
64.33
26.38
44.33
58.83
46.08
50.75
50.33
45.58
2017-2018
33.50
41.50
66.67
28.00
44.58
53.50
46.50
51.58
51.00
46.08
2018-2019 (planned)
-
-
-
-
-
-
-
50.50
51.17
46.17
An examination of administrative data revealed that the release times for two monthly mission-critical surveys (i.e., MSM and MWTS) were gradually becoming longer (Figure 1). Specifically, the average release time for the MSM was 45.25 days in 2015/2016 and is anticipated to be 46.17 days for 2018/2019. Similar results were observed for the average release times for the MWTS. In 2015/2016, the number of days to release was 48.75 days and is projected to be 51.17 days in 2018/2019. For monthly retail trade, the trend has been roughly flat. On the other hand, lag days improved for surveys such as the Cement SurveyFootnote 18 and the Monthly Survey of Food Services and Drinking Places.
External interviewees indicated that they would like to have earlier release times for the three mission-critical surveys, especially wholesale and retail information. Having this information earlier would allow users to more expeditiously examine current trends and seasonal impacts to make important decisions and forecasts for their businesses. For example, retailers would like to have information sooner on sales leading up to Christmas to better plan their purchases and inventories.
Accuracy versus timeliness
Overall, it appears that although users and stakeholders would like data sooner, they were generally not willing to give up much accuracy to achieve it.
When survey respondents were asked, "how important is the timeliness of the statistical information for your work compared to its accuracy?" only 14.3% stated that timeliness was more important. For interviewees, roughly half stated that no trade-off between accuracy and timeliness was acceptable to them, while the remainder indicated they would be willing to accept only a small loss in accuracy.
To explore this trade-off further, four scenarios were presented:
Accuracy versus timeliness
Scenario
Impact on time
Revisions required
(a) A little sooner
Less than five days earlier than current situation
Slightly greater than currently
(b) Moderately sooner
5 to 10 days earlier than current situation
Moderately greater than currently
(c) Much sooner
Advance indicators released 10 to 20 days earlier, and then final results released as per current timelines
Substantially greater than currently
(d) No changes / status quo
For survey respondents, 54% wanted the status quo (Scenario D), followed by Scenario B (18.6%), Scenario A (15.3%) and finally Scenario C (11.9%).
For interviewees, their preferences were roughly the same—approximately half chose the status quo, followed by Scenario B, then Scenario A and finally Scenario C. Notably, only one of the key informants preferred Scenario C. It was interviewees from financial institutions who were more likely to indicate they wanted earlier release times at the expense of some accuracy. They indicated that they would like to have the releases anywhere from 15 to 30 days after the reference period to produce GDP estimates. They did acknowledge, however, that although they wanted the data sooner, they would not want very large revisions.
Two factors may explain these results. Several respondents stated that the proposed scenario timelines ranging from a few days to a week and half would have no impact on their work; for them, the trade-off was not worth it. Another factor could be related to the structure of the Canadian economy. As mentioned in a C.D. Howe Institute report, "Because Canada's economy has less global importance and is dependent on trends in the US economy, users of Canadian data are more willing to trade less timeliness for more accurate data."Footnote 19
When asked to prioritize the types of data they would want earlier, key informants and survey respondents chose retail information first, followed by manufacturing data and then wholesale data. In terms of the type of statistics, sales data were the most preferred. Impacts of having data earlier included the ability to report, publish and provide more timely analysis to clients, especially in the area of retail food sales in grocery and department stores. Interestingly, over 70% of survey respondents indicated they do not need any specific monthly data released earlier.
Other potential opportunities to increase timeliness
The evaluation found other potential opportunities to increase timeliness without necessarily impacting accuracy. First, there are opportunities to improve timeliness by providing less contextual analysis with the data release. Among survey respondents, 68% indicated their willingness to sacrifice contextual analysis for more timely data, largely because they develop their own contextual analysis. However, they specified that explanations around accuracy and methodological changes should remain.
Another option is to set more targeted release dates. Evidence indicates that it is up to the unit responsible for a release to decide the release date and that there is minimal communication between units when establishing release dates. Coordination with the other monthly release dates could be improved to ensure that information is timelier for financial organizations who indicated they wanted data prior to the monthly GDP release.
Collaboration between program representatives and stakeholders could also improve timeliness. A best practice shared by program representatives is the collaboration between key associations, businesses, service areas and monthly food survey representatives to increase the timeliness of the survey by a week. They worked closely for six months to determine the appropriate balance between the revision rate, timeliness and response rate of the survey.
2.6. Utilization of resources
Evaluation question
Have the MWTRSIP's resources been used as planned?
The evaluation assessed the extent to which the MWTRSIP, including the subject-matter areas and the dedicated internal enablers, used their resources as planned. Evidence indicated that the management of financial resources was challenging because of changes in program operations and resources during the scope of the evaluation.
During the evaluation period, the program went through several reorganizations. The most significant occurred in early 2014 when
the Manufacturing and Wholesale Trade programs were merged into one new division, the Manufacturing and Wholesale Trade Division (MWTD)
the Service Industries Division and the Retail Trade Program were merged into one new division, the Retail and Service Industries Division (RSID)
the Distributive Trades Division was disbanded.
To ensure consistency over the evaluation period, the financial information was allocated at the activity element level.
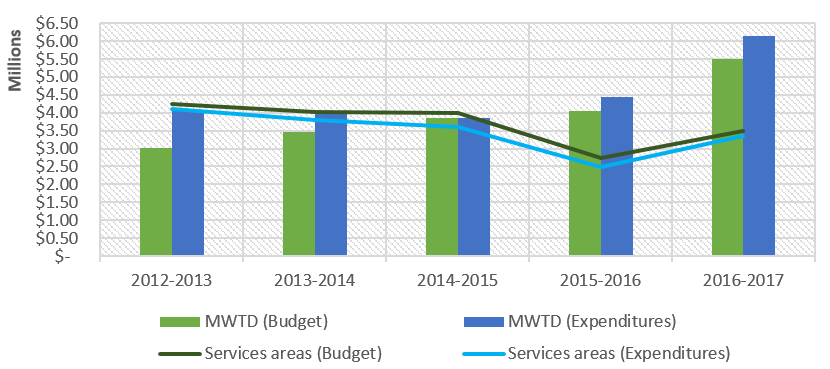
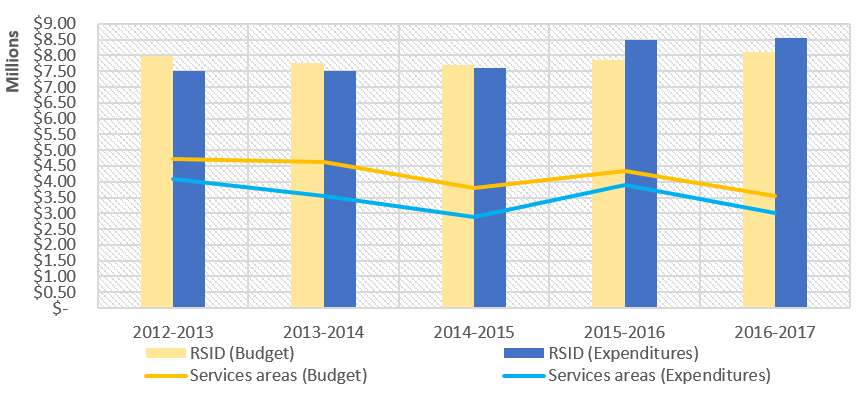
Program spending over the five-year period of the evaluation was approximately $96.8 million (excluding operation and maintenance).Footnote 20 From fiscal year 2012/2013 to 2016/2017, financial information shows that expenditures for activities related to MWTD were continuously over budget (Figure 2). For RSID, financial figures indicated that from 2012/2013 to 2014/2015, the expenditures were below budget, and that program expenditures began exceeding budget starting in 2015/2016, mainly because of an increase in salary expenditures (Figure 3).Footnote 21
Figure 2 - Manufacturing and wholesale trade program portion—current budget vs. expenditures, from 2012/2013 to 2016/2017Footnote 22
Description for Figure 2 - Manufacturing and wholesale trade program portion—current budget vs. expenditures, from 2012/2013 to 2016/2017
This vertical bar chart shows, in millions of dollars, the budgets and expenditures of the Manufacturing and Wholesale Trade Division and other internal services divisions (i.e. services areas) to support activities related to manufacturing and wholesale trade industries, from 2012/2013 to 2016/2017. The following data table provides further details:
Manufacturing and wholesale trade program portion—current budget vs. expenditures, from 2012/2013 to 2016/2017
Fiscal year
Budget for MWTD
Expenditures from MWTD
Budget for Services areas
Expenditures from Services areas
($)
2012-2013
3,016,773
4,037,549
4,238,504
4,109,879
2013-2014
3,461,523
3,966,245
4,026,513
3,793,953
2014-2015
3,844,667
3,855,323
3,989,848
3,608,637
2015-2016
4,051,142
4,435,088
2,736,823
2,471,826
2016-2017
5,491,355
6,132,712
3,489,729
3,338,610
Figure 3 - Retail and service program portion—current budget vs. expenditures, from 2012/2013 to 2016/2017Footnote 23
Description for Figure 3 - Retail and service program portion—current budget vs. expenditures, from 2012/2013 to 2016/2017
This vertical bar chart shows, in millions of dollars, the budgets and expenditures of the Retail and Service Industries Division and other internal services divisions (i.e. services areas) to support activities related to retail and service industries, from 2012/2013 to 2016/2017. The following data table provides further details:
Retail and service program portion—current budget vs. expenditures, from 2012/2013 to 2016/2017
Fiscal year
Budget for RSID
Expenditures from RSID
Budget for Services areas
Expenditures from Services areas
($)
2012-2013
7,971,565
7,503,341
4,718,489
4,102,078
2013-2014
7,774,889
7,497,920
4,615,559
3,546,565
2014-2015
7,712,631
7,599,887
3,813,794
2,869,217
2015-2016
7,857,433
8,477,640
4,332,785
3,912,958
2016-2017
8,101,187
8,550,582
3,555,286
3,020,134
During the period covered by the evaluation, the budgets allocated to services areas, such as collection, significantly exceeded expenditures reported by them; this gap had shrunk by the end of the evaluation period.Footnote 24
Finally, financial figures indicated that from 2012/2013 to 2016/2017, revenue from cost recovery increased by 450%, mainly because of the additional funding from Global Affairs Canada, while the number of projects declined.
2.7. Efficiency
Evaluation questions
Are MWTRSIP activities sufficiently integrated and coordinated to support the achievement of results?
Are there any implementing factors that are impacting the efficiency of the MWTRSIP?
Governance and management
Findings indicated that appropriate governance mechanisms were in place and that there was effective collaboration and coordination with internal users and service areas to ensure sound management and monitoring of key strategic and operational issues, data discussions and information sharing, and implementation of projects. These governance mechanisms included weekly senior-level and chief-level meetings, data discussion groups, steering committees, working groups, and bilateral divisional management meetings.
At the operational level, the reorganization of the divisions and the relocation of employees to the same floor helped facilitate day-to-day exchanges among employees, especially within MWTD. The merger of the Wholesale unit and the Manufacturing unit into the same division led to improved communications, problem-solving capacity (solving complex data issues and reporting issues) and expertise. In comparison, evidence indicated that there was less coordination within RSID since there was a less natural connection between retail and services. Between the two divisions, coordination is also limited because of the nature of the programs and the work.
In terms of management of the program, a number of representatives indicated the need for more guidance. Staff were being asked to maintain their regular activities, work on initiatives identified during past consultations to fill data and information gaps, and explore new projects to support Statistics Canada's modernization initiatives. According to interviews, staff were often asked to perform all these tasks using the same level of resources. To meet these demands, many program representatives indicated that they needed clearer direction from management (including senior management) on where to put their efforts.
A few representatives indicated that the solution to managing multiple priorities resides in strategic thinking within the division and across the program. They felt that knowledge sharing and discussions about where to gain efficiencies were limited. There were opportunities to share lessons learned and best practices, to use common standards across the divisions for similar survey processes (e.g., monthly surveys), to review processes and eliminate low value-added activities, to review the organization of work, and to examine survey sequencing to facilitate the sharing of employees across surveys and divisions.
Concerted efforts between divisions can result in significant added value to users. A good example of this was the coordinated work done in response to the Fort McMurray wildfires in 2016. The three mission-critical survey teams joined together to create an electronic questionnaire (EQ) module that allowed for ad hoc questions to measure the impact of specific events or phenomena on the economy. Another example was the work taking place to streamline the two-phased sampling of the annual surveys to expedite the pre-collection phase and deliver results faster.
Common tools and processes
Statistics Canada implemented major projects starting in 2009 in an effort to be more efficient, robust and responsive to user needs. The implementation of the IBSP was aimed at improving data quality by standardizing and improving sampling quality and timeliness while reducing response burden and ongoing costs to realize efficiency.Footnote 25 Another opportunity for efficiency for the agency was the move of all business surveys into the Business Collection Portal environment. This included the adoption of an electronic questionnaire—the primary mode of collection. Efficiency came from reducing the number of different software platforms, implementing new processes and tools, and increasing the proportion of electronic responses.
As mentioned previously, although the adoption of common tools will yield long-term benefits and efficiency, the transition had an impact on the program's capacity to maintain the quality of its outputs and on employee work-life balance (increased stress, frustration and overtime).
Many program representatives also indicated frustration with the lengthy transition process. They felt that the EQ system was less efficient because of a heavy bureaucratic process and that it was less effective. More specifically, it is now difficult to change survey elements and, when changes do take place, many errors occur and extensive revisions are required. This has translated into more time and effort being spent to ensure that changes are correct and that there are no errors. It was also noted that changes are costly and have created frustration with cost-recovered survey clients. Better communication and coordination between the groups would be helpful.
3. How to improve
SWOC analysis
Strengths
Statistical information does not duplicate any other source
Program representatives have a good understanding of the current and emerging needs
Consultation mechanisms are adequate to identify user needs and opportunities
Good quality and trust
Recognized expertise and professionalism
Use of common tools to standardize processes
Weaknesses
Lack of cohesion and vision around e-commerce and new economy (agency-wide)
Scope and frequency of releases on services information do not respond to user needs
Gaps in outreach activities and service delivery
Management of competing priorities (clarification and allocation of resources) and conflicting resources
Opportunities
New economy and cross-functional information increase opportunities for new products and collaboration
Openness of main stakeholders and businesses to collaborate and share information
Increase in collaboration within and across divisions to innovate and gain efficiencies
Challenges
Satisfying diverse needs from a wide range of stakeholders in a timely manner
Lack of program understanding among users
Measurement of rapidly evolving domains such as the new economy
Lack of agility of processes such as EQ
Need for more disaggregated information (geographical and five- or six-digit NAICS level)
Recommendations
Recommendation 1: Data gaps
The evaluation found that the program maintains effective relationships with its users and stakeholders and, as a result, has a good understanding of the gaps in the program. Comprehensive consultations took place during the evaluation period, and the program used the information gathered to develop plans to address as many gaps as possible within their resource allocation.
It is recommended that plans address the following key gaps:
E-commerce and the new economy—an agency-wide approach is required, given that the subject spans several programs. While efforts are currently underway in several areas, there is a lack of coordination, roles and responsibilities are not clear, and senior management engagement needs to increase.
Greater level of detail—over time, there has been a loss of detail for users. The MWTRSIP should continue working with key partners and stakeholders (internal and external) to explore avenues to address this.
Data on services—while services make up a large share of the economy, statistical information is rather limited. It is recommended that the MWTRSIP explore opportunities to increase the frequency of its surveys and to increase the scope of the services covered.
In exploring these gaps, the program should continue to use a strong user-centric approach.
Recommendation 2: Timeliness
There were mixed results regarding the level of satisfaction with the timeliness of releases (82% of survey respondents and 55% of interviewees were satisfied with the current release times). When presented with different scenarios trading off timeliness for accuracy, users were generally unwilling to give up accuracy (with more than half preferring the status quo). Some users noted they would be willing to accept a loss in quality for more timely information during their peak seasons (e.g., retail data around Christmas).
It is recommended that the MWTRSIP
review its process for releases to ensure they are as timely as possible, taking into consideration other key objectives such as relevance and accuracy; this includes exploring the possibility of reducing contextual analysis to improve timeliness and targeting and coordinating the setting of release dates
undertake a comprehensive consultation of its key users prior to taking any steps to improve timeliness that would impact accuracy.
Recommendation 3: Priority setting
The MWTRSIP is currently trying to address gaps/needs identified during previous consultations, and respond to the modernization agenda and other agency initiatives. These activities are in addition to its regularly mandated program.
It is recommended that during this transitional period, MWTRSIP management provide greater clarification on priorities to employees.
Recommendation 4: Outreach and client services
Given the rapid evolution taking place in the program, and the broad, diverse range of users, it is vital that the MWTRSIP maintain strong relationships with users and actively promote its statistical information. During the evaluation, evidence was found of ongoing awareness-raising activities, but little evidence was found of a strategic element such as a written plan.
Client services are a key contact point with users. During discussions on access and cost-recovery services with interviewees, it was noted by several that client services could be improved. More specifically, it was noted that the level and quality of responsiveness were inconsistent (e.g., being less responsive during peak periods).
It is recommended that the MWTRSIP
develop and implement a comprehensive outreach plan based on information from consultations, staff and other relevant partners (internal and external); the plan should include mechanisms for ongoing communication with users to inform them of program developments and to raise awareness
prepare a strategy to strengthen client service delivery.
4. Management response and action plan
Recommendation 1
The evaluation found that the program maintains effective relationships with its users and stakeholders and, as a result, has a good understanding of the gaps in the program. Comprehensive consultations took place during the evaluation period, and the program used the information gathered to develop plans to address as many gaps as possible within their resource allocation.
It is recommended that plans address the following key gaps:
E-commerce and the new economy—an agency-wide approach is required, given that the subject spans several programs. While efforts are currently underway in several areas, there is a lack of coordination, roles and responsibilities are not clear, and senior management engagement needs to increase.
Greater level of detail—over time, there has been a loss of detail for users. The MWTRSIP should continue working with key partners and stakeholders (internal and external) to explore avenues to address this.
Data on services—while services make up a large share of the economy, statistical information is rather limited. It is recommended that the MWTRSIP explore opportunities to increase the frequency of its surveys and to increase the scope of the services covered.
In exploring these gaps, the program should continue to use a strong user-centric approach.
Statement of agreement or disagreement
Management agrees with the recommendation.
Management response
E-commerce
The measurement of e-commerce and the new economy will be fully explored as part of the framework for measuring the digital economy. Measurement elements across the agency are already underway and progress has been made regarding coordination and governance.
The MWTRSIP recognizes the increasing economic importance of e-commerce and has recently added e-commerce modules to most surveys, as well as new questions related to the digital economy to a number of culture and other surveys. MWTRSIP management will become more active on the Subject-Matter Committee on Digital Economy Statistics with the ISTD and the Digital Economy Satellite Account with the National Economic Accounts Division to improve the exchange of information between divisions currently working on the digital economy and to help ensure a collaborative effort on digital commerce.
Greater level of detail
The MWTRSIP currently has a number of projects underway to enhance data products to respond to user requirements in terms of published detail.
Specifically, for RSID:
pilot a "census of tax" approach to producing financial estimates that will allow us to publish more geographical detail for financial estimates
released six new CMAs for the MRTS in January 2019
investigate different suppression patterns to minimize the loss of published information while ensuring the appropriate level of protection for confidential cells
redesign the New Motor Vehicle Survey and New Motor Vehicle Dealer Commodity Survey—this will improve the quality and coherence of motor vehicle data
work with third-party data providers to explore, encourage and pursue the use of point-of-sale information in the interest of response burden relief
publish the Retail Commodity Survey on a monthly basis
produced details on recreational cannabis in December 2018.
Specifically, for MWTD:
reduce the number of suppressed cells in monthly surveys
add CMA-level estimates for manufacturing—annual for 11 CMAs released in November 2016, monthly for 12 CMAs to come later in 2019
increase the sample for wood product manufacturing industries, and administer a supplemental questionnaire to gather (and, if possible, disseminate) more detailed commodity information
work with Methodology to improve the quality of the ASML so that greater industrial detail (lost with the move to the IBSP and, consequently, with the move from a census to a sample) will be made available
produce cannabis-specific activity in wholesale and manufacturing programs.
Data on services
RSID's capacity to improve the frequency and increase the scope of services covered using traditional survey methods is limited by budget constraints. However, efforts are ongoing to identify opportunities to integrate alternative data sources into our statistical processes. This will be a critical component of our capacity to improve the frequency and increase the scope of services covered. RSID has recently released financial estimates for private residential care facilities and will be releasing estimates on home health care shortly based on tax data exclusively.
Data on services
Timeline
Deliverable(s)
Responsible party
March 2021
Delivery of a comprehensive plan for measuring the digital economy.
Assistant Chief Statistician Economic Statistics
Immediate
RSID to actively participate in multi-divisional work groups related to e-commerce.
Director, RSID
March 2020
Delivery of planned improvements to product detail, as listed in Management Response above.
Directors, RSID and MMWTD
March 2020
Delivery of a strategy on administrative sources (e.g., scanner data) for RSID.
Director, RSID
Recommendation 2
There were mixed results regarding the level of satisfaction with the timeliness of releases (82% of survey respondents and 55% of interviewees were satisfied with the current release times). When presented with different scenarios trading off timeliness for accuracy, users were generally unwilling to give up accuracy (with more than half preferring the status quo). Some users noted they would be willing to accept a loss in quality for more timely information during their peak seasons (e.g., retail data around Christmas).
It is recommended that the MWTRSIP
review its process for releases to ensure they are as timely as possible, taking into consideration other key objectives such as relevance and accuracy; this includes exploring the possibility of reducing contextual analysis to improve timeliness and targeting and coordinating the setting of release dates
undertake a comprehensive consultation of its key users prior to taking any steps to improve timeliness that would impact accuracy.
Statement of agreement or disagreement
Management agrees with the recommendation.
Management response
Setting release dates
Fixed release dates for the mission-critical monthly surveys are set a year in advance in consultation with the macroeconomic accounts that they feed into. These dates are published on the Statistics Canada website and are adhered to exactly. For other surveys (IBSP annuals, commodity-specific annuals and monthlies), the collection and processing schedules determine the possible turnaround time and, therefore, the planned release dates.
The MWTRSIP follows a formal process to establish release dates that take into account collection and processing schedules and production capacity while striving to improve timeliness. In addition, policies regarding Daily releases (maximum of two major releases on each day) can limit options for earlier release dates. Most products were released as scheduled following the initial transition period to the IBSP.
The MWTRSIP is continually monitoring the timeliness of program outputs and seeking efficiencies, whether within its own programs or in its support services, to reduce time to release when warranted.
Reducing contextual analysis
Contextual analysis, such as The Daily, adds a maximum of two days to the monthly production cycle. Doing away with it would save time, but would also increase the burden on analysts to provide background to users, such as external analysts. An analytical focus is also a critical step in data quality assurance. Having said that, the MWTRSIP is investigating the use of natural language generation software to accelerate the production of Daily articles.
Comprehensive consultation on changes
Through ongoing consultation with stakeholders, the Mining, Manufacturing and Wholesale Trade Division (MMWTD) will consult key users prior to taking any steps to improve timeliness that would impact accuracy.
Comprehensive consultation on changes
Timeline
Deliverable(s)
Responsible party
March 2020
Initiate discussion at the senior management level on the necessity of contextual analysis and possible replacement by tools such as artificial intelligence.
Director General, Industry Statistics
March 2020
Seek funding (API) to produce a report/strategy on the feasibility of releasing flash estimates of retail sales during peak periods, and consult stakeholders on its merits.
Directors, RSID and MMWTD
March 2020
Identify impediments to releasing annual survey data within 12 months of the end of the reference period and develop strategies, in consultation with our internal partners, to overcome them.
Directors, RSID and MMWTD
March 2020
Explore the feasibility of streamlining operational processes in consultation with internal service areas to improve the timeliness of our sub-annual programs. An assessment of the impact on data quality will also be undertaken.
Directors, RSID and MMWTD
March 2020
Review the method of establishing internal release date targets.
Directors, RSID and MMWTD
March 2020
Assess natural language generation software to reduce time to write The Daily.
Director MMWTD
Recommendation 3
The MWTRSIP is currently trying to address gaps/needs identified during previous consultations, and respond to the modernization agenda and other agency initiatives. These activities are in addition to its regularly mandated program.
It is recommended that during this transitional period, MWTRSIP management provide greater clarification on priorities to employees.
Statement of agreement or disagreement
Management agrees with the recommendation.
Management response
Clarification on priorities
MWTRSIP fully expects communication with employees to improve as IBSP processes have now been fully implemented, and as the modernization agenda is better understood and continues to be communicated and deployed throughout the agency.
MWTRSIP management will continue to use multiple avenues to communicate priorities in response to changing agency initiatives and transition periods, including
regular management and staff meetings to discuss progress and issues
management meetings
divisional meetings
regular communication through email
encouragement for all supervisors to meet regularly with staff.
Clarification on priorities
Timeline
Deliverable(s)
Responsible party
December 2019
Consult with employees to determine if additional or different avenues are required and seek opportunities to improve communications.
Directors, RSID and MMWTD
Recommendation 4
Given the rapid evolution taking place in the program, and the broad, diverse range of users, it is vital that the MWTRSIP maintain strong relationships with users and actively promote its statistical information. During the evaluation, evidence was found of ongoing awareness-raising activities, but little evidence was found of a strategic element such as a written plan.
Client services are a key contact point with users. During discussions on access and cost-recovery services with interviewees, it was noted by several that client services could be improved. More specifically, it was noted that the level and quality of responsiveness were inconsistent (e.g., being less responsive during peak periods).
It is recommended that the MWTRSIP
develop and implement a comprehensive outreach plan based on information from consultations, staff and other relevant partners (internal and external); the plan should include mechanisms for ongoing communication with users to inform them of program developments and to raise awareness
prepare a strategy to strengthen client service delivery.
Statement of agreement or disagreement
Management agrees with the recommendation.
Management response
Comprehensive outreach plan
As it has done in previous years, the MWTRSIP continues to maintain ongoing and effective relationships with its users and stakeholders and, as a result, has a good understanding of the gaps in the program. Comprehensive consultations have taken place recently. Future consultations will include a requirement to communicate program developments and increase awareness of the program.
We prepare weekly check-ins on upcoming outreach activities, biweekly summaries for senior management briefings on the Industry Statistics Branch, and an outreach report on an annual basis.
Client service delivery
The MWTRSIP is committed to serving its clients in a prompt, reliable, courteous and fair manner that will meet or exceed Statistics Canada's Standards of Service to the Public. To this end, MWTRSIP management will adopt a strategy to strengthen client service delivery training that will include Client Relationship Management System (CRMS) training, clear communication from management of Statistics Canada's standards of service, clear expectations to meet or exceed these standards, and central tracking of progress of all client requests to assess results.
Methods for marketing existing products better are also being explored.
Client service delivery
Timeline
Deliverable(s)
Responsible party
March 2020
Pursue opportunities to build awareness within our existing outreach plan by requiring Statistics Canada attendees to inform stakeholders of existing program outputs and current development activities when appropriate.
Directors, RSID and MMWTD
March 2020
Work with regional offices to identify gaps in client awareness and in improving their understanding of our program outputs.
Directors, RSID and MMWTD
March 2020
Assess client service requests (CRMS) to help identify gaps in awareness and outreach opportunities.
Directors, RSID and MMWTD
March 2020
Review current practices and implement a strategy to ensure that Statistics Canada service standards are met. Targeted training will be explored.
Directors, RSID and MMWTD
Appendix 1: Program description
The Manufacturing, Wholesale Trade, Retail and Service Industries Program (MWTRSIP) plans, directs, coordinates and controls the provision of statistical information and advice on distributive trades, manufacturing, and service industries to governments, private organizations and institutions. The program supplies the Canadian System of Macroeconomic Accounts with data required by the Federal-Provincial Fiscal Arrangements Regulations, and the Special Data Dissemination Standard with the International Monetary Fund. Data are required as part of Canada's participation in the North American Free Trade Agreement under the snapback provision, and under the Bank Act, section 427. The program also satisfies the information requirements of federal government departments, provincial governments, international organizations, industry associations, the academic community and the public at large.
The Manufacturing and Wholesale Trade Division (MWTD) and the Retail and Service Industries Division (RSID) are the two divisions responsible for compiling, analyzing and disseminating the broad range of comprehensive and integrated statistics that depict the production, sales, financial operations and product types for the manufacturing, retail and wholesale sectors, and a number of service sectors in Canada. Together, they represent 15 of the 24 sectors as classified in the North American Industry Classification System (NAICS) and account for a significant part of Canada's gross domestic product (GDP)Footnote 26 and employment.
MWTD and RSID function as separate operational and financial entities, each with a unique set of outputs and each with its own organizational structure.
Manufacturing
The manufacturing and logging sectors comprise establishments that are primarily engaged in the chemical, mechanical or physical transformation of materials or substances into new products (NAICS groupings 31-33, manufacturing). These products may be finished, in the sense that they are ready to be used or consumed, or semi-finished, in the sense of becoming an input for an establishment to use in further manufacturing. Related activities—such as assembling component parts of manufactured goods; blending materials; and finishing manufactured products by dyeing, heat-treating, plating and similar operations—are also treated as manufacturing activities.
MWTD disseminates information via monthly and annual Common Output Data Repository tables,Footnote 27 online publications and special tables for clients. The wide range of indicators of economic activity for the manufacturing program includes
monthly estimates of sales, inventories, and the value of unfilled orders and new orders for 28 manufacturing industry aggregates, provincially and nationally
monthly estimates of production and destination of shipments of asphalt roofing, sawmill products, and production and disposition of tobacco productsFootnote 28
annual indicators of manufacturing revenue, employment, salaries and wages, cost of materials and supplies used, cost of energy and water utilities, inventories, and information about commodities produced and used in the production process (e.g., supplement to ASML).
Wholesale and retail
The wholesale trade sector provides the link between producers and retailers of goods in both the domestic and the global economies. Many wholesalers are organized to sell merchandise in large quantities to retail business and institutional clients. However, some wholesalers—in particular those that supply non-consumer capital goods—sell merchandise in single units to final users. This sector comprises two main types of wholesalers: merchant wholesalers that sell goods on their own account, and brokers that arrange sales and purchases for others generally for a commission or fee.
The retailing process is the final step in the distribution chain of merchandise. The retail trade sector comprises establishments primarily engaged in retailing merchandise, generally without transformation, and rendering services incidental to the sale of merchandise. Retailers are organized to sell merchandise in small quantities to the general public, which then becomes a primary indicator of consumer demand. The sector comprises two main types of retailers, store and non-store. The store retailers operate fixed point-of-sale locations, located and designed to attract a high volume of walk-in customers. The non-store retailers reach customers and market merchandise with methods such as the broadcasting of infomercials, the broadcasting and publishing of direct-response advertising, the publishing of traditional and electronic catalogues, door-to-door solicitation, in-home demonstration, the temporary displaying of merchandise (stalls), and distribution by vending machines.
MWTD is responsible for producing statistics on a monthly and annual basis for the NAICS grouping 41 (wholesale trade) by industry and geographical detail. Similar information is produced for the NAICS grouping 44-45 (retail trade) by RSID. Together, the two programs disseminate Common Output Data Repository tables and special tabulations for clients on
annual information on the operating revenues, expenditures and inventory of wholesalers and retailers
monthly estimates of sales, inventories and inventories/sales ratio for wholesalers
monthly estimates of sales for retailers
the monthly commodity breakdown of national retail sales for a panel of about 80 large retail enterprises
the quarterly commodity breakdown of retail sales by geographical detail
sales of new motor vehicles in units and in dollars by vehicle type, origin of manufacture and region.
Services
The service sector is characterized by establishments primarily engaged in activities where human capital is the major input. These establishments make available the knowledge and skills of their employees to create added value as opposed to producing tangible goods. Statistics covering only a portion of the service sector are in scope for RSID as other divisions produce service (education, transportation, tourism, etc.) indicators as well. The indicators produced by RSID cover portions of the following service sectors on an annual basis:
real estate and rental and leasing (53)
professional, scientific and technical services (54)
information and cultural industries (51)
administrative and support, waste management and remediation services (56)
accommodation and food services (72)
other services (except public administration) (81)
management of companies and enterprises (55)
arts, entertainment and recreation (71).
The output of the program consists of a series of annual indicators by industry and province for various types of revenues and expenses, inventories and exports.
Aside from financial data, the program disseminates a broad range of information on specific characteristics of the different service industries, such as distribution of sales by type of client (engineering services), number of screens (motion picture theatres), advertising and circulation revenue (periodical publishers), etc.
The program also disseminates a monthly indicator of the value of restaurant, caterer and drinking place sales by province and territory and by industry.
Internal processes
Information for manufacturing, wholesale, retail and service estimates is compiled by using a combination of survey and administrative data. The annual and monthly surveys collect information mostly from large and medium-sized establishments; tax information from T1, T2 and GST files is used to estimate production activity for small units.
Over the last few years, as a result of a number of corporate initiatives under the umbrella of the Corporate Business Architecture, there has been a concerted effort to streamline and standardize the infrastructure, methods and concepts in scope for these programs. As a result, the profile of the programs has shifted much more toward analysis and dissemination, and away from data collection and processing.Footnote 29
Expected outcomes
The MWTRSIP is part of the Economic and Environmental Statistics Program Activity (Sub-program 1.2, Industry Statistics) in Statistics Canada's Program Alignment Architecture. It contributes to the following Statistics Canada Strategic Outcomes (SOs):
"Canadians have access to timely, relevant and quality statistical information on Canada's changing economy and society for informed debate, research and decision making on social and economic issues" (SO1).
"Specific client needs for high-quality and timely statistical services are met" (SO2).
While Statistics Canada is part of the "Government Affairs" outcome area in the whole-of-government framework, the agency and its programs contribute to most federal government outcomes in the domains of economic, social, international and government affairs.
The following logic model describes MWTRSIP's key activities, outputs and outcomes. It is based on Statistics Canada's Quality Assurance Framework,Footnote 30 which describes the six dimensions for quality management (accessibility, timeliness, accuracy, interpretability, coherence and relevanceFootnote 31) and is applied to all Statistics Canada statistical data and products.
Figure 4 - MWTRSIP logic model
Description for Figure 4 - MWTRSIP logic model
This figure depicts the Logic Model for the Manufacturing, Wholesale Trade, Retail and Service Industries Program. It is divided into six layers and shows how each layer contributes upwards to achieve the ultimate outcome. The six layers are from top to bottom: ultimate outcome, intermediate outcome, immediate outcome, outputs, activities, and inputs.
The ultimate outcome is that "Canadians, public and private sectors use manufacturing, wholesale trade, retail and service industries statistical information to inform public debate, research and decision-making". It is at the top of the model.
The intermediate outcome is that "Canadians, public and private sectors information needs are met by manufacturing, wholesale trade, retail and service industries statistical information".
The immediate outcome is that "Canadians, public and private sectors have access to quality manufacturing, wholesale trade, retail and service industries statistical information and to associated support services".
There are two outputs: statistical products which includes datasets, analytical products, research, advice and expertise; and, customized products and services.
There are two activities: program specific core activities according to the GSBPM which includes specify needs, design, build, collect, process, analyze, disseminate and evaluate; and, cost-recovery activities according to GSBPM.
The inputs are program specific data and infrastructure inputs. It includes subject matter input, tools, IT infrastructure, resources, standards, methodology principles and guidelines. The inputs are the lowest layer.
GSBPM referred to under activities is the Generic Statistical Business Process Model.
For quality as is referred to under the immediate outcome, Statistics Canada defines the quality of information in terms of its fitness for use. This is a multidimensional concept embracing both the relevance of information to users' needs, and characteristics of the information such as accuracy, timeliness, accessibility, interpretability and coherence that affect how it can be used.
Appendix 2: Limitations and mitigation strategies
Five main limitations were identified, and a set of mitigation strategies was employed:
Limitations:
The objective of the evaluation did not include an assessment in detail of the quality dimensions for specific statistical products.
There were a large number of surveys administered through these divisions. Not all surveys and products could be assessed in detail.
The MWTRSIP had a high number of partners and users from a variety of work areas. Not all could be contacted for an interview.
Data collection with external stakeholders might have been a burden for some respondents because of recent and ongoing program consultations with stakeholders.
Recent organizational changes to the MWTRSIP limited the capacity for efficiency analysis.
Mitigation Strategies:
The use of a general inductive approach provided the flexibility necessary to perform in-depth analyses if and where significant issues were observed.
Greater focus for the evaluation on:
Mission-critical survey (MSM, MWTS, MRTS) relevance and performance.
Service industry approach and potential statistical information gaps (excluding culture surveys).
Secondary analysis of other MWTRSIP components through stakeholder interviews and user surveys.
The use of other lines of evidence such as a survey of key users allowed to maximize the reach and data collection with users.
The evaluation made use of relevant existing data collected by the MWTRSIP to avoid duplication (e.g., client consultation reports, culture survey consultations).
Review of annual financial expenditures in the context of organizational change.
Identification of efficiency issues through key informant interviews.
The Canadian Employer-Employee Dynamics Database (CEEDD) is a set of linkable files maintained by Statistics Canada to provide linkage between employees and employers in the Canadian labour market. This linkable employer-employee dataset is based on processed administrative data sources from Statistics Canada (StatCan), Canada Revenue Agency (CRA), Employment and Social Development Canada (ESDC) and Immigration, Refugees, and Citizenship Canada (IRCC).
The construction of the CEEDD takes advantage of various administrative data sets that can be linked at the person level and job level using individual's Social Insurance Number (SIN) and employer's Business Number (BN). The population of the CEEDD covers all individuals and firms that can be identified from the administrative files. A key feature of the CEEDD data structure is that it is a set of linkable files from different sources instead of being a single linked file containing all variables available from numerous linkages. Using unique personal and firm identifiers available on each linkable file, information at the employee and employer level can be linked across different component files over time.
Analysis using the CEEDD data can be done either on a cross-sectional basis―at a given point in time based on covariates drawn from the same year across different component files; or longitudinally―by tracking firms and individuals over time across different component files. In particular, with the longitudinal linked employer-employee data structure, employer-employee relationships can be monitored by following specific employer-employee pairings over time. Doing so allow analyses of worker transitions across employers, job tenure, and of the number of jobs held at some point in a given year by employees.
The CEEDD is created from the component files listed in Table 1, which allows researchers to access processed variables at the individual level, family level, job level, and firm level. A set of geographic indicators at the sub-provincial level that can be linked to postal code of the analytical files is also available to users. The CEEDD data provides researchers with: workers' and business owners' information using T1 tax forms and T2 corporate tax returns; job-level information using T4 records and Record of Employment (ROE) data; and firm-level information from the National Accounts Longitudinal Microdata File (NALMF) maintained by Statistics Canada. Sub groups of the population such as immigrants or temporary foreign workers can be analyzed using the Longitudinal Immigration Database (IMDB) and the Temporary Residents File from IRCC. Table 1 also outlines what type of data is available, its source file(s), and time periods available (which depends on the vintage). A new vintage of CEEDD is produced every year with updates from the most current information available.
Table 1: Summary of CEEDD file (2018 Vintage)
Output analytical files
Source files
2018 vintage
Individual-level data
T1 Personal Master Files
T1 PMF
2001 to 2016
T1 Historical Files
T1 H
2001 to 2014
IMDB files
Landing Files & Non-Permanent Residents Files
1980 to 2016
Family-level data
T1 Family Files
T1FF master file – based on T1 PMF, T4, Canada Child Tax Benefit (CCTB) Files
2001 to 2016
Job-level data
Edited T4–ROE–NALMF
Edited T4, ROE, NALMF
2001 to 2016
Business owners' module
T1FD, T1BD, and T2 Corporation Income Tax Return Schedule 50
2001 to 2014
Raw T4 - ROE - LEAP
T4, ROE, LEAP
2001 to 2016
Firm-level data
NALMF
BR, T2, T4, PD7, and GST
2001 to 2016
Import files
Trade by Importer Characteristics
2010 to 2016
Export files
Trade by Exporter Characteristics
2010 to 2016
Geography data
Sub-provincial indicators
Postal Code Conversion File
2001 to 2016
The full CEEDD dataset is not publicly available to researchers because individual worker and firm observations are confidential under the Statistics Act. However, researchers can pay for custom cuts of the CEEDD linked files through Statistics Canada's Research Data Centers (RDCs). Information on the access process, application requirements and costing can be found on the RDCs' website. Inquiries regarding custom tabulations from the CEEDD linkage environment should be directed to statcan.asbproductionsupport-deasoutienalaproduction.statcan@statcan.gc.ca. Analytical output based on the CEEDD linkage environment can be found under Statistics Canada's Analytical Studies Branch Research Paper Series and Economic and Social Reports."
Legacy Content
2019 Census Test Website
Consultation objectives
In preparation for the 2021 Census of Population and Census of Agriculture, Statistics Canada conducts a Census test in 2019 to evaluate the new and modified questions of the questionnaire, as well as the collection procedures and tools.
In March 2019, Statistics Canada conducted usability testing on the Census test website. The website has been enhanced to provide key information on: the Census; the Census test and jobs; frequently asked questions; and, contact information.
Feedback, suggestions and ideas expressed during this consultation ensured that the 2019 Census Test website is as user-friendly as possible while meeting users' needs.
Consultation methodology
Statistics Canada conducted in-person usability consultations in Ottawa, Ontario. Participants were asked to complete a series of tasks and to provide feedback on the proposed website.
It was noted that Statistics Canada selects participants for each consultation to ensure feedback is sought from a representative sample of the target population for the study. Not all applicants were asked to participate in a given consultation.
Statistics Canada is committed to respecting the privacy of consultation participants. All personal information created, held or collected by the Agency is protected by the Privacy Act. For more information on Statistics Canada's privacy policies, please consult the Privacy notice.
Results
What worked
All participants were able to complete the majority of tasks on various pages of the 2019 Census Test Website, stating that the pages included the expected information. Overall, participants thought that the information provided was clear and concise. They also indicated that website was easy to use and that the navigation was intuitive.
Areas for Improvement
Some participants made suggestions concerning the section headers, the quantity of information and the distribution of the information in the FAQ section.
Recommendations
For increased clarity, consider changing some section headers on the landing page and ensure that the FAQ section is organized in a more intuitive order, beginning with the most general information and most popular questions.
Statistics Canada would like to thank participants for their participation in this consultation. Their insights will guide the agency's web development and ensure that the final products meet users' expectations.