Using the census to research your family history—Part 3: concrete example
In this post, we will look at an example that shows what you can learn about your family history by using the census. For more information on how to use the census to research your family history, be sure to check out the first two posts in this series.
We will be learning about Mildred (Lewis) Ware, an important historical figure. Mildred was the wife of John Ware, a prominent Black rancher and farmer in Alberta during the 1890s.
Before we start our census research, we need to collect some basic information. In this case, we already know several details, thanks to research done by the Heritage Community Foundation. This research shows that Mildred was born in Toronto in 1871. She married her husband in 1892, around the time she moved to Alberta. Mildred gave birth to five children before she passed away in 1905 at the age of 34.
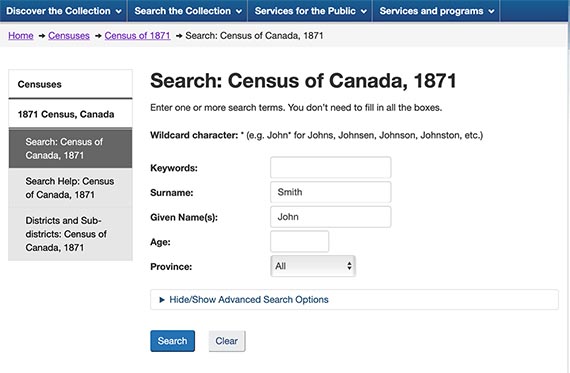
We are going to start with the 1881 Census since Mildred may not have been born before the 1871 Census. We are looking for a Mildred Lewis who lived in Toronto and would have been 9 or 10 years old at the time. To get the greatest number of results, we will enter only her first and last name.
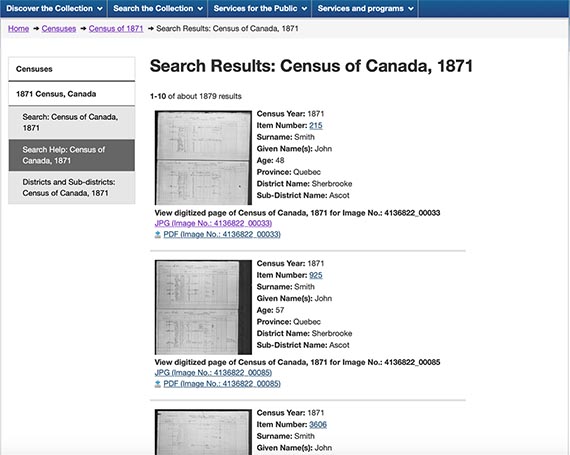
Our search turned up four results, but only one of them matched the right age range for a girl living in Toronto.
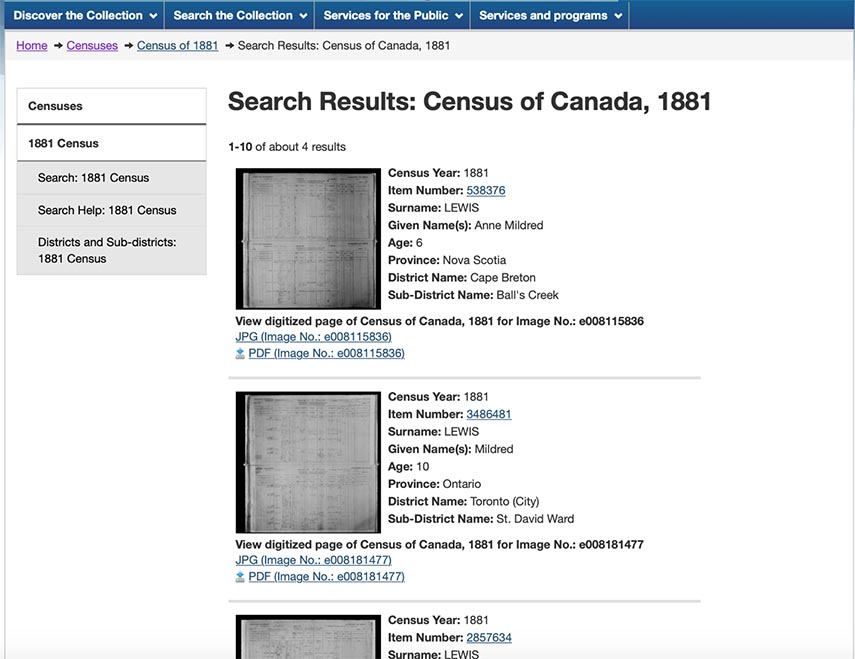
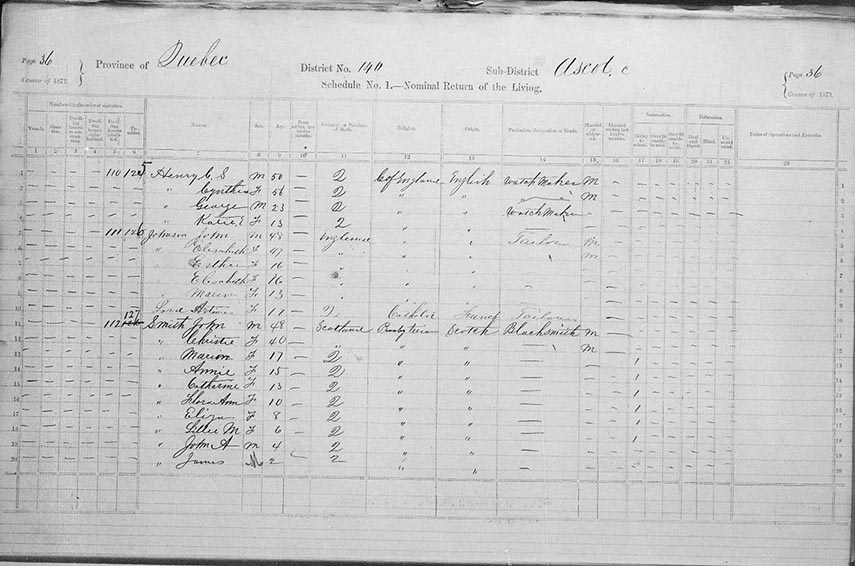
By selecting the JPG option for this census page, we will see Mildred listed with her family.
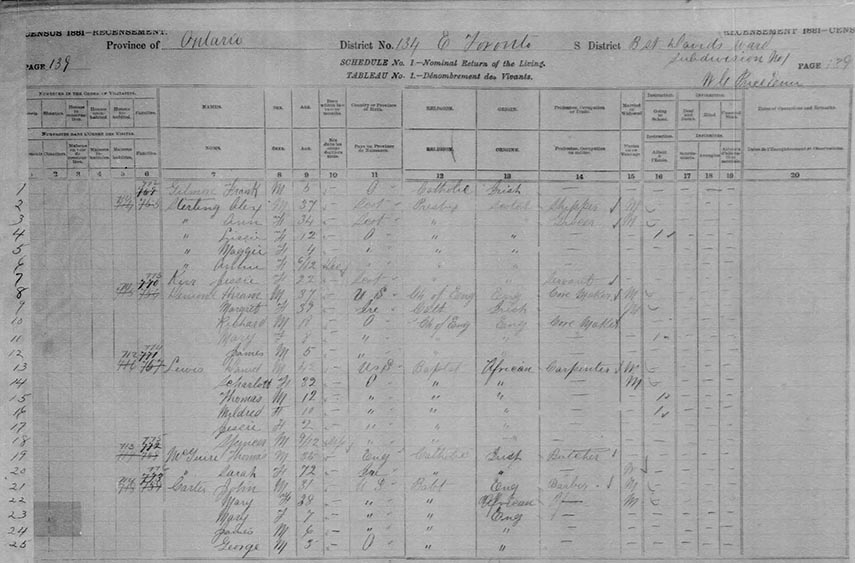
We can see below that Mildred was the daughter of Daniel and Charlotte Lewis, who lived in St. David's Ward in Toronto along with her brothers and sister.
At the time of this census, Daniel was 47 and married to Charlotte, 32. According to the information shown in the image above, Daniel, a carpenter, was born in the United States; Charlotte was born in Ontario. Back then, a woman's occupation was listed only if she worked outside the home. The fact that no occupation was entered means that she worked in the home. The family is listed as being of African origin (Black) and their religion logged as Baptist. The family had three other children in addition to Mildred: a son named Thomas, who was 12 at the time; a daughter named Jessie, 2; and a son named Spencer, 9 months. All of the children were born in Ontario. Both Thomas and Mildred were attending school at the time the census was taken.
By looking at the other people listed alongside the Lewises, we can see that the family lived in a diverse area with Irish, English, Scottish and German neighbours, as well as one other Black family. Some of the occupations listed by neighbours include butcher, farrier, bottler, shoe-maker and servant.
Next, let's go back to the 1871 Census to see whether we can find Mildred's family before she was born. To do this, we will enter Charlotte Lewis' name into the search engine. Our initial search came up with 16 results. Only two of the women listed were in the right age range: one in Markham, Ontario, and one in St. David's Ward, Toronto, Ontario.
A quick look shows that the Charlotte Lewis in St. David's Ward was married to Daniel Lewis, a 37-year-old carpenter, and they had a 2-year-old son named Thomas (listed as Thomas Henry). This fits with the information we already have, so this is likely the same family even though their address is different. Another child is listed here, Frances Jane, who was 1 month old. Since she did not appear in the 1881 Census, she likely passed away sometime between 1871 and 1881.
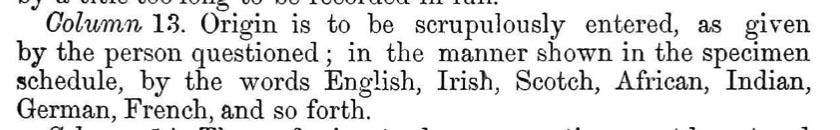
Unlike in 1881, the 1871 Census collected information about whether people could read and write, and we can see here that both Charlotte and Daniel could. The most curious part of this entry is that Charlotte and the children are all listed as being born in Ontario, but their ethnic origin is listed as English; Daniel's is listed as American. According to the manual from the 1871 Census, the response written was that which was given by the person being questioned.
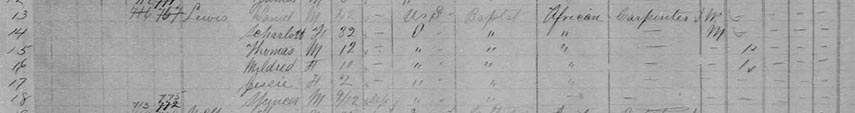
Next, we will look at the 1891 Census, but there are no entries relating to Charlotte, Daniel or Thomas. There are many reasons why this could be the case. We do, however, find someone living in Alberta who is very likely to be Mildred. This Mildred Lewis was listed as 20 years old, and her place of birth was Ontario. Her father is listed as being born in the United States, while her mother was born in Ontario. Mildred's religion is entered as Baptist. This census asked only about the country or province of birth so nothing is listed about her racial or ethnic origin, but a note states that she was living in this household as a domestic servant. We can see this in column 10 under "relationship to family head" where she is listed as "dom," which in this census stood for domestic servant. This census also tells us that she was single and was able to read and write.
Mildred is not listed under either her maiden name or her married name in the 1901 Census and neither is her family. There were also no entries for her husband, John Ware. Again, there are many reasons why this could be the case.
Although we know that Mildred died in 1905, followed by her husband shortly after, we should still look at the 1906 Census (1906 Census of the Northwest Provinces—Alberta, Manitoba and Saskatchewan) to see whether we can find any information about her parents, siblings or children. Entering Charlotte's information into the search engine results in one entry in the right age range, and we find a happy surprise.
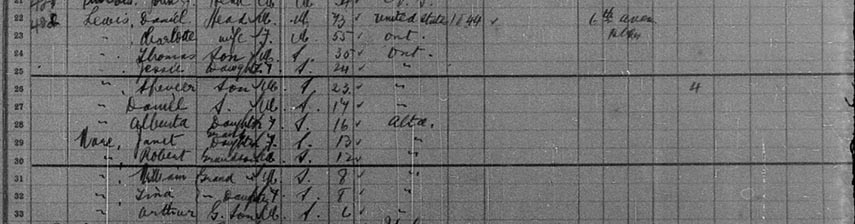
We find not only Charlotte, Daniel and their children, Thomas, Jessie and Spencer, but also two more children born between 1881 and 1906: a son, Daniel, aged 17, and a daughter, Alberta, aged 16. Alberta is listed as having been born in Alberta, so it looks like the family moved there after Mildred died. The family is listed as living in their own home in the country. Spencer also seems to have owned four horses.
Most remarkable is that there are five other children listed as living in this household, all born in Alberta: Janet Ware, 13; Robert Ware, 12; William Ware, 8; Lina Ware, 8; and Arthur Ware, 6. They are listed as the grandchildren of Daniel and Charlotte. These were Mildred and John's children, who seem to have gone to live with their grandparents after their parents died.
As this example shows, there is a lot that we can learn about family history using the census. Imagine what other stories you might be able to find!

The census and your family history
We can learn so much about our family history through the census. Do you want to learn how you can use the census to find out more about your family's history? Check out our other blog posts!
- Using the census to research your family history—Part 1: introduction to the census
- Using the census to research your family history—Part 2: tips and best practices
- The life of an 1871 Census enumerator
If you would like more information on using the census to do research, check out this detailed guide from Library and Archives Canada.