Introduction to the National Occupational Classification (NOC) 2016 Version 1.3
Preface
NOC 2016 Version 1.3 forms part of the NOC evergreening process. The purpose of this process is to provide an annual review and update of the current NOC to ensure it reflects current trends in the labour market. The structure of NOC 2016 Version 1.3 remains unchanged from the previous versions of the NOC 2016.
Acknowledgements
The National Occupational Classification (NOC) 2016 was published, in partnership, by Employment and Social Development Canada (ESDC) and Statistics Canada. The realization of NOC 2016 Version 1.3 was dependent on a team of occupational research analysts and assistants from both ESDC and Statistics Canada.
- Background
- Structure and format of NOC 2016 Version 1.3
- Related classifications
- Relationship between NOC and ISCO-08
- Overview of the NOC 2016 Version 1.0 update
- Overview of the NOC 2016 Version 1.1 update
- Overview of the NOC 2016 Version 1.2 update
- Overview of the NOC 2016 Version 1.3 update
- NOC classification criteria
- Coding to NOC 2016
- More information on the NOC 2016 Version 1.3
Background
The National Occupational Classification (NOC) 2016 Version 1.3 updates the previous versions of the NOC 2016. It is the nationally accepted taxonomy and organizational framework of occupations in the Canadian labour market. The NOC has been developed and maintained as part of a collaborative partnership between Employment and Social Development Canada (ESDC) and Statistics Canada. This update of the classification reflects ongoing occupational research and consultation to incorporate information on new occupations. These updates are non-structural in nature. Structural changes that affect the classification framework, such as the addition of new classes, occur each 10 year cycle. The NOC 2016 Version 1.3 represents an update, and uses the previous version of the NOC 2016 classification structure.
The NOC is designed to classify occupational information from statistical surveys. It is also used in a range of contexts to compile, analyze and communicate information about occupations. Occupational information is of critical importance for the provision of labour market and career intelligence, skills development, occupational forecasting, labour supply and demand analysis, employment equity and numerous other programs and services. It provides a standardized framework for organizing the world of work in a manageable, understandable and coherent system.
The basic principle of classification of the NOC is the kind of work performed. Occupations are identified and grouped primarily in terms of the work usually performed, this being determined by the tasks, duties, and responsibilities of the occupation. Factors such as the materials processed or used, the industrial processes and the equipment used, the degree of responsibility and complexity of work, as well as the products made and services provided, have been taken as indicators of the work performed when combining jobs into occupations and occupations into groups.
An occupation is defined as a collection of jobs, sufficiently similar in work performed to be grouped under a common label for classification purposes. A job, in turn, encompasses all the tasks carried out by a particular worker to complete their duties.
The NOC provides a systematic classification structure that categorizes the entire range of occupational activity in Canada. Its detailed occupations are identified and grouped primarily according to the work performed, as determined by the tasks, duties and responsibilities of the occupation. The NOC 2016 Version 1.3 update incorporates new job titles and clarifies the content of unit groups. Updates to the descriptions and job titles of some unit groups reflect added information, changes in terminology to correspond with current usage and the evolution of some occupations. As part of the update, a standardized style guide was applied to the Leading Statements and Main Duties of unit groups to improve consistency and provide a better flow to the information.
NOC 2016 Version 1.3 maintains the structure of the previous versions of the NOC 2016 and provides historic comparability. No major groups, minor groups or unit groups have been added, deleted or combined, though some groups have updated content. Like previous versions of the NOC 2016, its organization is based on the dual criteria of Skill Type and Skill Level, to support relevant labour market analysis.
Structure and format of NOC 2016
The structure and format of the National Occupational Classification 2016 are based on the four-tiered hierarchical arrangement of occupational groups with successive levels of disaggregation. It contains broad occupational categories, major, minor and unit groups.
10 broad occupational categories
- Each broad occupational category has a unique one-digit code number and is composed of one or more major groups.
40 major groups
- Each major group has a unique two-digitFootnote 1 code number and is composed of one or more minor groups. The first digit of this code indicates the broad occupational category to which the major group belongs.
140 minor groups
- Each minor group has a unique three-digit code number and is composed of one or more unit groups. The first two digits of this code indicate the major group to which the minor group belongs.
500 Unit Groups
- Each unit group has a unique four-digit code. The first three digits of this code indicate the major and minor groups to which the unit group belongs.
For example:
0 - Management occupations
00 - Senior management occupations
001 - Legislators and senior management
0011 - Legislators
0012 - Senior government managers and officials
0013 - Senior managers - financial, communications and other business services
0014 - Senior managers - health, education, social and community services and membership organizations
0015 - Senior managers - trade, broadcasting and other services, n.e.c.
0016 - Senior managers - construction, transportation, production and utilities
The broad occupational category code, designated by a single digit, is repeated at all levels. Major group codes are created by adding a second digit. This digit appears in the second position at all lower levels in the structure. Minor group codes add a third digit. Finally, the 4-digit unit group codes contain the digit identifying the broad occupational group, followed by the digit identifying the major group and the digit identifying the minor group and a last digit identifying the unit group.
There are approximately 35,000 titles classified in the 500 unit groups of the NOC 2016. Some titles are clearly occupations, such as librarian and chef, while others reflect specializations within an occupational area, such as music librarian and pastry chef. Still others represent a range of jobs, such as furniture assembler and sawmill machine operator.
These titles are used to describe the work performed by many individuals holding similar jobs within an occupational area. The list of titles in the NOC is not meant to be exhaustive, but attempts to cover the most commonly used and universally understood labels that identify work in the labour market.
Abbreviations
Few abbreviations are used in this classification. Particular attention should be given to the abbreviation n.e.c. (not elsewhere classified). As an occupational qualifier it is occasionally used in the labels of major, minor and unit groups to refer to occupations not elsewhere classified (e.g., 065 Managers in customer and personal services, n.e.c.).
Language
The NOC is available separately in both official languages. It is important to note that the French version includes only titles commonly used in French and proper to the milieu and, therefore, these are not normally translations of the English titles. The classification structure is the same in both languages.
Unit group labels are presented in gender-neutral format in French identifying the masculine and feminine titles separated by a slash. Where relevant, this structure is used in English as well. The illustrative example titles and inclusions are also presented in gender-neutral format. The NOC descriptions are written using the masculine form as they refer to all workers within the included occupations. This has been done in order to lighten the text and to reduce reading burden.
Modifying terms
Modifying terms have been added to several job titles, as extensions, to designate the industrial sector or the domain of expertise. If applicable, this information is preceded by a dash at the end of the title (cashier supervisor – retail trade) to distinguish between similar titles. These modifying terms may also specify where the titles appear in the classification structure (painter – visual arts; painter – manufacture of motor vehicles). This information should be considered when coding job titles.
Format of unit group descriptions
Each NOC unit group description consists of several standardized sections which define and describe its content.
Class definitionsFootnote 2 / Lead statementFootnote 3
This section provides a general description of the content and boundaries of the unit group and indicates the main activities of occupations within the unit group. It also indicates the kinds of industries or establishments in which the occupations are found. The list of places of employment is not always exhaustive, but can assist in clarifying the occupations described and in differentiating them from occupations found in other groups.
Illustrative examplesFootnote 2 / Example titlesFootnote 3
This section is a list of titles commonly used in the labour market. The titles are intended to illustrate the contents and range of the occupational group. This is not an exhaustive list of job titles.
Inclusions
This section provides a list of borderline job titles belonging to a particular NOC unit group. Inclusions are examples in classes where it might not be clear from reading both the class text and title that the example belongs in the class.
ExclusionsFootnote 2 / Classified elsewhereFootnote 3
This section clarifies the boundaries of the unit group by identifying related unit groups and similar occupations that are classified elsewhere. Unit groups or individual occupations are cited in this section when they bear a functional similarity to the unit group or when similar titles occur.
Main duties
This section lists some of the tasks or duties performed in the occupations in the unit group. Depending on the contents of the unit group, one of three formats is used.
- A series of statements that can be applied to all occupations in the unit group. This format was selected for unit groups that contain a single core occupation, such as 1242 Legal administrative assistants and 2146 Aerospace engineers. This format was also selected for unit groups that contain a range of related titles that nevertheless share a set of common duties, such as 1411 General office support workers and 9417 Machining tool operators.
- Two or more sub-sets of occupations with a series of statements that apply to each component. This format was selected for unit groups that consist of two or more sub-components which, while similar enough to be in the same unit group, can be described separately. Examples of unit groups with this format are 3141 Audiologists and speech-language pathologists and 5125 Translators, terminologists and interpreters.
- A series of brief descriptive statements that are linked to specific occupations within a group. This format was selected for unit groups that contain a series of occupations which, while similar enough to be in the same unit group, can be described separately. Examples of unit groups with this format include 4423 By-law enforcement and other regulatory officers, n.e.c. and 5226 Other technical and co-ordinating occupations in motion pictures, broadcasting and the performing arts.
For some unit groups, a statement appears at the end of the tasks performed or main duties section, identifying specializations that exist within the occupational area encompassed by the unit group.
Employment requirements
This section describes the employment requirements for the unit group. Several types of requirements are identified in this section and are listed in the following order.
- Type and level of formal education: for example, secondary school, college diploma, university degree. Efforts were made to be as specific as possible, though many unit groups have a range of acceptable educational requirements.
- Specific training: for example, apprenticeship training, on-the-job training, training courses specific to an occupation.
- Experience in another occupation: for example, supervisors usually require several years of experience in the occupation that they supervise.
- Licences, certificates or registration: for example, regulatory requirements to practice in a regulated profession, special licenses to operate certain kinds of vehicles.
- Other requirements: for example, athletic ability or artistic talent.
Note: Some occupations are designated as regulated professions and trades. Regulations are subject to change and may vary across jurisdictions. The most reliable information on regulatory requirements for occupations is found on the Web sites of provincial regulatory organizations and licensing authorities.
The Employment requirements section does not attempt to describe personal suitability requirements that are assessed by employers as part of the hiring process.
Some occupations have very definite employment requirements while for others, there is no consensus or a range of acceptable requirements exist. To reflect this variation in the labour market, this section describes employment requirements using the following terminology:
- "... is required" - to indicate a definite requirement;
- "... is usually required" - to indicate something that is usually required by the majority of employers, but not always required by all employers; and
- "... may be required" - to indicate something that may be required by some employers, but on a less frequent basis.
Note: For reasons of brevity, in this section the term college includes the following types of post-secondary institutions: community colleges, CÉGEPS, technical institutes, trade schools and agricultural colleges. Where relevant, in some provinces, it may also include private training organizations, music conservatories and other non-degree granting institutions.
Additional information
This section appears in some unit group descriptions. It provides information on the following:
- progression to other occupations (such as supervisory or management positions) based on transferability of skills from acquired occupational experience;
- mobility patterns, such as inter- and intra-occupational transferability of skills (for example, identifying occupations that are part of internal lines of progression or specializations within a subject matter area);
- trends and forthcoming changes in the unit group's employment requirements; and
- other information to clarify and define the unit group.
Related classifications
The classification of occupations does not stand alone but must be understood as being related to other classifications, such as the North American Industry Classification System (NAICS) and that of Class of Worker. Each of these classifications supplements the NOC 2016 in presenting a rounded picture of the nature of a person's job.
North American Industry Classification System (NAICS)
The industrial qualifier which may accompany the job title:
- Indicates the type of economic activity with which the job is usually associated. (It is important to note that the assignment of an industrial qualifier does not necessarily limit a job to that industry. These qualifiers are merely indicative of the possible areas of activity in which the job may be found.)
- Permits the assignment of similar titles to different occupation groups where the duties vary between industries.
- Aids in defining the specific occupations and helps the coder grasp the underlying principles of this classification.
The industry in which the individual is employed is determined by the kind of economic activity of the establishment. The establishment is usually a factory, mine, farm, store, other place of business or an institution for which a number of basic production variables can be compiled.
It is important to note the conceptual differences between an industry classification and an occupation classification. An establishment can employ individuals performing completely different occupations, and these are classified to appropriate occupational groups, but the industrial classification of each individual employed in the establishment should be the same and is determined by the nature of the product made or service rendered. In other words, the nature of the factory, business or service in which the person is employed does not determine the classification of the occupation, except to the extent that it enables the nature of the duties to be more clearly defined.
Class of Worker
Class of worker refers to an individual's employment relationship to the business in which he or she works, as employee or self-employed, including unpaid family worker, and thus provides another means of describing the work. The NOC 2016 does not indicate the class of worker classification for each occupation since many occupations contain both jobs held by employees and jobs of self-employed individuals. However, a general rule has been established for coding purposes and is discussed in full under the section on Coding.
Relationship between NOC and ISCO-08
The NOC is comparable to the International Standard Classification of Occupations (ISCO) published by the International Labour Organization (ILO). While the NOC was originally developed in Canada in the 1980s, ISCO was also being reviewed and updated to produce ISCO-88. Communication between the NOC and ISCO research teams led to similarities, such as a similar conceptual framework that includes the Skill Type and Skill Level dimensions. The similarities between the NOC and ISCO increased in later structural revision (ISCO-08 and NOC 2011) cycles. However, certain conceptual differences between the NOC 2016 and ISCO-08 limit comparability. For instance, differences in skill level definitions and classification structure exist between NOC 2016 and ISCO-08, especially in the trades occupations. Subsistence occupations included in ISCO are not part of the NOC. For countries and regions in which subsistence activities are virtually non-existent, the ILO affirms that such activities may be excluded without loss of international comparability.
The concordance between NOC 2011 and ISCO 2008 can be used for purposes of showing the relationship between NOC 2016 and ISCO 2008 since the structure is the same in both NOC 2011 and NOC 2016.
Overview of the NOC 2016 Version 1.0 update
The purposes for the 2016 revision of the National Occupational Classification (NOC) are: to update the classification to incorporate emerging occupations and new job titles while maintaining historical comparability; to remove redundant or obsolete job titles to optimize readability and navigation of the NOC; to incorporate editorial changes; to integrate the concept of Inclusions at the unit group level; and to add NOC major and minor groups definitions.
The structure of NOC 2016 Version 1.0 remains unchanged from that of NOC 2011. No major groups, minor groups or unit groups have been added, deleted or combined, though some groups have new names or updated content.
Job titles changes at the unit group and minor group levels and updates to the definitions of some unit groups reflect added information, correction of terminology to correspond with current usage and the evolution of some occupations and where they are classified.
Many new job titles have been added to NOC 2016 version 1.0, which arise as the division of labour in Canadian society evolves, creating new jobs and new specializations, and as technological change brings with it new terminology. Some of the titles added to reflect such changes are: geodesist, medical archivist, crime scene examiner, corrosion technologist, video game tester and biomass plant technicians. Other added titles are modified versions, or alternatives, that appeared in previous versions of the NOC and have been added to help users find particular occupations. For example, power plant stationary engineer appeared in earlier versions of the NOC; operating engineer - power plant has been added.
To clarify the boundaries between occupations, a few titles have been re-assigned to a different unit group in NOC 2016. The impact of this on the comparability of data between 2011 and 2016 is negligible. For example, Admission director – health care has been moved from Managers in health care (0311) to Other administrative services managers (0114). This change will have a minimal impact on the unit groups affected, and provides a more appropriate placement. In all other cases where titles have been moved, this was done to clarify the boundaries and improve content description of these unit groups. For example, the titles 'tax collector' and 'collector of taxes' were being coded in Employment insurance, immigration, border services and revenue officers (1228) rather than in Collectors (1435).
With the transition to a paperless environment and content digitalization, significant format changes were made to the list of job titles contained in the NOC. To optimize the use of the NOC, redundant or obsolete job titles were removed. In the past, titles appeared in both in natural order (e.g., travel agent) and in inverted order (e.g., agent, travel). Inverted titles used a comma as a separator in the title string making it easier to find titles in a paper publication. As this concept became outdated and redundant in web publications and data files, more than 4000 quasi-duplicates entries were removed for the NOC 2016.
The NOC is structured in accordance with the Generic Statistical Information Model (GSIM): Statistical Classifications Model. In order to comply with the demands of GSIM, the NOC was revised with the addition of Inclusions, to supplement the existing Illustrative examples and Exclusions. Inclusions are borderline cases for the unit group. They are presented separately in order to clarify the contents of the class. Note that creation of Inclusions do not change the boundaries of any NOC unit group. Moreover, definitions were developed for the NOC major and minor groups.
More information on these changes is available in the following tables which summarize the changes of note between NOC 2011 and NOC 2016.
| NOC unit group | From 2011 | To 2016 |
|---|---|---|
| 0433 | Commissioned officers of the Canadian Forces | Commissioned officers of the Canadian Armed Forces |
| 1432 | Payroll clerks | Payroll administrators |
| 4313 | Non-commissioned ranks of the Canadian Forces | Non-commissioned ranks of the Canadian Armed Forces |
| 7313 | Refrigeration and air conditioning mechanics | Heating, refrigeration and air conditioning mechanics |
| 9213 | Supervisors, food, beverage and associated products processing | Supervisors, food and beverage processing |
| 9232 | Petroleum, gas and chemical process operators | Central control and process operators, petroleum, gas and chemical processing |
| 9461 | Process control and machine operators, food, beverage and associated products processing | Process control and machine operators, food and beverage processing |
| 9465 | Testers and graders, food, beverage and associated products processing | Testers and graders, food and beverage processing |
| 9617 | Labourers in food, beverage and associated products processing | Labourers in food and beverage processing |
| NOC unit group | From 2011 | To 2016 |
|---|---|---|
| 0013 | Senior managers in this unit group are usually appointed by a board of directors, to which they report. They work either alone or in conjunction with the board of directors to develop and establish objectives for the company, and to develop or approve policies and programs. They plan, organize, direct, control and evaluate, through middle managers, the operations of their organization in relation to established objectives. They work in establishments throughout the telecommunications, finance, insurance, real estate, and data processing, hosting and related services industries as well as other business service industries. | Senior managers in this unit group are usually appointed by a board of directors, to which they report. They work either alone or in conjunction with the board of directors to develop and establish objectives for the company, and to develop or approve policies and programs. They plan, organize, direct, control and evaluate, through middle managers, the operations of their organization in relation to established objectives. They work in establishments throughout the telecommunications, finance, insurance, real estate, and data processing, hosting and related services industries as well as other business service industries or they may own and operate their own business. |
| 0014 | Senior managers in this unit group plan, organize, direct, control and evaluate, through middle managers, membership and other organizations or institutions that deliver health, education, social or community services. They formulate policies which establish the direction to be taken by these organizations, either alone or in conjunction with a board of directors. They are employed in health care organizations, educational services, social and community services and membership organizations. | Senior managers in this unit group plan, organize, direct, control and evaluate, through middle managers, membership and other organizations or institutions that deliver health, education, social or community services. They formulate policies which establish the direction to be taken by these organizations, either alone or in conjunction with a board of directors. They are employed in health care organizations, educational services, social and community services and membership organizations or they may own and operate their own business. |
| 0015 | Senior managers in this unit group plan, organize, direct, control and evaluate, through middle managers, trade, broadcasting and other service companies not elsewhere classified. They formulate policies which establish the direction to be taken by these companies, either alone or in conjunction with a board of directors. They work in establishments in broadcasting and related media services, wholesale trade, retail trade, accommodation and food service, and other services not elsewhere classified. | Senior managers in this unit group plan, organize, direct, control and evaluate, through middle managers, trade, broadcasting and other service companies not elsewhere classified. They formulate policies which establish the direction to be taken by these companies, either alone or in conjunction with a board of directors. They work in establishments in broadcasting and related media services, wholesale trade, retail trade, accommodation and food service, and other services not elsewhere classified or they may own and operate their own business. |
| 0016 | Senior managers in this unit group plan, organize, direct, control and evaluate, through middle managers, the overall operations of goods production, utility, transportation and construction companies. They formulate policies which establish the direction to be taken by these companies, either alone or in conjunction with other members of a board of directors. They work in establishments throughout the following industries: fishing, forestry, logging and agriculture; mining, oil and gas extraction; construction; transportation and warehousing; printing; manufacturing; and utilities. | Senior managers in this unit group plan, organize, direct, control and evaluate, through middle managers, the overall operations of goods production, utility, transportation and construction companies. They formulate policies which establish the direction to be taken by these companies, either alone or in conjunction with other members of a board of directors. They work in establishments throughout the following industries: fishing, forestry, logging and agriculture; mining, oil and gas extraction; construction; transportation and warehousing; printing; manufacturing; and utilities or they may own and operate their own business. |
| 0114 | This unit group includes managers who plan, organize, direct, control and evaluate departments responsible for corporate governance and regulatory compliance, records management, security services, admissions and other administrative services not elsewhere classified. Also included in this unit group are managers responsible for departments involved in two or more of the following activities: finance, human resources, purchasing, computer systems or administrative services. Managers in this unit group are employed throughout the public and private sector. | This unit group includes managers who plan, organize, direct, control and evaluate departments responsible for corporate governance and regulatory compliance, records management, security services, admissions and other administrative services not elsewhere classified. Also included in this unit group are managers responsible for departments involved in two or more of the following activities: finance, human resources, purchasing or administrative services. Managers in this unit group are employed throughout the public and private sector. |
| 0124 | Advertising, marketing and public relations managers plan, organize, direct, control and evaluate the activities of establishments and departments involved in commercial, industrial and e-business advertising, marketing and public relations. They are employed by commercial and industrial establishments, government departments, and advertising, marketing and public relations firms or consulting businesses. | Advertising, marketing, public relations and e-business managers plan, organize, direct, control and evaluate the activities of establishments and departments involved in commercial, industrial and e-business advertising, marketing and public relations. They are employed by commercial and industrial establishments, government departments, and advertising, marketing and public relations firms or consulting businesses. |
| 0411 | Government managers in this unit group plan, organize, direct, control and evaluate the development and administration of health care policies, social policies and related programs designed to protect and promote the health and social welfare of individuals and communities. These managers are employed by government departments and agencies. | Government managers in this unit group plan, organize, direct, control and evaluate the development and administration of health care policies, social policies and related programs designed to protect and promote the health and social welfare of individuals and communities. They are employed by all levels of government. |
| 0412 | Government managers in this unit group plan, organize, direct, control and evaluate economic policy, research and programs in areas of government activity such as taxation, international trade, labour markets, transportation or agriculture. They also plan and direct policies and programs to promote industrial and commercial business development in urban and rural areas. They are employed in government departments and agencies. | Government managers in this unit group plan, organize, direct, control and evaluate economic policy, research and programs in areas of government activity such as taxation, international trade, labour markets, transportation or agriculture. They also plan and direct policies and programs to promote industrial and commercial business development in urban and rural areas. They are employed by all levels of government. |
| 0413 | Government managers in this unit group plan, organize, direct, control and evaluate the development and administration of elementary, secondary and post-secondary education policies and programs. They are employed by government departments and agencies | Government managers in this unit group plan, organize, direct, control and evaluate the development and administration of elementary, secondary and post-secondary education policies and programs. They are employed by all levels of government. |
| 0414 | Managers in this unit group plan, organize, direct, control and evaluate the development of policies and programs which govern the daily operations of legislatures and other activities unique to government such as intergovernmental affairs and elections. They are employed by government departments, agencies and legislative bodies. | Managers in this unit group plan, organize, direct, control and evaluate the development of policies and programs which govern the daily operations of legislatures and other activities unique to government such as intergovernmental affairs and elections. They are employed by all levels of government. |
| 0433 | This unit group consists of commissioned officers of the Canadian Forces who plan, organize, command and evaluate the activities of personnel in the Canadian Forces. All ranks of commissioned officers in the Air Force, Army, and Navy are included in this unit group. | This unit group consists of commissioned officers of the Canadian Armed Forces who plan, organize, command and evaluate the activities of personnel in the Canadian Armed Forces. All ranks of commissioned officers in the Royal Canadian Air Force, Canadian Army, and Royal Canadian Navy are included in this unit group. |
| 0511 | This unit group includes managers who plan, organize, direct, control and evaluate the activities of libraries, archives, museums, art galleries or departments within such institutions. They are employed in libraries, archives, museums and non-retail art galleries. | Library, archive, museum and art gallery managers plan, organize, direct, control and evaluate the activities of libraries, archives, museums, art galleries or departments within such institutions. They are employed in libraries, archives, museums and non-retail art galleries. |
| 1121 | Human resources professionals develop, implement and evaluate human resources and labour relations policies, programs and procedures and advise managers and employers on human resources matters. Human resources professionals are employed throughout the private and public sectors, or they may be self-employed. | Human resources professionals develop, implement and evaluate human resources and labour relations policies, programs and procedures and advise employers and employees on human resources matters. Human resources professionals are employed throughout the private and public sectors, or they may be self-employed. |
| 1228 | This unit group includes government officers who administer and enforce laws and regulations related to immigration, employment insurance, customs and tax revenue. They are employed by government agencies. | This unit group includes government officers who administer and enforce laws and regulations related to immigration, customs, border crossing, tax revenue, employment insurance and other government benefit services. They are employed by government agencies. |
| 1414 | Receptionists greet people arriving at offices, hospitals and other establishments, direct visitors to appropriate person or service, answer and forward telephone calls, take messages, schedule appointments and perform other clerical duties. They are employed by hospitals, medical and dental offices and in other offices throughout the public and private sectors. Telephone operators are included in this group. | Receptionists greet people arriving at offices, hospitals and other establishments, direct visitors to appropriate person or service, answer and forward telephone calls, take messages, schedule appointments and perform other clerical duties. They are employed by hospitals, medical and dental offices and throughout the public and private sectors. Telephone operators are included in this group. |
| 1432 | Payroll clerks collect, verify and process payroll information and determine pay and benefit entitlements for employees within a department, company or other establishment. They are employed by payroll administration companies and by establishments throughout the private and public sectors. | Payroll administrators collect, verify and process payroll information and determine pay and benefit entitlements for employees within a department, company or other establishment. They are employed by payroll administration companies and by establishments throughout the private and public sectors. |
| 1523 | Production logistics co-ordinators co-ordinate and expedite the flow of work and materials within an establishment, prepare work and production schedules and monitor the progress of production and construction projects. Production clerks are employed by manufacturing and construction companies, printing and publishing companies and other industrial establishments. | Production logistics co-ordinators co-ordinate and expedite the flow of work and materials within an establishment, prepare work and production schedules and monitor the progress of production and construction projects. They are employed by manufacturing and construction companies, printing and publishing companies and other industrial establishments. |
| 2174 | Computer programmers write, modify, integrate and test computer code for microcomputer and mainframe software applications, data processing applications, operating systems-level software and communications software. Interactive media developers write, modify, integrate and test computer code for Internet applications, computer-based training software, computer games, film, video and other interactive media. They are employed in computer software development firms, information technology consulting firms, and in information technology units throughout the private and public sectors. | Computer programmers write, modify, integrate and test computer code for software applications, data processing applications, operating systems-level software and communications software. Interactive media developers write, modify, integrate and test computer code for Internet and mobile applications, computer-based training software, computer games, film, video and other interactive media. They are employed in computer software development firms, information technology consulting firms, and in information technology units throughout the private and public sectors. |
| 2232 | Mechanical engineering technologists and technicians provide technical support and services or may work independently in mechanical engineering fields such as the design, development, maintenance and testing of machines, components, tools, heating and ventilating systems, power generation and power conversion plants, manufacturing plants and equipment. They are employed by consulting engineering, manufacturing and processing companies, institutions and government departments. | Mechanical engineering technologists and technicians provide technical support and services or may work independently in mechanical engineering fields such as the design, development, maintenance and testing of machines, components, tools, heating and ventilating systems, geothermal power plants, power generation and power conversion plants, manufacturing plants and equipment. They are employed by consulting engineering, manufacturing and processing companies, institutions and government departments. |
| 2263 | Inspectors in this unit group evaluate and monitor health and safety hazards and develop strategies to control risks in the workplace. They inspect restaurants, public facilities, industrial establishments, municipal water systems and other workplaces to ensure compliance with government regulations regarding sanitation, pollution control, the handling and storage of hazardous substances and workplace safety. They are employed throughout the private and public sectors. | Inspectors in this unit group evaluate and monitor health and safety hazards and develop strategies to control risks in the workplace. They inspect restaurants, industrial establishments, municipal water systems, public facilities, institutions and other workplaces to ensure compliance with government regulations regarding sanitation, pollution control, the handling and storage of hazardous substances and workplace safety. They are employed throughout the private and public sectors. |
| 3012 | This unit group includes registered nurses, registered psychiatric nurses and graduates of a nursing program who are awaiting registration (graduate nurses). They provide direct nursing care to patients, deliver health education programs and provide consultative services regarding issues relevant to the practice of nursing. They are employed in a variety of settings including hospitals, nursing homes, extended care facilities, rehabilitation centres, doctors' offices, clinics, community agencies, companies and private homes, or they may be self-employed. | This unit group includes registered nurses, registered psychiatric nurses and graduates of a nursing program who are awaiting registration (graduate nurses). They provide direct nursing care to patients, deliver health education programs and provide consultative services regarding issues relevant to the practice of nursing. They are employed in a variety of settings including hospitals, nursing homes, extended care facilities, rehabilitation centres, doctors' offices, clinics, community agencies, companies, private homes and public and private organizations or they may be self-employed. |
| 3121 | Optometrists examine eyes and diagnose ocular diseases and disorders. They prescribe and fit eyeglasses and contact lenses and recommend treatments such as exercises to correct vision problems or ocular disorders. They work in private practice, clinics and community health centres. | Optometrists examine eyes to assess and diagnose ocular diseases and disorders. They prescribe and fit eyeglasses and contact lenses and recommend treatments such as exercises to correct vision problems or ocular disorders. They work in private practice, clinics and community health centres. |
| 3125 | This unit group includes health professionals who diagnose and treat the diseases and injuries of patients and who are not elsewhere classified. This includes doctors of podiatric medicine, chiropodists and podiatrists, naturopaths, orthoptists and osteopaths. They work in private practices, clinics and hospitals. | This unit group includes health professionals who diagnose and treat the diseases and injuries of patients and who are not elsewhere classified. This includes doctors of podiatric medicine, chiropodists and podiatrists, naturopaths, orthoptists and doctors of osteopathic medicine. They work in private practices, clinics and hospitals. |
| 3132 | Dietitians and nutritionists plan, implement and oversee nutrition and food service programs. They are employed in a variety of settings including hospitals, home health-care agencies and extended care facilities, community health centres, the food and beverage industry, the pharmaceutical industry, educational institutions, and government and sports organizations, or they may work as private consultants. | Dietitians and nutritionists plan, implement and oversee nutrition and food service programs. They are employed in a variety of settings including hospitals, home health-care agencies and extended care facilities, community health centres, the food and beverage industry, educational institutions, and government and sports organizations, or they may work as private consultants. |
| 3142 | Physiotherapists assess patients and plan and carry out individually designed treatment programs to maintain, improve or restore physical functioning, alleviate pain and prevent physical dysfunction in patients. Physiotherapists are employed in hospitals, clinics, industry, sports organizations, rehabilitation centres and extended care facilities, or they may work in private practice. | Physiotherapists assess patients and plan and carry out individually designed treatment programs to maintain, improve or restore physical functioning and mobility, alleviate pain and prevent physical dysfunction in patients. Physiotherapists are employed in hospitals, clinics, industry, sports organizations, rehabilitation centres and extended care facilities, or they may work in private practice. |
| 3217 | Cardiology technologists operate electrocardiogram and other electronic equipment to record cardiac activity of patients to aid in the diagnosis, monitoring and treatment of heart disease. Electrophysiological diagnostic technologists, not elsewhere classified, operate electroencephalographic, electromyographic and other electrophysiological diagnostic equipment to assist physicians in diagnosing diseases, injuries and abnormalities. Cardiology technologists and electrophysiological diagnostic technologists who are supervisors or instructors are included in this unit group. They are employed in clinics, hospitals and medical laboratories. | Cardiology technologists operate electrocardiogram equipment and use medical imaging technologies to record cardiac activity of patients to aid in the diagnosis, monitoring and treatment of heart disease. Electrophysiological diagnostic technologists, not elsewhere classified, operate electroencephalographic, electromyographic and other electrophysiological diagnostic equipment to assist physicians in diagnosing diseases, injuries and abnormalities. Cardiology technologists and electrophysiological diagnostic technologists who are supervisors or instructors are included in this unit group. They are employed in clinics, hospitals and medical laboratories. |
| 3233 | Licensed practical nurses provide nursing care usually under the direction of medical practitioners, registered nurses or other health team members. They are employed in hospitals, nursing homes, extended care facilities, rehabilitation centres, doctors' offices, clinics, companies, private homes and community health centres. Operating room technicians are included in this unit group. | Licensed practical nurses provide nursing care usually under the direction of medical practitioners, registered nurses or other health team members. Operating room technicians prepare patients and provide assistance to medical practitioners prior to and during surgery. Licensed practical nurses are employed in hospitals, nursing homes, extended care facilities, rehabilitation centres, doctors' offices, clinics, companies, private homes and community health centres. Operating room technicians are employed in hospitals. |
| 4154 | Ministers of religion conduct religious services, administer the rites of a religious faith or denomination, provide spiritual and moral guidance and perform other functions associated with the practice of a religion. Ministers of religion perform these duties in churches, synagogues, temples or other places of worship. They may also work in other institutions such as schools, hospitals and prisons. | Professionals in this unit group conduct religious services, administer the rites of a religious faith or denomination, provide spiritual and moral guidance and perform other functions associated with the practice of a religion. They perform these duties in churches, synagogues, temples or other places of worship. They may also work in other institutions such as schools, hospitals and prisons. |
| 4156 | Employment counsellors provide assistance and information to job seeker clients on all aspects of employment search and career planning. They also provide advice and information to employer clients regarding employment issues and human resources. Employment counsellors are employed by human resource departments of establishments, employment service organizations, consulting firms, correctional facilities and by federal and provincial governments. Supervisors of employment counsellors are included in this unit group. | Employment counsellors and career development practitioners provide assistance and information to job seeker clients on all aspects of employment search and career planning. They also provide advice and information to employer clients regarding employment issues and human resources. Employment counsellors and career development practitioners are employed by human resource departments of establishments, employment service organizations, consulting firms, correctional facilities and by federal and provincial governments. Supervisors of employment counsellors are included in this unit group. |
| 4216 | Instructors in this unit group teach courses, such as motor vehicle or motorcycle driving, sailing and navigation, sewing or other courses, which are outside of educational institutions and not primarily job-related. They are employed by driving schools, fabric retailers and other commercial establishments or they may be self-employed. This unit group also includes modelling and finishing school instructors, driver's licence examiners, who are employed by provincial governments and tutors who provide instruction in elementary or secondary school subjects. | Instructors in this unit group teach courses, such as motor vehicle or motorcycle driving, sailing and navigation, sewing or other courses, which are outside of educational institutions. They are employed by driving schools, fabric retailers and other commercial establishments or they may be self-employed. This unit group also includes modelling and finishing school instructors, driver's licence examiners, who are employed by provincial governments and tutors who provide instruction in elementary or secondary school subjects. |
| 4217 | This unit group includes brothers, nuns, monks, religious education workers and others who provide support to ministers of religion or to a religious community and who perform certain functions associated with the practice of a religion. They may perform these duties in churches, synagogues, temples or other places of worship or in institutions such as schools, hospitals and prisons. | This unit group includes brothers, nuns, monks, religious education workers and others who provide support to ministers of religion or to a religious community and who perform certain functions associated with the practice of a religion. They may perform these duties in churches, synagogues, temples or other places of worship; in institutions such as schools, hospitals and prisons; or in industrial facilities, corporate enterprises; or they may work in private practice. |
| 4311 | Police officers protect the public, detect and prevent crime and perform other activities directed at maintaining law and order. They are employed by municipal and federal governments and some provincial and regional governments. This unit group includes railway police. | Police officers protect the public, detect and prevent crime and perform other activities directed at maintaining law and order. They are employed by municipal and federal governments and some provincial and regional governments. |
| 4313 | This unit group consists of Canadian Forces personnel who are non-commissioned officers (NCOs) or members of other non-commissioned ranks. They provide collective defence measures to protect Canadian waters, land, airspace and other interests. All ranks of non-commissioned officers and members in the air force, army, and navy are included in this unit group. | This unit group consists of Canadian Armed Forces personnel who are non-commissioned officers (NCOs) or members of other non-commissioned ranks. They provide collective defence measures to protect Canadian waters, land, airspace and other interests. All ranks of non-commissioned officers and members in the air force, army, and navy are included in this unit group. |
| 4411 | Home child care providers care for children on an ongoing or short-term basis. They care for the well-being and physical and social development of children, assist parents with child care and may assist with household duties. They provide care primarily in their own homes or in the children's homes, where they may also reside. They are employed by private households and child-care agencies, or they may be self-employed. Foster parents are included in this unit group. | Home child care providers care for children on an ongoing or short-term basis. They care for the well-being and physical and social development of children, assist parents with child care and may assist with household duties. They provide care primarily in their own homes or in the children's homes, where they may also reside. They are employed by private households and child-care agencies, or they may be self-employed. |
| 5111 | Librarians select, develop, organize and maintain library collections and provide advisory services for users. They are employed in libraries or in a department within a library. | Librarians select, develop, organize and maintain library collections and provide advisory services for users. They are employed in libraries or other establishments with library services throughout the public and private sectors. |
| 5131 | This unit group includes producers, directors, choreographers and others who oversee and control the technical and artistic aspects of film, television, radio, dance and theatre productions. They are employed by film production companies, radio and television stations, broadcast departments, advertising companies, sound recording studios, record production companies and dance companies. They may also be self-employed. | This unit group includes producers, directors, choreographers and others who oversee and control the technical and artistic aspects of film, television, video game, radio, dance and theatre productions. They are employed by film production companies, radio and television stations, video game companies, broadcast departments, advertising companies, sound recording studios, record production companies and dance companies. They may also be self-employed. |
| 5212 | This unit group includes workers who classify and catalogue museum artifacts and gallery works of art, construct and install exhibits and displays, restore, maintain and store museum and gallery collections, frame artwork, and perform other functions in support of curatorial and conservation activities. They are employed in museums and galleries. Picture framers and taxidermists may also be employed in retail settings or may be self-employed. This unit group also includes museum and other interpreters who conduct guided tours. They are employed by art galleries, museums, parks, aquariums, zoos, interpretive centres, botanical gardens, cultural centres, nature sanctuaries, historic and heritage sites, and other locations. | This unit group includes workers who classify and catalogue museum artifacts and gallery works of art, construct and install exhibits and displays, restore, maintain and store museum and gallery collections, frame artwork, and perform other functions in support of curatorial and conservation activities. They are employed in museums and galleries. Picture framers and taxidermists may also be employed in retail settings or may be self-employed. This unit group also includes museum and other interpreters who conduct guided tours. They are employed by art galleries, museums, parks, aquariums, zoos, interpretive centres, botanical gardens, cultural centres, nature sanctuaries, historic heritage sites, and other locations. |
| 5227 | This unit group includes workers who perform support duties related to broadcasting and to the production of motion pictures and the performing arts. They are employed by television and radio stations and networks, recording studios, motion picture and video production companies and by theatre and stage companies. This unit group also includes projectionists employed by movie theatres. | This unit group includes workers who perform support duties related to broadcasting and to the production of motion pictures and the performing arts. They are employed by television and radio stations and networks, recording studios, motion picture and video production companies and by theatre and stage companies. |
| 5251 | Athletes participate in competitive sports events on an amateur or professional basis. They play team sports such as hockey, baseball, football and lacrosse; or compete in individual sports such as skiing, figure skating, boxing or track and field; or in games such as poker or chess. Athletes are employed by professional team organizations or they may be self-employed. This unit group also includes competitors such as chess players and poker players. | Athletes participate in competitive sports events on an amateur or professional basis. They play team sports such as hockey, baseball, football and lacrosse; or compete in individual sports such as skiing, figure skating, boxing or track and field; or in games such as poker or chess. Athletes are employed by professional team organizations or they may be self-employed. |
| 6211 | Retail sales supervisors supervise and co-ordinate the activities of workers in the following unit groups: Retail Salespersons and Sales Clerks (6421), Cashiers (6611), Grocery Clerks and Store Shelf Stockers (6622) and Other Elemental Sales Occupations (6623). They are employed by stores and other retail businesses, wholesale businesses that sell on a retail basis to the public, rental service establishments and businesses involved in door-to-door soliciting and telemarketing. | Retail sales supervisors supervise and co-ordinate the activities of workers in the following unit groups: Retail Salespersons (6421), Cashiers (6611), Store Shelf Stockers, Clerks and Order Fillers (6622) and Other Sales Related Occupations (6623). They are employed by stores and other retail businesses, wholesale businesses that sell on a retail basis to the public, rental service establishments and businesses involved in door-to-door soliciting and telemarketing. |
| 6322 | Cooks prepare and cook a wide variety of foods. They are employed in restaurants, hotels, hospitals and other health care institutions, central food commissaries, educational institutions and other establishments. Cooks are also employed aboard ships and at construction and logging campsites. Apprentice cooks are included in this unit group. | Cooks prepare and cook a wide variety of foods. They are employed in restaurants, hotels, hospitals and other health care institutions, central food commissaries, educational institutions and other establishments. Cooks are also employed aboard ships and at construction and logging campsites. |
| 6344 | Jewellers and related workers in this unit group fabricate, assemble, repair and appraise fine jewellery. Watch repairers and related workers in this unit group repair, clean, adjust and fabricate parts for clocks and watches. They are employed by jewellery, clock and watch manufacturers and retail stores, by jewellery and watch repair shops or they may be self-employed. | Jewellers and related workers fabricate, assemble, repair and appraise fine jewellery. Watch repairers and related workers repair, clean, adjust and fabricate parts for clocks and watches. They are employed by jewellery, clock and watch manufacturers and retail stores, by jewellery and watch repair shops or they may be self-employed. |
| 6523 | Airline ticket and service agents issue tickets, provide fare quotations, make reservations, conduct passenger check-in, trace missing baggage, arrange for cargo shipments and perform other related customer service duties to assist airline passengers. Airline ticket and service agents are employed by airline companies. Load planners, who plan the positioning of cargo on aircraft, are also included in this unit group. | Airline ticket and service agents issue tickets, provide fare quotations, make reservations, conduct passenger check-in, trace missing baggage, arrange for cargo shipments and perform other related customer service duties to assist airline passengers. Airline ticket and service agents are employed by airline companies. |
| 6524 | Ticket agents, cargo service representatives and related clerks (except airline), quote fares and rates, make reservations, issue tickets, process cargo shipment, check baggage and perform other related customer service duties to assist travellers. They are employed by bus and railway companies, freight forwarding and shipping companies, boat cruise operators and other public transit establishments and by travel wholesalers. | Ground and water transport ticket agents, cargo service representatives and related clerks, quote fares and rates, make reservations, issue tickets, process cargo shipments, check baggage and perform other related customer service duties to assist travellers. They are employed by bus and railway companies, freight forwarding and shipping companies, boat cruise operators and other public transit establishments and by travel wholesalers. |
| 6533 | Casino workers operate gaming tables, maintain slot machines, accept keno wagers, pay out winning bets and jackpots and collect losing bets. They are employed by casinos. | Casino workers operate gaming tables, assist patrons using slot machines, accept keno wagers, pay out winning bets and jackpots and collect losing bets. They are employed by casinos. |
| 6552 | This unit group includes customer and information services representatives who answer enquiries and provide information regarding an establishment's goods, services and policies and who provide customer services such as receiving payments and processing requests for services. They are employed by retail establishments, contact centres, insurance, telephone and utility companies and other establishments throughout the private and public sectors. | This unit group includes customer and information services representatives who answer enquiries and provide information regarding an establishment's goods, services and policies and who provide customer services such as receiving payments and processing requests for services. They are employed by retail establishments, contact centres, insurance, telecommunications and utility companies and other establishments throughout the private and public sectors. |
| 6562 | Workers in this unit group provide facial and body treatments designed to enhance an individual's physical appearance. They are employed in beauty salons, electrolysis studios, scalp treatment and hair replacement clinics and other similar establishments and in cosmetic departments of retail establishments such as pharmacies and department stores, or they may be self-employed. | Estheticians, electrologists and related workers in this unit group provide facial and body treatments designed to enhance an individual's physical appearance. They are employed in beauty salons, electrolysis studios, scalp treatment and hair replacement clinics and other similar establishments and in cosmetic departments of retail establishments such as pharmacies and department stores, or they may be self-employed. |
| 6622 | Grocery clerks and store shelf stockers pack customers' purchases, price items, stock shelves with merchandise, and fill mail and telephone orders. They are employed in retail establishments, such as grocery, hardware and department stores, and in warehouses. | Store shelf stockers, clerks and order fillers pack customers' purchases, price items, stock shelves with merchandise, and fill mail and telephone orders. They are employed in retail establishments, such as grocery, hardware and department stores, and in warehouses. |
| 6711 | Workers in this unit group include counter attendants, food preparers, kitchen helpers, food service helpers and dishwashers. Counter attendants and food preparers prepare, heat and finish cooking simple food items and serve customers at food counters. Kitchen helpers, food service helpers and dishwashers clear tables, clean kitchen areas, wash dishes, and perform various other activities to assist workers who prepare or serve food and beverages. They are employed by restaurants, cafes, hotels, fast food outlets, cafeterias, hospitals and other establishments. | Food counter attendants and food preparers prepare, heat and finish cooking simple food items and serve customers at food counters. Kitchen helpers, food service helpers and dishwashers clear tables, clean kitchen areas, wash dishes, and perform various other activities to assist workers who prepare or serve food and beverages. They are employed by restaurants, cafés, hotels, fast food outlets, cafeterias, hospitals and other establishments. |
| 6722 | This unit group includes amusement occupations such as operators of amusement rides, games and other attractions, and attendants in amusement, recreation and sports facilities who assist patrons, collect tickets and fees and supervise the use of recreational and sports equipment. They are employed by amusement parks, fairs, exhibitions, carnivals, arenas, billiard parlours, bowling alleys, golf courses, ski centres, tennis clubs, campgrounds and other recreational and sports facilities. | This unit group includes operators of amusement rides, games and other attractions, and attendants in amusement, recreation and sports facilities who assist patrons, collect tickets and fees and supervise the use of recreational and sports equipment. They are employed by amusement parks, fairs, exhibitions, carnivals, arenas, billiard parlours, bowling alleys, golf courses, ski centres, tennis clubs, campgrounds and other recreational and sports facilities. |
| 6731 | Light duty cleaners clean the lobbies, hallways, offices and rooms of hotels, motels, resorts, hospitals, schools, office and other buildings, and private residences. They are employed by hotels, motels, resorts, recreational facilities, hospitals and other institutions, building management companies, cleaning service companies and private individuals. | Light duty cleaners clean lobbies, hallways, offices and rooms of hotels, motels, resorts, hospitals, schools, office buildings and private residences. They are employed by hotels, motels, resorts, recreational facilities, hospitals and other institutions, building management companies, cleaning service companies and private individuals. |
| 6733 | Janitors, caretakers and building superintendents clean and maintain the interior and exterior of commercial, institutional and residential buildings and their surrounding grounds. Building superintendents employed in large establishments are responsible for the operation of the establishment and may also supervise other workers. They are employed by office and apartment building management companies, condominium corporations, educational institutions, health care facilities, recreational and shopping facilities, religious establishments, and industrial and other establishments. | Janitors, caretakers and building superintendents clean and maintain the interior and exterior of commercial, institutional and residential buildings and their surrounding grounds. Building superintendents employed in large establishments are responsible for the operation of the establishment and may also supervise other workers. They are employed by office and apartment building management companies, condominium corporations, educational institutions, health care facilities, recreational and shopping facilities, religious, industrial and other establishments. |
| 6742 | This unit group includes other support occupations, not elsewhere classified, primarily concerned with the provision of services. Those in occupations in this unit group are employed by a wide range of establishments, and may be self-employed. | This unit group includes other support occupations, not elsewhere classified, primarily concerned with the provision of services. Workers in this unit group are employed in a wide range of establishments or may be self-employed. |
| 7291 | Roofers install, repair or replace flat roofs and shingles, shakes or other roofing tiles on sloped roofs. Shinglers install and replace shingles, tiles and similar coverings on sloped roofs. They are employed by roofing and general contractors, or they may be self-employed. | Roofers install, repair or replace flat roofs as well as shingles, shakes or other roofing tiles on sloped roofs. Shinglers install and replace shingles, tiles and similar coverings on sloped roofs. They are employed by roofing and general contractors, or they may be self-employed. |
| 7313 | Refrigeration and air conditioning mechanics install, maintain, repair and overhaul residential central air conditioning systems, commercial and industrial refrigeration and air conditioning systems and combined heating, ventilation and cooling systems. They are employed by refrigeration and air conditioning installation contractors, various industrial settings, food wholesalers, engineering firms and retail and servicing establishments. Transport refrigeration mechanics are included in this unit group. | Heating, refrigeration and air conditioning mechanics install, maintain, repair and overhaul residential central air conditioning systems, commercial and industrial refrigeration and air conditioning systems and combined heating, ventilation and cooling systems. They are employed by heating, refrigeration and air conditioning installation contractors, various industrial settings, food wholesalers, engineering firms and retail and servicing establishments. Transport refrigeration mechanics are included in this unit group. |
| 7334 | Mechanics in this unit group test, repair and service motorcycles, motor scooters, snowmobiles, forklifts and all-terrain vehicles. They are employed by service shops of motorcycle dealers and retailers and by independent service establishments. | Mechanics in this unit group test, repair and service motorcycles, motor scooters, snowmobiles, outboard motors, forklifts and all-terrain vehicles. They are employed by service shops of motorcycle dealers and retailers and by independent service establishments. |
| 7335 | Workers in this unit group test, repair and service small gasoline and diesel-powered engines and equipment, such as garden tractors, outboard motors, lawn mowers and other related equipment. They are employed by dealer service shops and by independent service establishments. | Workers in this unit group test, repair and service small gasoline and diesel-powered engines and equipment, such as garden tractors, lawn mowers and other related equipment. They are employed by dealer service shops and by independent service establishments. |
| 7532 | Workers in this unit group stand watch, operate and maintain deck equipment, perform other deck and bridge duties, assist ship engineer officers to operate, maintain and repair engines, machinery and auxiliary equipment aboard ships or self-propelled vessels. They are employed by marine transportation companies and federal government departments. | Workers in this unit group stand watch, operate and maintain deck equipment, perform other deck and bridge duties and assist ship engineer officers to operate, maintain and repair engines, machinery and auxiliary equipment aboard ships or self-propelled vessels. They are employed by marine transportation companies and federal government departments. |
| 8222 | Supervisors in this unit group supervise and co-ordinate the activities of workers engaged in drilling for oil or gas, operating service rigs, or providing oil and gas well services. They are employed by drilling and well service contracting companies and by petroleum producing companies. This unit group includes oilfield consultants who may be self-employed. | Supervisors in this unit group supervise and co-ordinate the activities of workers engaged in drilling for oil or gas, operating service rigs, or providing oil and gas well services. They are employed by drilling and well service contracting companies and by petroleum producing companies. Oil field consultants may be self-employed. |
| 8252 | Agricultural service contractors, who own and operate their own businesses, provide agricultural services such as livestock and poultry breeding, soil preparation, crop planting, crop spraying, cultivating or harvesting. Farm supervisors supervise the work of general farm workers and harvesting labourers. Specialized livestock workers carry out feeding, health and breeding programs on dairy, beef, sheep, poultry, hog and other livestock farms. | Agricultural service contractors, who own and operate their own businesses, provide agricultural services such as livestock and poultry breeding, soil preparation, crop planting, crop spraying, cultivating or harvesting. Farm supervisors supervise the work of general farm workers and harvesting labourers. Specialized livestock workers carry out feeding, health and breeding programs on dairy, beef, sheep, poultry, swine and other livestock farms. |
| 8262 | Fishermen/women operate fishing vessels to pursue and land fish and other marine life. They are usually self-employed owner-operators of fishing vessels. | Fishermen/women operate fishing vessels less than 100 gross tonnes to pursue and land fish and other marine life. They are usually self-employed owner-operators of fishing vessels. |
| 8613 | This occupational group includes aquaculture support workers, marine plant gatherers, shellfish diggers and other labourers in aquaculture and fishing. Aquaculture support workers are employed by public or private fish hatcheries and commercial aquatic farms. Marine plant gatherers and shellfish harvesters may be self-employed. | This occupational group includes aquaculture support workers, marine plant gatherers, shellfish diggers and other labourers in aquaculture and fishing. Aquaculture support workers are employed by public or private fish hatcheries and commercial aquatic farms. Marine plant gatherers and mollusk harvesters may be self-employed. |
| 9211 | Supervisors, mineral and metal processing, supervise and co-ordinate the activities of workers in the following groups: Central Control and Process Operators, Mineral and Metal Processing (9231), Machine Operators and Related Workers in Metal and Mineral Products Processing and Manufacturing (941) and Labourers in Mineral and Metal Processing (9611). They are employed in mineral ore and metal processing plants such as copper, lead and zinc refineries, uranium processing plants, steel mills, aluminum plants, precious metal refineries, cement processing plants, clay, glass and stone processing plants and foundries. | Supervisors in this unit group supervise and co-ordinate the activities of workers engaged in mineral and metal processing and manufacturing. They are employed in mineral ore and metal processing plants such as copper, lead and zinc refineries, uranium processing plants, steel mills, aluminum plants, precious metal refineries, cement processing plants, clay, glass and stone processing plants and foundries. |
| 9213 | Supervisors in this unit group supervise and co-ordinate the activities of workers who operate processing and packaging machines, and workers who grade food, beverage and associated products. They are employed in fruit and vegetable processing plants, dairies, flour mills, bakeries, sugar refineries, fish plants, meat plants, breweries and other food, beverage and associated products processing establishments. | Supervisors in this unit group supervise and co-ordinate the activities of workers who operate processing and packaging machines, and workers who grade food and beverage products. They are employed in fruit and vegetable processing plants, dairies, flour mills, bakeries, sugar refineries, fish plants, meat plants, breweries and other food and beverage processing establishments. |
| 9215 | Supervisors in this unit group supervise and co-ordinate the activities of workers in the following groups: Pulping, Papermaking and Coating Control Operators (9235), Machine Operators and Related Workers in Pulp and Paper Production and Wood Processing and Manufacturing (943) and Labourers in Wood, Pulp and Paper Processing (9614). They are employed by pulp and paper companies, paper converting companies, sawmills, planing mills, wood treatment plants, waferboard plants and other wood processing companies. | Supervisors in this unit group supervise and co-ordinate the activities of workers engaged in pulp and paper production and wood processing and manufacturing. They are employed by pulp and paper companies, paper converting companies, sawmills, planing mills, wood treatment plants, waferboard plants and other wood processing companies. |
| 9232 | Petroleum, gas and chemical process operators monitor and operate petroleum, petrochemical and chemical plants and monitor, adjust and maintain processing units and equipment in these plants. They are employed by petroleum and natural gas processing, pipeline and petrochemical companies and industrial, agricultural and specialty chemical and pharmaceutical companies. | Central control and process operators in this unit group monitor and operate petroleum, petrochemical and chemical plants and monitor, adjust and maintain processing units and equipment in these plants. They are employed by petroleum and natural gas processing, pipeline and petrochemical companies and industrial, agricultural and specialty chemical and pharmaceutical companies. |
| 9241 | Power engineers operate and maintain reactors, turbines, boilers, generators, stationary engines and auxiliary equipment to generate electrical power and to provide heat, light, refrigeration and other utility services for commercial, industrial and institutional buildings and other work sites. Power systems operators monitor and operate switchboards and related equipment in electrical control centres to control the distribution of electrical power in transmission networks. They are employed by power generation plants, electrical power utilities, manufacturing plants, hospitals, universities and government and commercial establishments. | Power engineers operate and maintain reactors, turbines, boilers, generators, stationary engines and auxiliary equipment to generate electrical power and to provide heat, light, refrigeration and other utility services for commercial, institutional and industrial plants and facilities. Power systems operators monitor and operate switchboards and related equipment in electrical control centres to control the distribution of electrical power in transmission networks. They are employed by power generation plants, electrical power utilities, manufacturing plants, hospitals, universities and government and commercial establishments. |
| 9411 | Workers in this unit group operate single-function machines or machinery that is part of a larger production process to process mineral ore and metal products. They are employed in mineral ore and metal processing plants such as copper, lead and zinc refineries, uranium processing plants, steel mills, aluminum plants, precious metal refineries and cement processing plants. | Workers in this unit group operate machinery to process mineral ore and metal. They are employed in mineral ore and metal processing plants such as copper, lead and zinc refineries, uranium processing plants, steel mills, aluminum plants, precious metal refineries and cement processing plants. |
| 9461 | Process control and machine operators in this unit group operate multi-function process control machinery and single-function machines to process and package food, beverage and associated products. They are employed in fruit and vegetable processing plants, dairies, flour mills, bakeries, sugar refineries, meat plants, breweries, leaf tobacco products plants and other food, beverage and associated products processing establishments. | Process control and machine operators in this unit group operate multi-function process control machinery and single-function machines to process and package food and beverage products. They are employed in fruit and vegetable processing plants, dairies, flour mills, bakeries, sugar refineries, meat plants, breweries, and other food and beverage processing establishments. |
| 9462 | Workers in this unit group prepare meat and poultry for further processing, for packaging or for marketing. They are employed in meat and poultry slaughtering, processing and packing establishments. | Workers in this unit group prepare meat and poultry for further processing or for packaging for wholesale distribution. They are employed in meat and poultry slaughtering, processing and packing establishments. |
| 9465 | Testers and graders in this unit group test or grade ingredients and finished food, beverage or associated products to ensure conformance to company standards. They are employed in fruit and vegetable processing plants, dairies, flour mills, bakeries, sugar refineries, fish plants, meat plants, breweries and other food, beverage and associated products processing plants. | Testers and graders in this unit group test or grade ingredients and finished food or beverage products to ensure conformance to company standards. They are employed in fruit and vegetable processing plants, dairies, flour mills, bakeries, sugar refineries, fish plants, meat plants, breweries and other food and beverage processing plants. |
| 9617 | Labourers in this unit group perform material handling, clean-up, packaging and other elemental activities related to food, beverage and associated products processing. They are employed in fruit and vegetable processing plants, dairies, flour mills, bakeries, sugar refineries, meat plants, breweries and other food, beverage and associated products processing and packaging plants. | Labourers in this unit group perform material handling, clean-up, packaging and other elemental activities related to food and beverage processing. They are employed in fruit and vegetable processing plants, dairies, flour mills, bakeries, sugar refineries, meat plants, breweries and other food and beverage processing and packaging plants. |
Some job titles were moved from one unit group to another to better define the content of the unit groups.
| Titles | NOC 2011 unit group | NOC 2016 Version 1.0 unit group |
|---|---|---|
| admission director – health care | 0311 | 0114 |
| tax collector; collector of taxes | 1435 | 1228 |
| fire suppression crew foreman/woman - forestry | 8211 | 2223 |
| prevention officer - occupational health and safety | 4165 | 2263 |
Overview of the NOC 2016 Version 1.1 update
The NOC 2016 Version 1.1 was released in December 2017. This version was created, in conjunction with ESDC, to address updates requested following the May 2017 Public Consultation invitation to participate in the update of NOC. The summary of the changes made to this version can be viewed at the following link: Notice of release of the National Occupational Classification (NOC) 2016 Version 1.1.
Overview of the NOC 2016 Version 1.2 update
The NOC 2016 Version 1.2 was released in December 2018 and created, in conjunction with ESDC. This update of the classification was completed in response to the legalization of cannabis for non-medical use. This has resulted in twenty five new job titles being created in NOC 2016 V1.2 to reflect new occupations in the cannabis industries.
The summary of the changes made to this version can be viewed at the following link: Notice of release of the National Occupational Classification (NOC) 2016 Version 1.2.
Overview of the NOC 2016 Version 1.3 update
The NOC 2016 Version 1.3 will be updated in December 2019 and has been developed in conjunction with ESDC. This update of the classification was completed in response to evergreening process, of keeping up with the labour market trends.
The summary of the changes made to this version can be viewed at the following link: Notice of release of the National Occupational Classification (NOC) 2016 Version 1.3.
NOC classification criteria
The two major attributes of jobs used as classification criteria in developing the NOC are skill type and skill level. A description of skill levels is presented first as the definitions of skill types incorporate some information related to the concept of skill level. Other factors, such as industry and occupational mobility, are also taken into consideration.
Skill level
Skill level is defined first of all by the amount and type of education and training required to enter and perform the duties of an occupation. In determining skill level, the experience required for entry, and the complexity and responsibilities typical of an occupation are also considered in relation to other occupations.
Four skill level categories are identified in the NOC. Each major, minor and unit group is assigned to one of the skill levels.
The skill level categories are broad aggregates, reflecting four commonly accepted educational, training or preparatory routes for entering employment. Requirements for individual unit groups or occupations may overlap between the boundaries of the skill levels. For example, some occupations can be entered with either a university degree or a college diploma. When the entry requirements for a unit group or occupation reflect a range of possible educational and training specifications, skill level placement of the group was determined by considering several factors. These include the requirements most generally demanded by employers, the minor group context, complexity of overall responsibilities and knowledge requirements as well as further training and specialization acquired on the job.
The classification describes the educational and training requirements for occupations. However, the education and experience of particular job incumbents may not correspond exactly to the level described. Individuals may be over-qualified for their work or they may work in occupations for which the entry requirements have changed after they became employed.
It is important to note that the skill level categories are not intended to designate socio-economic status or prestige. Rather they are intended to reflect actual occupational entry requirements. These requirements are expressed in terms of the formal educational system and other types of training specified by employers.
Management occupations, while considered a skill type, are assigned to the skill level A category. These occupations are at the top of organizational hierarchies and as such, are characterized by high levels of responsibility, accountability and subject matter expertise gained through either formal education or extensive occupational experience. Management occupations span the entire classification structure and are found in all sectors or areas of the labour market. A range of factors are taken into consideration as determinants for employment in management occupations.
The skill level categories of the NOC are outlined and defined below.
NOC skill level criteria - education/training and other criteria
Skill level A
- University degree (bachelor's, master's or doctorate)
Skill level B
- Two to three years of post-secondary education at community college, institute of technology or CÉGEP
or - Two to five years of apprenticeship training
or - Three to four years of secondary school and more than two years of on-the-job training, occupation-specific training courses or specific work experience
- Occupations with supervisory responsibilities are also assigned to skill level B.
- Occupations with significant health and safety responsibilities (e.g., fire fighters, police officers and licensed practical nurses) are assigned to skill level B.
Skill level C
- Completion of secondary school and some short-duration courses or training specific to the occupation
or - Some secondary school education, with up to two years of on-the-job training, training courses or specific work experience
Skill level D
- Short work demonstration or on-the-job training
or - No formal educational requirements
Skill level is referenced in the code for all occupations with the exception of management occupations. For all non-management occupations the second digit of the numerical code corresponds to skill level. Skill levels are identified as follows: level A – 0 or 1; level B – 2 or 3; level C – 4 or 5; and level D – 6 or 7.
Skill type
Skill type is defined as the type of work performed, although other factors related to skill type are also reflected in the NOC. One of these factors is similarity with respect to the educational discipline or field of study required for entry into an occupation. Another factor is the industry of employment where experience within an internal job ladder or within a specific industry is usually a prerequisite for entry. The 10 skill types, 0 to 9, are presented below and are also identified in the first digit of the NOC numerical code for all occupations.
The ten broad occupational categories of the NOC are based on skill type.
0. Management occupations
This skill type category contains legislators, senior management occupations and middle management occupations. While management occupations are defined as a skill type, they are also found throughout all other skill type areas of the classification. The first digit of the code for all management occupations is 0.
These occupations are considered to be at the top of the organizational hierarchy of workplaces or businesses. Decision-making that affects the organization as a whole, or departments within organizations, is undertaken by management. As such, management is characterized by high levels of responsibility, accountability and subject matter expertise. Expertise is acquired through either formal education or extensive occupational experience. For these reasons all management occupations in the NOC 2016 are also included within skill level A.
1. Business, finance and administration occupations
This category contains occupations that are concerned with providing financial and business services, administrative and regulatory services and clerical supervision and support services. Some occupations in this category are unique to the financial and business service sectors; however, most are found in all industries.
Often, occupations at skill levels A and B are supplied from educational programs specific to the profession or occupation. Some occupations at skill level B are also supplied from experienced workers in related administrative support occupations.
2. Natural and applied sciences and related occupations
This category contains professional and technical occupations in the sciences, including physical and life sciences, engineering, architecture and information technology.
Occupations in this skill type category require post-secondary education in an appropriate scientific discipline. Progression from occupations in skill level B to occupations in skill level A is usually dependent on completion of additional formal education.
3. Health occupations
This category includes occupations concerned with providing health care services directly to patients and occupations that provide support to professional and technical staff. Most occupations in this skill type category require post-secondary education in a related health care program. Progression from occupations in skill level B to occupations in skill level A is usually dependent on completion of additional formal education. Occupations in skill level C require short training programs.
4. Occupations in education, law and social, community and government services
This skill type category includes a range of occupations that are concerned with law, teaching, counselling, conducting social science research, developing government policy, and administering government and other programs.
Occupations in this skill type category usually require completion of a related post-secondary program. Progression from occupations in skill level B to occupations in skill level A is not usually possible without completion of additional formal education.
5. Occupations in art, culture, recreation and sport
This skill type category includes professional and technical occupations related to art and culture, including the performing arts, film and video, broadcasting, journalism, writing, creative design, libraries and museums. It also includes occupations in recreation and sport.
This category is characterized by occupations which are linked by subject matter to formal post-secondary educational programs but which have, for the most part, a range of acceptable qualifications. Occupations in this category are also characterized by a requirement for creative talent, such as for designers and performers, or for athletic ability. Unit groups for occupations that usually require university graduation in a professional discipline, such as journalism or library science, have been classified in skill level A. Most others have been classified in skill level B in recognition of the wide range of entry routes that are possible.
6. Sales and service occupations
This skill type category contains sales occupations, personal and protective service occupations and occupations related to the hospitality and tourism industries.
Occupations in skill level B of this category can be linked, for the most part, to formal post-secondary or occupation-specific training programs. Others are characterized by periods of formal on-the-job training other than apprenticeship. Progression from occupations in skill level C or D to those in skill level B usually require completion of related training programs. Some progression through experience is possible for supervisory positions.
7. Trades, transport and equipment operators and related occupations
This skill type category includes construction and mechanical trades, trades supervisors and contractors and operators of transportation and heavy equipment. These occupations are found in a wide range of industrial sectors, with many occurring in the construction and transportation industries.
This category includes most of the apprenticeable trades, including all of those related to the construction industry. Other occupations in this category usually require completion of college or other programs combined with on-the-job training. Progression to supervisory or self-employed contractor status is possible with experience. There is limited mobility or transferability of skills among occupations in this category due to specific apprenticeship, training and licensing requirements for most occupations.
8. Natural resources, agriculture and related production occupations
This category contains supervisory and equipment operation occupations in the natural resource-based sectors of mining, oil and gas production, forestry and logging, agriculture, horticulture and fishing. Most occupations in this category are industry specific and do not occur outside of the primary industries.
Occupations within skill level B of this category generally require completion of college or other post-secondary training programs. Some, however, are characterized by industry-based training and progression through experience.
9. Occupations in manufacturing and utilities
This category contains supervisory and production occupations in manufacturing, processing and utilities.
Occupations in this category are characterized by internal progression and on-the-job training. Workers typically start out in these occupations at entry-level positions and progress to increasingly higher skilled occupations through experience. Mobility between employers or industries may be limited by seniority provisions of collective agreements. The occupations in skill level B of this category are increasingly technical in nature and post-secondary training programs are required for some.
Industry
Industry and occupation are separate variables which can be cross-tabulated to provide detailed information on employment. However, many occupations are found almost solely within one particular industry. For example, mining and automobile assembly occupations occur each within their respective industrial sectors.
During the original research and development of the NOC, it was realized that in many industries, occupational mobility is determined more by internal job ladders than by functional specialization. In consequence, some unit groups include workers of a particular skill level within a specific industry. Although the occupational breakdown resembles in part an industrial breakdown, the variables remain separate and distinct.
Industry was used in the development of classification categories for senior management occupations, for occupations in natural resources, agriculture and related production and for occupations in manufacturing and utilities.
Occupational mobility
In developing the NOC, an effort was made to consider mobility or transferability of skills between occupations. The objective was to develop unit groups where the potential for mobility, or substitution of workers, would be greater within the group than between groups. Movement within groups usually follows when the group is homogeneous in skill level and skill type, indicating increased potential for transferability of competencies and development of specialization. Movement between groups, or inter-occupational mobility, usually reflects a change in skill level (e.g., vertical mobility) or a change in skill type (e.g., acquisition of new responsibilities and diversified skills).
The degree of occupational mobility that exists for unit groups varies. Many unit group descriptions include a statement that indicates the potential for, and type of, mobility that characterizes the unit group.
Other classification considerations
In addition to the previously mentioned criteria, other factors were considered in determining the boundaries between unit groups and the contents of each group. These additional factors were the size of the unit groups and the codability or operational feasibility of the groups. Codability relates to the ease of accurately coding or assigning reported job titles from survey respondents to the occupational groups of the classification.
The size (or estimated number of workers) of the unit group was considered for reasons of statistical reliability and confidentiality. Generally, unit groups which contain fewer than 1,000 Canadian workers have not been delineated.
Because the NOC structure is used to code responses to Census of Population, Labour Force Surveys and other surveys, it must provide a set of unit groups that can be used for this operational application. The insufficient precision of some survey responses and ambiguities of language were given consideration in finalizing the unit groups.
Issues and conventions of the NOC
Some of the many issues that were encountered in the development of the NOC and the conventions adopted in response are discussed in the following paragraphs.
Management occupations
Management occupations present a special problem for reliable coding of occupational survey responses. In many cases there is little indication of the level of responsibility, the size of the enterprise or division managed, or the field of specialization.
To be of practical use, a classification of managers must be a compromise between the theoretically optimal and the practical solutions.
Senior management occupations (in major group 00) have been divided on the basis of industry of employment into six unit groups.
Middle and other management occupations are divided into three major groups, 18 minor groups and 42 unit groups on the basis of specialization (e.g., Purchasing managers) or industry of employment (e.g., Postal and courier services managers). In certain cases (e.g., Managers in transportation) groups defined by industry also contain managers in that specialization regardless of their industry of employment.
Supervisors
Supervisors and foremen/women have generally been classified in skill level B.
In most cases, professional and technical occupations are supervised by managerial or professional personnel respectively. However, where supervisors are identified for professional and technical groups, they are generally classified in the same unit groups as the occupations supervised.
Supervisors in the following occupational categories have been classified in supervisor unit groups or minor groups separate from the workers supervised:
- administrative services occupations
- nursing occupations
- sales and service occupations
- trades and transport and equipment operators
- occupations in natural resources and agriculture
- occupations in manufacturing and utilities.
Most minor and unit groups in the occupational categories listed above have a corresponding supervisory group. Occasionally, as in minor group 431, Occupations in front-line public protection services, supervision is provided by managers and there are no corresponding supervisory groups in major group 43.
Trades
All apprenticeable trades are included in skill level B. Their inclusion does not imply an exact equivalence of skill between all trades, but rather that they occupy a range that lies within the boundaries of this skill level category. Information on entry requirements is provided within each unit group description.
Inspectors, testers and graders
Generally, inspectors who require post-secondary education have been classified in separate unit groups in skill level B or with technicians and technologists, also in skill level B. Other non-technical inspectors, testers, graders and samplers have been included either in separate unit groups covering occupations in processing industries or in unit groups of assemblers and fabricators in manufacturing industries. This is reflective of patterns of employment found within industries and the increasing responsibility for quality control that is placed on manufacturing production workers.
Apprentices and trainees
Apprentices and trainees have been classified in the same unit groups as the occupations for which they are training. Similarly, interns, residents and articling students are classified with their respective professional groups.
This convention has been adopted of necessity to prevent a proliferation of unit groups of apprentices. It is not intended to imply equivalence or interchangeability of apprentices or trainees with fully qualified workers.
Coding to NOC 2016
The NOC provides an overall structure for classifying occupations according to kind of work performed. The lists of example titles are merely indicative of the types of occupations that fit within specific unit groups. The lists of example titles are not exhaustive nor are they intended to be.
When coding an occupation, all the relevant facts about the job and its environment should be obtained. These include the kind of work performed, the most important activities or duties, the job titles, the kind of business, industry or service, and the class of worker described earlier. The more complete and comprehensive the information the coder is able to assemble about the duties performed by a worker on a particular job, the easier it will be to determine the appropriate classification.
To code an occupation, it is possible to start with either the classification structure or the search tool.
Coding and the NOC 2016 classification structure
When using the NOC for coding, it is best to exploit the hierarchical nature of the classification. First the broad occupational category (skill type) which seems most likely to contain the job should be identified. Next the most appropriate major group within the broad occupational category should be found. Skill level can also provide a guide to locating major groups by considering titles with terms such as "technical", "supervisor", "helper", and "labourer". The process should be continued to find the most appropriate minor group within the major group selected. Finally the most appropriate unit group within the minor group selected should be identified. The unit group definition should be read carefully before deciding if this unit group offers the best possible classification. In addition, the example titles listed for the unit group should be examined to ensure that the choice is actually the best.
As indicated previously, the first two digits of each code convey meaning with respect to the group's skill type and skill level category.
For all occupations, including management, the first digit of each code identifies the major, minor and unit group as belonging to one of the skill type categories. However, all management occupations are also included as part of skill level A.
For all non-management occupations, the second digit of each code identifies the major, minor and unit group as belonging to one of the four skill level categories.
For management occupations, the first two digits also convey meaning. The first digit is always 0 to convey management, while the second digit conveys the skill type category in which the management occupation is found.
The following charts summarize and illustrate the meanings embedded in the coding system.
| The skill type category is… | when the first digit is… |
|---|---|
| Management occupations | 0 |
| Business, finance and administration occupations | 1 |
| Natural and applied sciences and related occupations | 2 |
| Health occupations | 3 |
| Occupations in education, law and social, community and government services | 4 |
| Occupations in art, culture, recreation and sport | 5 |
| Sales and service occupations | 6 |
| Trades, transport and equipment operators and related occupations | 7 |
| Natural resources, agriculture and related production occupations | 8 |
| Occupations in manufacturing and utilities | 9 |
| The skill level category is… | when the second digit is… |
|---|---|
| Skill Level A | 0 or 1 |
| Skill Level B | 2 or 3 |
| Skill Level C | 4 or 5 |
| Skill Level D | 6 or 7 |
Important note:
For management, the first digit is always 0. Senior managers in major group 00 are generally managers of middle managers, therefore the second digit is also 0. For middle management occupations, the second digit represents the skill type categories, from 1 to 9, as above. All management occupations are included in skill level A.
Examples of codes and their meaning
9231
The first digit indicates skill type category 9 : Occupations unique to processing, manufacturing and utilities
The second digit indicates skill level category B
6533
The first digit indicates skill type category 6: Sales and service occupations
The second digit indicates skill level category C
0212
The first digit 0 always indicates a management occupation
All management occupations are part of skill level A
The second digit indicates management in skill type category 2 : Natural and applied sciences and related occupations
Coding procedures for problem responses
The procedure described above assumes responses contain sufficient information for coding. Unfortunately, depending upon the survey methods used, some responses may be problematic. This occurs when the information in the response is either vague or contradictory. Experience at Statistics Canada suggests the following approaches to resolving such problems.
1) Coding vague responses
It is suggested that vague responses be coded only to the level within the classification that is possible. Of course, before doing so, any information that is available about the respondent should be consulted.
2) Using education in coding
This is especially useful in coding occupational responses that are vague. The most reliable way of using education is as an exclusionary edit. Certain occupations require a minimum education and it is possible to exclude vague responses from being coded to such occupations if the respondent does not have the minimum education required. Great care must be taken when using education in occupational coding and it should only be used as a last resort.
3) Coding when the response contains contradictory information
Sometimes the responses will give a title and a description of work performed that are contradictory. A response "labourer, driving dump truck" is contradictory in terms of the classification, as driving a truck is not considered elemental work. This response should be coded as a truck driver in 7511 Transport truck drivers.
In general, it is best to let the description of the work performed predominate over titles when coding.
Some titles can be misleading. Titles that have manager as part of the title are sometimes not managers. For example, project managers and case managers are usually not managers and must be coded based on a description of their work. Special care must be given to responses that have manager, labourer, or consultant as part of the title as these terms have a variety of meanings in the workplace.
4) Coding responses containing two or more occupations
Where two or more occupations are reported in reply to a question on occupation, the first one mentioned should be coded unless there is additional information to suggest otherwise.
Classification rules to consider when coding
Managers
Managers are usually classified to the broad occupational category 0 Management Occupations. Within this category the senior managers that are the top of a management hierarchy as denoted by terms such as president, chief executive officer, etc. are classified in major group 00 Senior management occupations.
Managers with a management specialty, such as human resource management, are classified according to specialty in major group 01-05 Specialized middle management occupations. However, senior managers with a specialist responsibility would be classified with senior management in major group 00 Senior management occupations.
An attempt has been made to isolate many of the managers of small businesses by classifying managers of retail stores, restaurants, hotels and similar businesses in a separate major group 06 Middle management occupations in retail and wholesale trade.
All other managers are classified according to the type of business managed within major group 07-09 Middle management occupations in trades, transportation, production and utilities.
Proprietors
As a general rule, the class of worker status, that is, whether the respondent works for wages or is self-employed, is not considered for classification purposes. An exception is made for proprietors in retail trade, food and accommodation services and residential home building. These are classified as managers to the following unit groups:
- 0621 - Retail and wholesale trade managers
- 0631 - Restaurant and food service managers
- 0632 - Accommodation service managers
- 0712 - Home building and renovation managers
Contractors
Contractors are classified in several areas of the classification. General contractors in construction are classified in unit group 0711 Construction managers. Renovation contractors and home building contractors are classified in unit group 0712 Home building and renovation managers.
Contractors specializing in a specific trade such as plumbing, electrical, carpentry, etc., are classified together with supervisors to the appropriate unit group for that trade. That is, a plumbing contractor is classified to unit group 7203 Contractors and supervisors, pipefitting trades.
Supervisors and foremen/women
Supervisors are classified to separate unit groups for supervisors where they exist. These are found in the following minor groups for supervisors:
- 121 - Administrative services supervisors
- 621 - Retail sales supervisors
- 631 - Service supervisors
- 720 - Contractors and supervisors, industrial, electrical and construction trades and related workers
- 730 - Contractors and supervisors, maintenance trades and heavy equipment and transport operators
- 821 - Supervisors, logging and forestry
- 822 - Contractors and supervisors, mining, oil and gas
- 825 - Contractors and supervisors, agriculture, horticulture and related operations and services
- 921 - Supervisors, processing and manufacturing occupations
- 922 - Supervisors, assembly and fabrication
This unit group for supervisors is found outside of the supervisor minor groups:
- 3011 - Nursing co-ordinators and supervisors
Where a separate unit group does not exist, supervisors are classified with the workers supervised. For example, in most professional major groups there are no separate unit groups for supervisors, the one exception being unit group 3011 Nursing co-ordinators and supervisors.
Technical occupations follow a similar rule and there are no separate unit groups for supervisors in this area.
Even where separate supervisory unit groups exist, "lead hands" are not classified to them as previous research has indicated that supervision is usually only a minor part of such jobs.
Apprentices
Apprentices are classified within the groups for tradesmen/women. For example an apprentice carpenter is classified to the appropriate trade group, unit group 7271 Carpenters.
Helpers
Helpers are usually considered as labourers. Most helpers will be found in the building trades such as carpenter's helper, mason's helper, roofer's helper, etc. These jobs are not to be confused with formal apprenticeships and are not classified as tradesmen/women but are classified to unit group 7611 Construction trades helpers and labourers.
Labourers
Labourers are classified in separate unit groups in the following major groups:
- 76 - Trades helpers, construction labourers and related occupations
- 86 - Harvesting, landscaping and natural resources labourers
- 96 - Labourers in processing, manufacturing and utilities
Sample questions for obtaining additional occupational information
The following questions indicate the type of information and the format that could be used to obtain the facts necessary to classify an occupation.
a) For whom did you work?
- Name of firm, government agency, etc.
- Department, section or plant.
b) What kind of business, industry or service was this?
Give full description; for example, paper box manufacturing, road construction, retail shoe store, secondary school, dairy farm.
c) What was your work or occupation?
Give full description; for example, police officer, trapper, primary school teacher, community health nurse, truck driver, artisan, hairdresser.
d) In this work, what were your main activities?
For example, law enforcement, skinning animals, teaching Grade 2, treating patients, driving a truck, carving soapstone, cutting hair.
e) In this job or business, were you mainly:
- Working for wages, salary, tips or commission?
- Working without pay for your spouse or another relative in a family farm or business?
- Self-employed without paid help (alone or in a partnership)?
- Self-employed with paid help (alone or in a partnership)?
More information on the NOC 2016 Version 1.3
For information on the National Occupational Classification (NOC) and its use for programs and services such as, immigrating to Canada, labour market information, job searches and working in Canada, please contact Employment and Social Development Canada (ESDC).

 Collection and questionnaires
 Data analysis
 Editing and imputation
 History and context
 Inference and foundations
 Quality assurance
 Response and nonresponse
 Statistical techniques


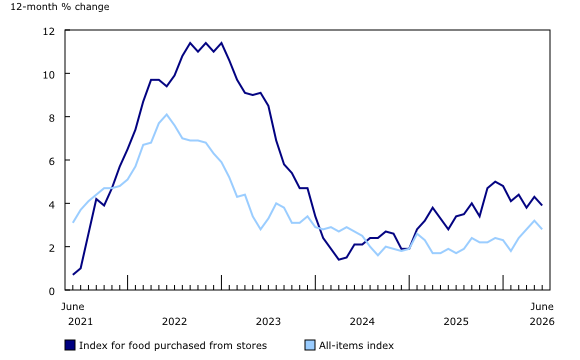


 Diet and nutrition
 Food manufacturing
 Food prices
 Food production and availability


 Charitable donations
 High income
 Household and family assets, debts, and wealth
 Household spending and savings
 Household, family and personal income
 Low income and inequality
 Pensions and retirement income programs
 Personal and household taxation