Survey of Marine Vessel Operators – 2025

Reporting period information

1. Please report the start and end dates of this business's most recent 12-month fiscal period.

Note: For this survey, the end date should fall between April 1, 2025, and March 31, 2026.

The reported fiscal period end date will be used as the reference point for the remainder of the survey.

  • Start date
    Example: YYYY-MM-DD
  • End date
    Example: YYYY-MM-DD

Business information

2. What is the form of ownership of this business?

  • Sole proprietorship
  • Incorporated company
    Include non-profit organizations, partnerships and limited partnerships in incorporated companies.
  • Crown corporation
    Include port authorities and pilotage authorities.
  • Government
    Include federal, provincial, municipal and First Nations government-operated ferries.
  • Other
    e.g., businesses operating as subsidiaries
    • Specify other form of ownership:

Flow condition: If "Crown corporation" or "Government" are selected in Q2, survey will conclude. Otherwise, go to Q3.

3. How many vessels did this business operate in total during its last fiscal year ending in 2025/2026?

Report the total number of vessels operated that were owned, leased or chartered and not the number of times a vessel was operated. 

Include barges, cargo ships, tankers, ferries, research vessels, tugboats, escort vessels, icebreakers, offshore vessels, dredgers, buoy tenders, derricks or cranes, salvage vessels, diving vessels, dump vessels, floating dry docks, survey ships, or patrol boats that were operated by this business regardless of gross tonnage (GT).

Exclude vessels that were owned and not operated, as well as private pleasure craft and fishing vessels. 

Enter "0" if this business did not operate any vessels.

  • Number of vessels operated by this business:

Flow condition: If Q3 is greater than 0 or blank, go to Q4, otherwise go to Q5.

4. How many of the vessels operated were 15 gross tonnage and above?

Report the total number of vessels operated that were owned, leased or chartered and were 15 GT and above.

Include barges, cargo ships, tankers, ferries, research vessels, tugboats, escort vessels, icebreakers, offshore vessels, dredgers, buoy tenders, derricks or cranes, salvage vessels, diving vessels, dump vessels, floating dry docks, survey ships, or patrol boats operated by this business that were 15 GT and above.

Exclude vessels that were owned and not operated, as well as private pleasure craft and fishing vessels.

Enter "0" if this business did not operate any vessels 15 GT and above.

  • Number of vessels operated 15 GT and above

5. How many vessels did this business own in total during its last fiscal year ending in 2025/2026?

Include barges, cargo ships, tankers, ferries, research vessels, tugboats, escort vessels, icebreakers, offshore vessels, dredgers, buoy tenders, derricks or cranes, salvage vessels, diving vessels, dump vessels, floating dry docks, survey ships, or patrol boats owned by this business.

Exclude private pleasure craft and fishing vessels. 

Enter "0" if this business did not own any vessels.

  • Number of vessels owned by this business:

Flow condition: If Q5 is greater than 0 or blank, go to Q6. Otherwise go to Q7.

6. How many of the vessels owned were 15 gross tonnage and above?

Include barges, cargo ships, tankers, ferries, research vessels, tugboats, escort vessels, icebreakers, offshore vessels, dredgers, buoy tenders, derricks or cranes, salvage vessels, diving vessels, dump vessels, floating dry docks, survey ships, or patrol boats owned by this business that were 15 GT and above.

Exclude private pleasure craft and fishing vessels.

Enter "0" if this business did not own any vessels 15 GT and above.

  • Number of vessels owned 15 GT and above:

Flow condition: If Q3 = 0 or Q4 =0, survey will conclude. Otherwise go to Q7.

Revenue from vessel operations

7.  What was the total revenue from vessel operations for the fiscal year ending in 2025/2026?

Include revenue from the transportation of commodities, cargo, freight, passengers or vehicles; revenue from the towing of commodities or log booms; chartering or leasing; cost compensation from parent companies; revenue from on-vessel sales and concessions; and water transport subsidies.

Please report in Canadian dollars.

If the exact value is not available, please provide your best estimate.

  • Total revenue from vessel operations in CAN$:

Flow condition: If Q7 is equal to or greater than $6,000,000 or blank, go to Q8. Otherwise go to Q10. 

Business information

8. For the fiscal year ending in 2025/2026, of the vessels that were 15 gross tonnage and above, which of the following types of vessels were operated? 

If this business operated vessels that transport both passenger vehicles and commercial vehicles together, report them as passenger and all vehicle type ferries.

Exclude vessels that were owned and not operated, as well as private pleasure craft and fishing vessels.

Select all that apply.

  • Barges
    Include deck, hopper or tank barges.
  • Cargo ships
    Include solid cargo vessels; container ships; dry bulk, liquid bulk and breakbulk carriers; and roll-on-roll-off cargo vessels.
  • Tankers
    Include oil, chemical, liquefied gas and product (gas or diesel) tankers.
  • Passenger vessels
    Include day or overnight cruises and sightseeing vessels.
    Exclude ferries.
  • Passenger and passenger vehicle ferries
    Exclude commercial vehicles.
  • Passenger and all vehicle type ferries
    Include commercial and passenger vehicle roll-on-roll-off ferries.
  • Passenger-only ferries
    Include water taxis.
    e.g., cyclists, pedestrians
  • Research vessels
    Include seismic and fishing vessels.
  • Tugboats or escort vessels
    Include vessels that assist in moving larger ships and barges at ports or in narrow waterways.
  • Icebreakers
    Include those used to escort research vessels in icy waters.
  • Offshore vessels
    Include supply vessels, workboats, cable-laying and floating platforms, and vessels used for production storage and offloading.
  • Dredgers
    Include vessels used for excavation and maintenance of waterways, construction support or resource extraction.
  • Buoy tenders
  • Derricks or cranes
  • Salvage vessels
  • Diving vessels
  • Dump vessels
  • Floating dry docks
  • Survey ships
  • Patrol boats
  • Other types of vessels operated
    • Specify the other types of vessels:

Display condition: Only vessel types that were selected in Q8 are displayed in Q9. If no vessel types were selected in Q8, display all vessel types.

9. For the fiscal year ending in 2025/2026, how many of each of the following types of vessels that were 15 gross tonnage and above did this business operate?

If this business operated vessels that transport both passenger vehicles and commercial vehicles together, only report them once, as passenger and all vehicle type ferries.

Exclude vessels that were owned and not operated, as well as private pleasure craft and fishing vessels. 

Number of vessels 15 GT and above

  • Barges:
    Include deck, hopper or tank barges.
  • Cargo ships:
    Include solid cargo vessels; container ships; dry bulk, liquid bulk and breakbulk carriers; and roll-on-roll-off cargo vessels.
  • Tankers:
    Include oil, chemical, liquefied gas and product (gas or diesel) tankers.
  • Passenger vessels:
    Include day or overnight cruises and sightseeing vessels.
    Exclude ferries.
  • Passenger and passenger vehicle ferries:
    Exclude commercial vehicles.
  • Passenger and all vehicle type ferries:
    Include commercial and passenger vehicle roll-on-roll-off ferries.
  • Passenger-only ferries:
    Include water taxis.
    e.g., cyclists, pedestrians
  • Research vessels:
    Include seismic and fishing vessels.
  • Tugboats or escort vessels:
    Include vessels that assist in moving larger ships and barges at ports or in narrow waterways.
  • Icebreakers:
    Include those used to escort research vessels in icy waters.
  • Offshore vessels:
    Include supply vessels, workboats, cable-laying and floating platforms, and vessels used for production storage and offloading.
  • Dredgers:
    Include vessels used for excavation and maintenance of waterways, construction support or resource extraction.
  • Buoy tenders:
  • Derricks or cranes:
  • Salvage vessels :
  • Diving vessels:
  • Dump vessels:
  • Floating dry docks:
  • Survey ships:  
  • Patrol boats:
  • Other types of vessels operated:
  • Total:

10. For the fiscal year ending in 2025/2026, has this business chartered in or leased any vessels for its operations?

Chartered in or leased: Process by which an individual or a business entity, called the lessee, rents a vessel from a shipowner (the lessor) for a specific voyage or period of time (also known as chartering in). This can be done by bareboat charter.

Exclude private pleasure craft and fishing vessels.

  • Yes
    Please indicate the number of vessels that were chartered in or leased by this business.
    Number of vessels chartered in or leased:
  • No
  • Don't know

Flow condition: If Q7 is equal to or greater than $6,000,000 or blank, go to Q11, otherwise go to Q13. 

11. For the fiscal year ending in 2025/2026, was this business directly or indirectly owned or controlled by any other businesses?

Control: Having the authority or enough voting shares to make corporate decisions for the business.

  • Yes
    • Where were those businesses located?
      Select all that apply.
      • Inside Canada
      • Outside Canada
        • What region is the majority owner or controller of this business located in? 
          Majority owner or controller: The business that has the greatest share of ownership or control of this business.
          • United States
          • Central America, the Caribbean, Mexico and South America
          • United Kingdom
          • Europe other than United Kingdom
            Include Eastern and Western Europe.
          • Australia
          • New Zealand
          • Asia and Oceania
            Exclude Australia and New Zealand.
          • Middle East and Africa
  • No
  • Don't know

12. For the fiscal year ending in 2025/2026, did this business own or control any other businesses engaged in foreign marine activities?

Control: Having the authority or enough voting shares to make corporate decisions for the business.

  • Yes
    • Where were those businesses located?
      Select all that apply.
      • Inside Canada
      • Outside Canada
  • No 
  • Don't know

Type of operation

13. For the fiscal year ending in 2025/2026, was this business engaged in the transportation of commodities, cargo or freight, passengers or vehicles?

Commodities: Basic raw materials or bulk goods, usually transported in large quantities. These include a wide range of products, such as crude oil, natural gas, coal, iron ore, grains, chemicals and other bulk goods. These goods are usually transported in large quantities using specialized vessels.

Cargo or freight: Goods or freight, used as a general term, often regarding commercial inventory, can include any type of product or good, such as packaged goods, manufactured products, machinery and containers.

Passenger: A person carried on a vessel by the owner or operator in exchange for payment. 

Select all that apply.

  • Commodities
  • Cargo or freight
  • Passengers or vehicles
    Include ferries, day or overnight cruises and sightseeing vessels.
    OR
  • This business was not engaged in the transportation of commodities, cargo or freight, passengers or vehicles.
    e.g., drayage, research, construction, equipment
    • Please indicate the type of activities other than the transportation of commodities, cargo or freight, passengers or vehicles that this business was engaged in.
      Select all that apply.
      • Construction or industrial support
        Include vessels used as work platforms for construction, installation or industrial activities.
        Exclude the transport of goods between locations.
      • Offshore resource activities
        Include support services for offshore energy or resource development.
      • Dredging or seabed work
        Include dredging, excavation or seabed preparation.
      • Bunkering or lightering
        Include ship-to-ship fuel or cargo transfer.
        Exclude the transportation of fuel or cargo between ports.
      • Aquaculture or fisheries support
        Include servicing aquaculture or fishing operations. 
        Exclude the transport of fish or seafood to market.
      • Accommodation
        Include stationary or semi-stationary accommodation or support vessels (e.g., floatels).
        Exclude the transport of passengers or workers.
      • Towing
        Include towing or escorting vessels.
      • Icebreaking
        Include icebreaking or ice management services.
        Exclude ice navigation advice only.
      • Research activities
        Include scientific, technical or environmental research conducted using vessels or marine facilities (e.g., data collection, surveys, monitoring).
        Exclude commercial transportation or industrial operations.
      • Other activities
        • Specify other activities:

Sources of power

14. For the fiscal year ending in 2025/2026, which of the following sources of power were purchased for propulsion in vessel operations? 

Only report sources of power in vessel operations.

Include sources of power and propulsion for main engines.

Select all that apply.

  • Fuel oil
    Include bunker C oil, diesel oil and gas oil.
    Please indicate the type of fuel oil that was purchased.
    Select all that apply.
    • Heavy fuel oil
      Please indicate the type of heavy fuel oil that was purchased.
      Select all that apply.
      • Bunker C oil
      • IFO380
      • VLSFO
    • Diesel oil
    • Gas oil
      OR
    • Don't know
  • Gasoline
  • Liquefied natural gas (LNG)
  • Biodiesel or biofuel
  • Hydrogen
  • Ammonia
  • Methanol
  • Electric
    Include batteries.
  • Green fuel sources
    Please indicate the type of green fuel that was purchased.
    Select all that apply.
    • E-LNG
    • Bio-LNG
    • Green ammonia
    • Green methanol
    • Green hydrogen
  • Other sources of power
    • Specify the other sources of power for propulsion
      OR
  • Don't know

Flow condition: If Q14= "Don't know", go to Q16. If Q7 is equal to or greater than $6,000,000 or blank, go to Q15. Otherwise, go to Q16.

Display condition: Only sources of power that were selected in Q14 are displayed in Q15. If no sources of power were selected in Q14, display "Fuel oil", "Gasoline", "Liquefied natural gas (LNG)", "Biodiesel or biofuel", "Hydrogen", "Ammonia", "Methanol", "Electric", "Green fuel sources", and "Other sources of power".

15. For the fiscal year ending in 2025/2026, what percentage of this business's total vessel propulsion fuel spending was attributable to each propulsion fuel or power source?

If exact values are not available, please provide your best estimate.

Percentages should be rounded to whole numbers, and the total should equal to 100%.

Percentage of propulsion fuel purchased

  • Fuel oil:
  • Heavy fuel oil:
  • Bunker C oil:
  • IFO380:
  • VLSFO:
  • Diesel oil:
  • Gas oil:
  • Gasoline:
  • Liquefied natural gas (LNG):
  • Biodiesel or biofuel:
  • Hydrogen:
  • Ammonia:
  • Methanol:
  • Electric:
  • Green fuel source:
  • E-LNG:
  • Bio-LNG :
  • Green ammonia:
  • Green methanol:
  • Green hydrogen:
  • Other source of power:
  • Total:

 16. Over the next five years, does this business plan to modify the source of power or fuel type used in its vessels? 

e.g., switching from diesel to biodiesel, installing shore power connection equipment on the vessel, changing technology to take advantage of environmentally friendly fuels or to improve efficiency

  • Yes
    What source of power or fuel type does this business plan to use?
    Source of power or fuel type:
  • No
  • Don't know

Flow condition: If Q7 is equal to or greater than $6,000,000 or blank, go to Q17. Otherwise, go to Q19. 

Shore power stations

17. For the fiscal year ending in 2025/2026, did this business's vessels use shore power stations in Canada? 

Shore power station: The source of the power used by the vessel while docked at port, allowing access to landside electrical power. Shore power alleviates the unnecessary use of fuel, which would otherwise be used to power vessels while in port. 

Exclude vessels that use the power of terminals for propulsion.

  • Yes
    • Please indicate the quantity of electricity purchased and expenditures at shore power stations in Canada.
      • Quantity purchased in kWh:
      • Electricity expenditures in CAN$:
        If the exact value is not available, please provide your best estimate.
  • No
  • Don't know

Flow condition: If Q7 is equal to or greater than $6,000,000 or blank, go to Q18. Otherwise, go to Q19. 

Revenue from vessel operations

18. Based on this business's reported revenue from vessel operations, please provide a breakdown of this revenue for the fiscal year ending in 2025/2026. 

Include revenue from the transportation of commodities, cargo, freight, passengers or vehicles; revenue from the towing of commodities or log booms; chartering or leasing; cost compensation from parent companies; revenue from on-vessel sales and concessions; and water transport subsidies.

Please report in Canadian dollars.

If exact values are not available, please provide your best estimate.

If no revenue was earned for an activity, please report "0" where applicable.

Revenue CAN$

Vessel operating revenue

  • Transport and towing of commodities, cargo or freight:
  • Transport of passengers:
    Include sightseeing vessels and ferries.
    Exclude revenue from concessions and food and beverage sales when not included in the cost of the trip fare.
  • Charter or lease of owned Canadian-registered vessels to other operators:
    Include chartered or leased non-duty paid Canadian-registered vessels and chartered or leased foreign-registered vessels under a coasting trade licence.
  • Water transport subsidies:

Other water transportation revenue

  • Towing, docking or turning of self-propelled vessels:
  • Other water transportation revenue:

Revenues from other marine activities of a commercial nature, non-transportation

  • Construction or industrial support:
  • Offshore resource exploration and development activities:
  • Dredging and seabed work:
  • Bunkering and lightering:
  • Aquaculture and fisheries support:
  • Accommodation and support vessels:
  • Icebreaking:
  • Other commercial marine activities that do not have a transportation component:

Revenue from activities incidental to water transportation

  • Terminal and cargo handling services:
    Include terminal operations, stevedoring, yarding and storage related to cargo movement.
  • Logistics and agency services:
    Include freight forwarding, customs brokerage, and vessel and cargo agency fees.
  • Vessel and cargo delay charges:
    Include demurrage charges and detention charges.
  • Marine support and emergency services:
    Include marine salvaging, emergency response and specialized marine support services.

Other sources of revenue

  • Other sources of revenue incidental to water transportation activities:
    Include vessel dispatching and voyage planning services, transportation equipment rental (excluding vessels), and standby and availability fees.
  • Other sources of revenue from transportation activities:
    Include railway transportation, trucking, etc.
  • Other sources of revenue not related to transportation:
    Include concrete aggregates, production of construction materials, etc.
  • Other sources of revenue related to on-vessel sales and concessions:
    Include rooms, food and beverages, souvenirs or other non-food items.

Total:

Flow condition: If Q7 is less than $6,000,000, go to Q19. Otherwise, go to Q20. 

Total revenue 

19. Based on this business's reported revenue from vessel operations, please provide a breakdown of this revenue for the fiscal year ending in 2025/2026.

Include revenue from the transportation of commodities, cargo, freight, passengers or vehicles; revenue from the towing of commodities or log booms; chartering or leasing; cost compensation from parent companies; revenue from on-vessel sales and concessions; and water transport subsidies.

Please report in Canadian dollars.

If exact values are not available, please provide your best estimate.

If no revenue was earned for an activity, please report "0" where applicable.

  • Vessel operating revenue:
    Include the transport and towing of commodities, cargo or freight, the transport of passengers, and the charter or lease of owned Canadian-registered vessels to other operators.
  • Other water transportation revenue:
    Include the towing, docking or turning of self-propelled vessels, and other water transportation revenue.
  • Revenues from other marine activities of a commercial nature:
    Exclude transportation. 
    Include construction or industrial support, offshore resource exploration and development activities, dredging and seabed work, bunkering and lightering, aquaculture and fisheries support, accommodation and support vessels, icebreaking, and other commercial marine activities that do not have a transportation component.
  • Revenue from activities incidental to water transportation:
    Include terminal and cargo handling services, logistics and agency services, vessel and cargo delay charges, and marine support and emergency services.
  • Other sources of revenue:
    Include other sources of revenue incidental to water transportation activities, other sources of revenue from transportation activities, other sources of revenue not related to transportation, and on-vessel sales and concessions.
  • Total revenue:

Vessel operating expenses

20. What were this business's total vessel operating expenses for the fiscal year ending in 2025/2026?

Include vessel operating costs, vessel maintenance and repairs, insurance and other fees, terminal and office expenses, non-transportation expenses, other transportation expenses and depreciation. 

Please report in Canadian dollars. 

If exact values are not available, please provide your best estimate.

Enter "0" if this business did not incur any expenses.

  • Total vessel operating expenses in CAN$:

Flow condition: If Q7 is equal to or greater than $6,000,000 or blank, go to Q21. Otherwise, go to Q22. 

21. Based on this business's reported expenses from vessel operations, please provide the breakdown of these expenses for the fiscal year ending in 2025/2026.

Please report in Canadian dollars.

If exact values are not available, please provide your best estimate.

If no expenses were incurred, please report "0" where applicable.

Vessel operating costs

  • Vessel crew remuneration:
    Include gross payroll and mandatory and non-mandatory contributions. 
    Exclude contractors.
  • Sources of power for propulsion:
    Include non-refundable taxes.
    e.g., fuel oil, gasoline, liquefied natural gas (LNG)
  • Vessel maintenance and repairs:
    Include allocation for the ship's survey, annual overhaul, lay-up or fit out; lubricating oil (inclusive of non-refundable taxes); and remuneration for maintenance crew who are not on the vessel.
  • Bareboat charter or lease hired in Canada:
  • Bareboat charter or lease hired abroad:
  • Food and provisions:
  • Communication expenses:
    e.g., radar, radio, satellite, computer, cellular phone

Insurance and other fees

  • Insurance:
    Include hull and machinery insurance, third-party liability insurance, and cargo insurance. 
    e.g., package freight policy premiums
  • Berthage and port dues:
    e.g., wharfage, anchorage, buoyage and dockage
  • Pilotage:
  • Canal and seaway tolls:
  • Coast guard fees:
  • Waste disposal expenses:
  • Purchased towage or escort services:

Terminal and office expenses

  • Office and terminal employee remuneration:
    Include gross payroll and mandatory and non-mandatory contributions.
  • Demurrage:
    Include fees charged when a vessel, container or cargo remains at a port, terminal or berth beyond the allowed free time for loading or unloading, because of delays while under the control of the terminal or port.
    e.g., a vessel is billed for demurrage when the cargo cannot be unloaded within the agreed-upon time because of terminal congestion

Non-transportation expenses

  • Corporate taxes paid at the federal, provincial and municipal levels:

Other expenses

  • Other transportation expenses:
    Include railway transportation, trucking, etc.
  • Other purchased transport:
    e.g., transportation services purchased from a third party, transportation of crew or other cargos in support of business operations
  • Depreciation:
    Include vessels and floating equipment.

Total expenditures:

Flow condition: If Q7 is less than $6,000,000, go to Q22. Otherwise, go to Q23. 

22. Based on this business's reported expenses from vessel operations, please provide the breakdown of these expenses for the fiscal year ending in 2025/2026.

Please report in Canadian dollars.

If exact values are not available, please provide your best estimate.

If no expenses were incurred, please report "0" where applicable.

  • Vessel operating costs:
    Include vessel crew remuneration, sources of power for propulsion, lubricating oil, vessel maintenance and repairs, boat charter or lease hired in Canada or abroad, food and provisions, and communication expenses. 
    e.g., radar, radio, satellite, computer, cellular phone
  • Insurance and other fees:
    Include insurance, berthage and port dues, pilotage, canal and seaway tolls, coast guard fees, inspection fees, waste disposal expenses, and purchased towage or escort services.
  • Terminal and office expenses:
    Include office and terminal employee remuneration and demurrage.
    e.g., a vessel is billed for demurrage when the cargo cannot be unloaded within the agreed-upon time because of terminal congestion
  • Non-transportation expenses:
    Include corporate taxes paid at the federal, provincial and municipal levels.
  • Other expenses:
    Include other transportation expenses, other purchased transport and depreciation.
    e.g., transportation services purchased from a third party, transportation of crew or other cargos in support of business operations
  • Total expenditures:

Employment

23. As of this business's peak season for the fiscal year ending in 2025/2026, how many people worked for this business's vessel operations, by type of occupation and by number of Canadian citizens or permanent residents and non-permanent residents?

Include all employees who received a T4 working for this business's vessel operations, whether full-time, part-time, seasonal or temporary. 
Exclude contract workers.

Canadian citizen: A person described as a citizen under the Citizenship Act. This means a person who is Canadian by birth (either born in Canada or born outside Canada to a Canadian citizen who was either born in Canada or granted citizenship) or has applied for a grant of citizenship and has received Canadian citizenship. 

Permanent resident: A person who has legally immigrated to Canada but is not yet a Canadian citizen.

Non-permanent resident: A person from another country with a usual place of residence in Canada and who has a work or study permit or who has claimed refugee status (asylum claimant), including individuals employed under the Temporary Foreign Worker (TFW) Program or other temporary work permit programs.

Enter "0" if this business did not have employees in one of the occupation types.

  • Number of Canadian citizens and permanent residents  
    • Deck officers:
      e.g., captains, chief officers, second or third officers
    • Engineering officers:
      e.g., chief engineers, second or third engineers
    • Deck crew:
      e.g., seafarers
    • Engine crew:
      e.g., oilers, motor persons, wipers, electricians
    • Stewards and catering:
      e.g., cooks, stewards
    • Dock and warehouse:
      e.g., longshorepersons, cargo handlers, forklift operators
    • Office and administration:
      e.g., shipping clerks, logistics coordinators, port agents
    • Other:
      e.g., pilots, tug operators, compliance or environmental officers, customer service agents, clerks, pursers, attendants, industrial electricians, trainees
    • Total number of employees:
  • Number of non-permanent residents 
    • Deck officers:
      e.g., captains, chief officers, second or third officers
    • Engineering officers:
      e.g., chief engineers, second or third engineers
    • Deck crew:
      e.g., seafarers
    • Engine crew:
      e.g., oilers, motor persons, wipers, electricians
    • Stewards and catering:
      e.g., cooks, stewards
    • Dock and warehouse:
      e.g., longshorepersons, cargo handlers, forklift operators
    • Office and administration:
      e.g., shipping clerks, logistics coordinators, port agents
    • Other:
      e.g., pilots, tug operators, compliance or environmental officers, customer service agents, clerks, pursers, attendants, industrial electricians, trainees
    • Total number of employees:
  • Total number of employees in each occupation
    • Deck officers:
      e.g., captains, chief officers, second or third officers
    • Engineering officers:
      e.g., chief engineers, second or third engineers
    • Deck crew:
      e.g., seafarers
    • Engine crew:
      e.g., oilers, motor persons, wipers, electricians
    • Stewards and catering:
      e.g., cooks, stewards
    • Dock and warehouse:
      e.g., longshorepersons, cargo handlers, forklift operators
    • Office and administration:
      e.g., shipping clerks, logistics coordinators, port agents
    • Other:
      e.g., pilots, tug operators, compliance or environmental officers, customer service agents, clerks, pursers, attendants, industrial electricians, trainees
    • Total number of employees:

Flow condition: If "number of Canadian citizens and permanent residence" or "number of non-permanent residents" are greater than 0, go to Q24. Otherwise, go to Q25. 

24. For the employees reported in the "other" category in question 23, please specify the other type of occupation.

  • Other occupations of the Canadian citizens and permanent residents:
  • Other occupations of the non-permanent residents:

Flow condition: If Q7 is equal to or greater than $6,000,000 or blank, go to Q25. Otherwise, go to Q26. 

25. As of this business's peak season for the fiscal year ending in 2025/2026, was this business experiencing labour shortages or job vacancies?

Labour shortages: Difficulties finding qualified workers.

Job vacancies: Unfilled positions.

Select all that apply.

  • Labour shortages
    • Please select the occupations in which this business was experiencing labour shortages.
      Labour shortages: Difficulties finding qualified workers.
      Select all that apply.
      • Deck officers
        e.g., captains, chief officers, second or third officers
      • Engineering officers
        e.g., chief engineers, second or third engineers
      • Deck crew
        e.g., seafarers
      • Engine crew
        e.g., oilers, motor persons, wipers, electricians
      • Stewards or catering
        e.g., cooks, stewards
      • Dock and warehouse
        e.g., longshorepersons, cargo handlers, forklift operators
      • Office and administration
        e.g., shipping clerks, logistics coordinators, port agents
      • Other occupations
        e.g., pilots, tug operators, compliance or environmental officers, customer service agents, clerks, pursers, attendants, industrial electricians, trainees

        • Specify the other occupations:

        OR

      • None of the above
  • Job vacancies

    • Please select the occupations in which this business was experiencing job vacancies.
      Job vacancies: Unfilled positions. 
      Select all that apply.
      • Deck officers
        e.g., captains, chief officers, second or third officers
      • Engineering officers
        e.g., chief engineers, second or third engineers
      • Deck crew
        e.g., seafarers
      • Engine crew
        e.g., oilers, motor persons, wipers, electricians
      • Stewards or catering
        e.g., cooks, stewards
      • Dock and warehouse
        e.g., longshorepersons, cargo handlers, forklift operators
      • Office and administration
        e.g., shipping clerks, logistics coordinators, port agents
      • Other occupations
        e.g., pilots, tug operators, compliance or environmental officers, customer service agents, clerks, pursers, attendants, industrial electricians, trainees

        • Specify the other occupations:

        OR

      • None of the above

    OR

  • This business did not experience labour shortages or job vacancies

Flow condition: If Q13 is "commodities" or "cargo or freight", go to Q26. Otherwise, go to Q28.

Commodities, cargo and freight transported

26. For the fiscal year ending in 2025/2026, please select all types of commodities, cargo or freight that this business transported. 

Commodities: Basic raw materials or bulk goods, usually transported in large quantities. These include a wide range of products, such as crude oil, natural gas, coal, iron ore, grains, chemicals and other bulk goods. These goods are usually transported in large quantities using specialized vessels.

Cargo or freight: Goods or freight, used as a general term, often regarding commercial inventory, can include any type of product or good, such as packaged goods, manufactured products, machinery and containers.

Select all that apply.

  • Containerized freight
  • Dry bulk cargo
  • Liquid bulk cargo
  • Project or breakbulk cargo
  • General cargo
  • Other types of commodities, cargo or freight
    • Specify the other types of commodities, cargo or freight transported:

Display condition: Only types of commodities, cargo or freight selected in Q26 are displayed in Q27. If no types of commodities, cargo or freight was selected, display all categories in Q27.

27. For the fiscal year ending in 2025/2026, please report how much of each of the following types of commodities, cargo or freight was transported by this business. 

If exact numbers are not available, please provide your best estimate.

  • Please report the total twenty-foot equivalent units (TEUs) of containerized freight transported by this business.
    • TEUs of containerized freight transported:
      OR
    • Don't know
  • Please report the total tonnage of containerized freight transported by this business.
    • Tonnage of containerized freight transported:
      OR
    • Don't know
  • Please report the total tonnage of dry bulk cargo transported by this business.
    • Tonnage of dry bulk cargo transported:
      OR
    • Don't know
  • Please report the total tonnage of liquid bulk cargo transported by this business.
    • Tonnage of liquid bulk cargo transported:
      OR
    • Don't know
  • Please report the total tonnage of project or breakbulk cargo transported by this business.
    • Tonnage of project or breakbulk cargo transported:
      OR
    • Don't know
  • Please report the total tonnage of general cargo transported by this business.
    • Tonnage of general cargo transported:
      OR
    • Don't know
  • Please report the total tonnage of other types of commodities, cargo or freight transported by this business.
    • Tonnage of commodities, cargo or freight transported:
      OR
    • Don't know

Flow condition: If "Passenger or vehicles" is selected in Q13, go to Q28. Otherwise, go to Q30. 

Ferry and passenger services 

28. For the fiscal year ending in 2025/2026, please indicate the types of services related to passengers and vehicles provided by this business.

Select all that apply.

  • Ferry services
    Include shuttle services.
    • Please indicate the types of ferry services that were offered by this business.
      Select all that apply.
      • Passenger and passenger vehicle ferries
        Exclude commercial vehicles.
      • Passenger and all vehicle type ferries
        Include commercial and passenger vehicle roll-on-roll-off ferries.
      • Passenger-only ferries
        Include water taxis.
        e.g., cyclists, pedestrians
  • Passenger services
    Include day or overnight cruises and sightseeing vessels.
    Exclude ferry services.
  • Other types of services

    • Specify the other types of passenger and vehicle transportation services provided:

    OR

  • None of the above

Flow condition: If Q7 is equal to or greater than $6,000,000 or blank and "Passenger or vehicles" is selected in Q13 and "none of the above" was NOT selected in Q28, go to Q29. Otherwise go to Q30.

Display condition: Only services related to passengers and vehicles selected in Q28 are displayed in Q29. If no type of services related to passengers and vehicles was selected in Q28, display "Ferry services", "Passenger services", and "Other types of services" in Q29.

29. For the fiscal year ending in 2025/2026, please report the number of tickets sold and the number of trips related to ferry and passenger services provided by this business.

Ticket: A ticket is a legal document or electronic record that confirms payment and entitles a person or entity to transport between specified locations.

Trip: A trip starts with the embarkation of ticket holders and ends when those ticket holders disembark the vessel. In the case of passenger services, in-transit stops are not considered disembarkation. Therefore, the final disembarkation point is considered the end of the trip. 

If exact numbers are not available, please provide your best estimate.

  • Number of tickets sold
    • Ferry services:
      Include shuttle services.
    • Passenger and passenger vehicle ferries:
      Exclude commercial vehicles.
    • Passenger and all vehicle type ferries:
      Include commercial and passenger vehicle roll-on-roll-off ferries.
    • Passenger-only ferries:
      Include water taxis.
      e.g., cyclists, pedestrians
    • Passenger services:
      Include day or overnight cruises and sightseeing vessels.
      Exclude ferry services.
    • Other types of services:
    • Total:
  • Number of trips
    • Ferry services:
      Include shuttle services.
    • Passenger and passenger vehicle ferries:
      Exclude commercial vehicles.
    • Passenger and all vehicle type ferries:
      Include commercial and passenger vehicle roll-on-roll-off ferries.
    • Passenger-only ferries:
      e.g., cyclists, pedestrians
    • Passenger services:
      Include day or overnight cruises and sightseeing vessels.
      Exclude ferry services.
    • Other types of services:
    • Total: 

Obstacles

30. Please indicate to what extent this business experienced each of the following obstacles during its fiscal year ending in 2025/2026.

  • Drayage scheduling uncertainty
    Drayage: The short-distance, truck-based transport of shipping containers and cargo, usually connecting ports, rail yards or warehouses within the same urban area.
    • Not an obstacle
    • Minor obstacle
    • Moderate obstacle
    • Major obstacle
    • Don't know
  • Seafarer shortages
    • Not an obstacle
    • Minor obstacle
    • Moderate obstacle
    • Major obstacle
    • Don't know
  • Labour challenges at ports or terminals
    • Not an obstacle
    • Minor obstacle
    • Moderate obstacle
    • Major obstacle
    • Don't know
  • Delays because of regulatory requirements
    e.g., inspection, permits
    • Not an obstacle
    • Minor obstacle
    • Moderate obstacle
    • Major obstacle
    • Don't know
  • Delays at ports because of other factors
    • Not an obstacle
    • Minor obstacle
    • Moderate obstacle
    • Major obstacle
    • Don't know
  • Supply chain interruptions
    • Not an obstacle
    • Minor obstacle
    • Moderate obstacle
    • Major obstacle
    • Don't know
  • Economic uncertainty and inflation
    • Not an obstacle
    • Minor obstacle
    • Moderate obstacle
    • Major obstacle
    • Don't know
  • Irregular water level
    • Not an obstacle
    • Minor obstacle
    • Moderate obstacle
    • Major obstacle
    • Don't know
  • Weather-related cancellations
    • Not an obstacle
    • Minor obstacle
    • Moderate obstacle
    • Major obstacle
    • Don't know
  • Extreme weather events
    • Not an obstacle
    • Minor obstacle
    • Moderate obstacle
    • Major obstacle
    • Don't know
  • Other
    • Not an obstacle
    • Minor obstacle
    • Moderate obstacle
    • Major obstacle
    • Don't know

Government data presentation on a System of National Accounts basis compared to the Government Finance Statistics program

The annual Government Finance Statistics (GFS) program is a principal data source for the estimation of the government sector on a System of National Accounts (SNA) basis. However, there are key differences between these two programs in how they compile their government sector estimates. This note highlights some of the notable differences between SNA and GFS methodologies, concepts, and coverage.

Within the SNA, there are two primary programs that release data on the government sector: the Income and Expenditure Accounts (IEA) and the Financial and Wealth Accounts (FWA). Estimates within the IEA include revenues and expenditures within the GDP and current and capital accounts. The FWA starts with the capital account from IEA and tracks the financial flows for the government sector through the financial account and other change in assets account, ending with positions in the balance sheet for assets and liabilities.

The sequence of accounts within the SNA are fully consistent (within and across sectors) and balanced, and include transactions with residents and non-residents (outside Canada). As such, some of the differences noted below are to maintain the consistency within the sequence. The GFS is also a consistent set of accounts but with a narrower focus on the accounting consistency within government sectors.

Key differences between the SNA and the GFS

Fiscal year versus calendar year

Generally, the GFS data are on a fiscal year (i.e., March 31st year-end), whereas the SNA is on a calendar year (i.e., December 31st year-end). As a result, the fiscal year data from the GFS must be 'calendarized' to be incorporated into the SNA. For Federal government, the receipt of quarterly data facilitates integration, while in other instances, only annual fiscal data is available.

Accrual accounting

The GFS is based on fiscal year accrual accounting. When this data is integrated into the quarterly accounts, the accrual adjustments must be distributed to better reflect quarterly economic activity on a calendar basis. This is primarily an issue for the provincial/territorial administration subsector.

Year-end adjustments

In the GFS program, reporting data from government entities can include fiscal year-end adjustments. These year-end adjustments can perturb the estimates of economic growth in the SNA accounts, so these adjustments must first be spread through the four quarters of the fiscal year to align to fiscal year annual totals and then the calendarization process is applied as mentioned above.

Intergovernmental transfers

The SNA primarily uses counterparty information for transactions, that is, recording the amounts paid by a government entity as the receipts of that counterparty sector, whether it is government or non-government. This ensures internal bi-directional consistency for these flows. The GFS program articulates distinctly what is reported by the government making the transfer and the government receiving the transfer. For the GFS, when two sides of a transfer do not match between payer and recipient, an adjustment is made to 'Other revenues' and 'Other expenditures' so that the total balances of net lending/borrowing are consistent, but the transfers to and from will not necessarily align.

Estimation of capital investment, consumption of fixed capital, and stock of fixed capital

Conceptual differences and timeliness sometimes preclude the use of GFS source data for the estimate of capital investment within the SNA. In general, for federal government capital investment, the SNA is aligned with the GFS source data. For other government sectors, the capital investment estimate within the IEA is from the Annual Capital and Repair Expenditures Survey and may be adjusted with the GFS source data. This capital investment subsequently flows into the Stock and Consumption of Fixed Capital program (SCFC) and the FWA. The final GFS estimates also incorporate this capital investment data. Similarly, the SCFC provides estimates of the consumption of fixed capital (CFC) and stocks of fixed capital assets that are subsequently incorporated into the IEA, FWA and GFS, where applicable. Altogether, this ensures full consistency within the sequence.

The capital stock and CFC (also known as depreciation) within the SCFC is an economic measure of available capital in use in production processes and the associated economic depreciation of this capital. It is developed using the flow of capital investment from the IEA and is estimated on a replacement cost basis using a geometric depreciation method and specific service lives by asset. As a result, it differs from the asset and deprecation values that would be provided according to public sector and business accounting principles

Compensation of employees for government sector

Within the SNA, the compensation of employees for the general government and government sub-sectors is estimated using a similar methodology to the market sector, that is using administrative data, specifically T4 information from Canada Revenue Agency.  This administrative data is supplemented with additional data from the Survey of Employment, Payroll and Hours, Pension Plans in Canada, and from Employment and Social Development Canada. This ensures full consistency within the SNA. The GFS uses wages as reported in the government source data, which may differ from the SNA given the different sources.

Treatment of corporate income tax

In the IEA, the treatment of corporate incomes taxes aligns to the corporations' accrual perspective. This means that corporate reporting on income taxes paid are used to replace the GFS-based corporate income tax receipts of government, which may reflect more of a cash-basis perspective. This ensures consistency between both payers and recipients. The GFS replaces federal corporate income tax receipts with this corporate data but not the receipts of provincial and territorial governments. In both programs, GFS data is used for Quebec and Alberta to aid in the allocation of total provincial and territorial corporate income tax receipts.

Financial services

In the IEA, there are certain financial services that must be measured implicitly to derive an output. For example, the margin between what deposit-taking institutions earn on their loan assets versus what they pay on their deposit liabilities is considered an output of these entities. To ensure that this output aligns to all uses such as final demand, there are adjustments made to impute these expenditures by sector, including government. The GFS does not explicitly incorporate these expenses.

Indigenous general governments

In the IEA and FWA, Indigenous general governments is a distinct sub-sector of general governments. The GFS does not currently articulate this sector.

Bond liabilities

Within the FWA, data on government bond liabilities are taken from Canada's securities statistics program instead of the GFS as the data is timelier, and this practice maintains consistency within the sequence of the accounts for both issuer and debtor perspectives.

Consolidation

The FWA presents the general government sectors on an unconsolidated basis; this means that the debt securities and loan assets of one level of government corresponding to the liabilities of another government sector are shown gross. The GFS presents information on both a consolidated and unconsolidated basis (i.e., a statement of operations and balance sheet). A specific example of consolidation involves the social security fund sector's holdings of government debt. The GFS may consolidate these holdings and remove both asset and liability at the level of general government sector, whereas these will be shown gross in the FWA. However, the FWA publishes from-whom-to-whom estimates that allow users to produce consolidated estimates as needed.

Gross versus net loans

In the FWA, loans are presented on a gross basis versus net of allowances (or expected credit losses) while in the GFS, loans are presented net of allowances.

Pension entitlement estimates

In the FWA, pension entitlements are measured using pension plan and pension fund information to measure the accrued entitlement benefit. These estimates differ from GFS, which uses pension entitlements as presented according to public sector accounting standards.

Seasonal adjustment

This is unique to the quarterly IEA in which the government estimates are seasonally adjusted, whereas the quarterly FWA are presented on a non-seasonally adjusted basis.

Published information on the government sector

Income and expenditure accounts, quarterly

Taxes less subsidies, government final expenditure, government capital investment, current and capital accounts for general government and sub-sectors

Financial and wealth accounts, quarterly

Government assets and liabilities, non-financial and financial, government net worth, for general government and sub-sectors

Provincial-territorial Economic Accounts, annual

Government revenue, expenditure, and budgetary balance, by region

Government Finance Statistics, quarterly

GFS quarterly data are derived by mapping the quarterly SNA data to GFS standards and conventions

Consolidated Canadian Government Finance Statistics, annual

Government and sub-sector revenues, expenditures and financial transactions

User Guide: Canadian System of Macroeconomic Accounts

Labour Market Indicators - September 2026

In September 2026, questions measuring the Labour Market Indicators were added to the Labour Force Survey as a supplement.
Questionnaire flow within the collection application is controlled dynamically based on responses provided throughout the survey. Therefore, some respondents will not receive all questions, and there is a small chance that some households will not receive any questions at all. This is based on their answers to certain LFS questions.

Labour Market Indicators

ENTRY_Q01 / EQ 1 - From the following list, please select the household member that will be completing this questionnaire on behalf of the entire household.

AIG_Q01 / EQ 2 - Are you aware of Generative AI tools used for generating human-like text, images, computer code and more?

  1. Yes, I am aware and have a good understanding of their use
  2. Yes, I am aware and have some understanding of their use
  3. Yes, I am aware, but do not have a good understanding of their use
  4. No, I have never heard of them

AIG_Q02 / EQ 3 - How familiar are you with Generative AI tools in terms of how they could be applied to your current work?

  1. Familiar with Generative AI tools, but they have no applicability to your work
  2. Not familiar at all
  3. Somewhat familiar
  4. Moderately familiar
  5. Very familiar

AIG_Q03 / EQ 4 - In the last 12 months, did you use any of the following AI or automation technologies as part of your main job or business?

  1.  Generative AI tools
  2. Natural language processing
  3. Voice recognition software
  4. Machine learning
  5. Other
  6. None of the above

AIG_Q04 / EQ 5 - Currently, how often do you use Generative AI tools as part of your main job or business?

  1. Daily
  2. A few times a week
  3. A few times a month
  4. A few times a year

AIG_Q05 / EQ 6 - Currently, for what proportion of tasks do you use Generative AI tools as part of your main job or business?

  1. For almost all tasks
  2. For most tasks
  3. For some tasks
  4. For almost no tasks

AIG_Q06 / EQ 7 - Currently, how often do you use Generative AI tools outside of work?

  1. Daily
  2. A few times a week
  3. A few times a month
  4. A few times a year
  5. Never

AIG_Q07 / EQ 8 - What are the reasons why you are not using Generative AI tools as part of your main job or business?

  1. No interest
  2. Lack of access to AI tools
  3. Too difficult to integrate into your existing workflow
  4. Lack of skills or knowledge
  5. Lack of structured training from your employer
  6. No dedicated time during work hours for informal training
  7. Company or organisational policy
  8. Security, privacy or ethical concerns with using AI
  9. Few or no incentives and rewards
  10. Other
  11. Generative AI tools have no applicability to your work

Delivering trusted, modern statistics for Canadians

For over a century, Statistics Canada (StatCan) has been committed to providing high-quality, insightful, and accessible data to help Canadians better understand their country. Trust is the core currency of official statistics. In an era characterized by a rapid expansion of data sources and an insatiable thirst for information, we continually anchor our work in strict professional standards, transparency, and accountability. 

At the same time, producing official statistics has become increasingly complex. Canada's economy and society are evolving rapidly, shaped by globalization, technological change, new business models, shifting demographics, climate-related events, and the growing digital economy. Canadians expect statistics that are more timely, detailed, connected, and cost-effective—all while maintaining the highest standards of quality and trust. Meeting these expectations requires continual innovation in how official statistics are produced, without compromising the professional principles that underpin them.

Recent discussions have highlighted the universal challenges national statistical agencies face—including an increasingly complex information environment shaped by misinformation and disinformation, evolving public engagement, changing survey response dynamics, and the need to operate efficiently within current fiscal realities. We hear these perspectives and are proactively reshaping how we gather, guard, and grow our data systems to meet the expectations of Canadians today and into the future. 

Addressing changing response rates: The shift to a modern collection ecosystem

Traditional survey response rates have experienced a global downward trend over the past few decades, driving a strategic shift in how we build a more resilient statistical ecosystem. 

To maintain the high accuracy and representation that Canadians rely on, we are implementing a multi-faceted approach: 

  • An "administrative data first" approach: To reduce response burden on households and businesses, we are increasingly leveraging existing secure administrative and alternative data sources, such as tax data, municipal rolls, and land registries. By integrating these sources into our statistical programs, we can often substitute or supplement traditional survey questions. For example, household income information that was once collected directly through surveys is now largely obtained from administrative data files provided by the Canada Revenue Agency. This improves data quality while reducing the number of questions Canadians are asked to answer.
  • Responsive and sustainable collection: We are incorporating behavioural science and active monthly live testing into major programs like the Labour Force Survey (LFS). By better understanding our respondents, optimizing our digital communications, and focusing follow-up efforts on under-represented units, we are actively modernizing operations to keep our landmark surveys strong. 
  • Advanced non-response treatments: StatCan utilizes cutting-edge mathematical models and external validation data to protect against non-response bias. This ensures that even with smaller sample sizes or shifting response dynamics, the final data outputs remain robust, representative, and highly granular. 
  • Responsible AI and machine learning: To improve efficiency, enhance quality, and respond to emerging information needs, we are responsibly integrating artificial intelligence (AI) and machine learning into statistical production and analysis. Through human oversight, transparent methods, bias mitigation, and strong governance, these tools uphold the principles of official statistics while helping maintain the public trust that underpins our work.

Clarifying revisions: Precision in a fast-moving economy

In a fast-moving economy, delivering information when it matters most requires a careful balance between timeliness and ultimate completeness. StatCan publishes initial estimates using the highest-quality data available at that moment. As more complete information flows in over subsequent months—such as corporate tax updates, comprehensive trade summaries, or late survey responses—we refine those numbers. This standard methodology ensures that policymakers, businesses, and the public are equipped with immediate insights first, while valuable information received afterwards is incorporated to yield the most complete and accurate historical record possible. 

A key element of modern statistical science is the standard practice of data revisions. Revisions are not a sign of initial error; they reflect a commitment to timeliness, precision, transparency, and producing the best possible evidence. Today's economy is more dynamic and interconnected than ever, making the measurement of economic activity and unexpected economic shocks increasingly complex. As additional information becomes available, revisions ensure that Canada's economic statistics continue to reflect the most accurate picture of the economy.

Guarding privacy and fostering transparency

We recognize that the willingness of Canadians to participate in our data collection relies entirely on their confidence in our privacy frameworks. Through the Statistics Canada Trust Centre, we make our data governance visible. Every project we undertake is strictly evaluated against the pillars of legal authority, necessity, proportionality, and ethics. 

Whether we are deploying advanced machine learning tools or integrating complex datasets, we mask, anonymize, and de-identify personal data to guarantee that individual privacy is never compromised. 

Keeping standards and measurement frameworks current

Producing relevant official statistics also requires continually updating the standards and measurement frameworks that underpin them. As Canada's economy and society evolve, so too must the concepts, classifications, and statistical frameworks used to measure them. Emerging technologies, new forms of work, digital commerce, globalization, and changing social realities require ongoing methodological review to ensure that official statistics remain meaningful, internationally comparable, and reflective of Canadians' lived experiences. By regularly modernizing these foundational standards, StatCan ensures that the data used by governments, businesses, researchers, and Canadians continues to accurately represent the country we measure.

Looking to the future

Maintaining the relevance of official statistics requires continual improvement. As outlined in our 2026-27 Departmental Plan, we are working to deliver a fuller, more connected picture of Canada with significantly less response burden. By modernizing and standardizing key processes, expanding the use of integrated data sources, and preparing our data and technology environment to support advanced analytics and AI, we are ensuring that Canadian data remains a global standard for trustworthiness and public good. 

Monthly Survey of Food Services and Drinking Places: CVs for Total Sales by Geography - June 2026

CVs for Total sales by geography
GeographyMonth
202506202507202508202509202510202511202512202601202602202603202604202605202606
percentage
Canada0.050.050.060.060.080.070.090.120.10.080.110.140.12
Newfoundland and Labrador0.260.20.20.280.310.320.450.530.460.440.660.870.67
Prince Edward Island0.390.40.340.450.591.171.171.71.441.021.354.820.76
Nova Scotia0.20.170.190.240.250.60.430.380.360.720.570.620.43
New Brunswick0.240.190.210.350.390.820.360.470.410.970.570.60.42
Quebec0.080.080.170.150.270.170.180.280.240.20.240.280.23
Ontario0.090.070.090.10.130.120.160.20.160.130.190.230.22
Manitoba0.240.230.220.340.370.590.520.690.610.690.70.70.48
Saskatchewan0.390.540.260.40.350.690.460.531.110.690.780.990.47
Alberta0.150.190.160.160.170.20.230.320.210.220.380.370.31
British Columbia0.10.160.120.120.130.170.190.250.20.20.230.290.29
Yukon Territory0.911.031.071.321.642.062.182.842.742.433.072.952.88
Northwest Territories2.511.181.291.171.292.172.342.842.62.3312.262.872.77
Nunavut2.142.6747.682.722.464.641.92.852.593.363.543.63.14

Visitor Travel Survey: AES Calibration Groups - Q1 2026

Table 1
AES Calibration Groups for American Visitors
Calibration groupsNumber of groups
Region/Province of entry by duration of stay18
Table 2
AES Calibration Groups for Overseas Visitors
Calibration groupsNumber of groups
Country of residence 24
Country of residence by duration48
Region by duration10

Eh Sayers Episode 34 - A Honeybee Trivia Showdown

Release date: August 19, 2026

Catalogue number: 45200003
ISSN: 2816-2250

Eh Sayers Episode 34 - A Honeybee Trivia Showdown

Listen to "Eh Sayers" on:

Think your honeybee knowledge is as sweet as honey? Test it in this Eh Sayers trivia showdown. Discover honey production, beekeeper numbers, colony counts and the vital role bees play in our food supply.

Host

Max Zimmerman

Guests

Jacqueline Luffman, Marc Lemire, Vince Germano

Listen to audio

Eh Sayers Episode 34 - A Honeybee Trivia Showdown - Transcript

Max: Welcome to a special summer edition of Eh Sayers Trivia. Today, I've forced three of my colleagues to come compete against each other in a series of skill testing questions. Today's theme, bees. The rules are simple. I'll ask them all four questions worth one point each and one bonus question worth three points.

Whoever has the most points at the end of the show wins. What's the prize for the winner, you might ask? Absolutely nothing, except... No, really, nothing. The studio's buzzing, so grab your honey and get ready to see who comes out on top as our queen bee. Without further ado, let's meet our contestants

Jackie: I'm Jacqueline Luffman.

I am chief of publishing services and dissemination division. I've been here 29 years.

Marc: My name is Marc Lemire. I am chief of corporate communications here at Statistics Canada.

Max: All right. Welcome to the winner of the inaugural Christmas tree trivia episode of Eh Sayers. Who am I sitting in front of right now?

Please introduce yourself to all the folks for your victory lap.

Vince: I am Vince Germano, a communications officer at Statistics Canada.

Max: And how much do you know about bees and honey? On a scale of one to 10, where, where would you rank yourself?

Jackie: On a scale of one to 10, I would rank myself maybe a five.

Marc: Oh, my gosh.

Uh, let's, let's go middle of the pack to lower. So let's go with four. Four. Four.

Max: So like a seasoned bee expert.

Marc: Y- oh, yeah. Don't embarrass me. Well, I'll, I'll do my best. Thank goodness for multiple choice.

Max: Okay.

Vince: Mm. I would say probably like six

Max: All right, so we'll jump right into it here. Question number one, are you ready?

Jackie: Sure.

Vince: Yes, let's do it. I guess I just buzz in?

Max: That's... Oh, look at what he did there. Yes, sir. Okay. Number one, how many pounds of honey were produced in Canada in 2025? Multiple choice here: A, 43 million pounds of honey; B, 71 million pounds; C, 84 million pounds; or D, 117 million pounds.

Jackie: Well, this is, this is tough, and I don't know yet how many beekeepers there are or anything like that.

I like the middle. I'm gonna say 80 million pounds or whatever the 81 was.

Max: C, 84 million pounds.

Jackie: 84 million pounds. Final answer.

Max: Final answer.

Vince: Let's go with A. A, 43 million pounds, final answer?

Marc: Yes. Let's go with C, 84 million.

Max: C, 84 million, final answer?

Marc: Final answer.

Max: Correct. Yes, sir. You got it. 84 million pounds of honey was produced in Canada in 2025.

Well done.

Marc: I am off to a lucky start.

Jackie: I like middle. We're- That was my strategy.

Max: We're batting 1,000. Let's keep it up. Okay.

Jackie: All right.

Max: All right, moving on. Number two, so sales of honey rose 14.8% year over year in 2025. Ooh. What is the total dollar amount of honey sold in 2025? You got A, $241 million worth of honey; B, $356 million; C, $792 million; or D, $1.3 billion.

Vince: That's a lot of honey, some would say. Let's go with D.

Jackie: Ooh, okay. Well, if there was about 80 million pounds and generated... Well, that doesn't necessarily mean that all of it was sold, but I would imagine you have to at least... You know, it's gonna be over a dollar a pou- Well, maybe it'd be a dollar a pound. Eh, it could be more than that.

Max: I like where you're going with this.

Jackie: You see where I'm going, yeah?

Max: Absolutely. I- Yes.

I'm catching what you're putting down.

Jackie: Again, this is my reverse math here. Um, I think I'll go with B. Billion.

Marc: Wow. What was B again?

Max: B was $356 million.

Marc: That one sounds good to me.

Max: B. Locking it in?

Marc: Locking it in.

Max: The answer was A, $241 million.

Jackie: No.

Max: But that's close. Okay. You were in the ballpark. Oh, you

Jackie: know what? I was doing-

Max: Yeah. Oh, 100%. I- You were... I thought you were gonna get it bang on. Yeah. But not far off, so.

Jackie: I, I went a little high.

Max: Well- I

Marc: was, I was on the

Max: right side. Yeah, absolutely. Definitely. A

Marc: billion dollars in sales.

Max: That's- $1.3 billion is a lot.

Yeah. That's for sure.

Marc: Yeah.

Max: That's for sure.

Okay. Number three: In 2025- Mm-hmm ... the number of beekeepers in Canada rose 6.5% year over year to its highest level since the 1980s. The number of beekeepers in Canada in 2025 was almost double the number compared to a decade ago. The question is, how many beekeepers were there in Canada in 2025?

No multiple choice on this one.

Vince: Let's go with around 8,000.

Jackie: Oh, Lord. Um, y- I did read something about beekeepers recently, something we produced in th- at Stats Can.

Vince: Okay.

Jackie: So I thought there was actually, like, in the thousands. I thought it was, like, 20,000 maybe.

Marc: Okay, so it doubled from where it was in the '80s.

Max: No, it's reached its highest level since the 1980s.

Marc: Oh,

okay. Sorry.

Max: And it's doubled compared to a decade ago.

Marc: Right. Okay. Gotcha. Let's go with, uh, 15,000 beekeepers.

Max: Marc, are you a genius? Because the answer was 16,000- Really? ... 360 beekeepers.

Marc: That was a shot in the dark. I swear I did not study for this.

Max: All right, moving on.

So number four, there's two kinds of bees. There's honeybees and pollinator bees. 4/5 of all honey produced in Canada in 2025 came from the honeybees of the prairie provinces. Pollinator bees don't make as much honey, but they do make more money. So pollinator bees contribute billions of dollars annually to Canada's farm economy.

Bees are essential for pollinating many fruits and vegetables grown in Canada, including apples in Nova Scotia, blueberries in Quebec, veggies in Ontario, and cherries in British Columbia. All that being considered, almost 2/3, 64.5%, of beekeepers in Canada in 2025 were located in this province: A, Ontario, B, British Columbia, C, Quebec, D, Saskatchewan, or E, Manitoba.

Jackie: Well, even though I am originally from Winnipeg, I'm not gonna say Manitoba 'cause I don't think that's the answer. Okay. I'm gonna guess it, because it's the biggest province, Ontario.

Marc: I'm gonna go Quebec.

Max: C, Quebec, finally.

Marc: C, quebec, final answer.

Vince: Uh, let's go with D, Saskatchewan.

Max: D, Saskatchewan. The answer was B, British Columbia.

Jackie: Oh.

Vince: What?

Max: Yeah.

Jackie: Interesting.

Max: Yeah.

Jackie: Okay.

Max: Caught me off guard as well.

Jackie: But it sort of makes sense for pollinator bees, doesn't it?

Max: That's right.

So the bonus, are you ready?

Jackie: Yeah.

Max: This is the big one.

Jackie: Okay.

Max: Not for all the marbles, but for a lot of the marbles.

Jackie: Okay.

Max: All right. According to StatCan's Food Availability release-

Jackie: Mm-hmm

Max: which estimates the amount of food physically present in the country for consumption, how many kilograms of honey were available per Canadian in 2023? No multiple choice.

Jackie: Per person, okay. So our population is around 41 million.

Max: Mm-hmm.

Jackie: I would say we produced, if I recall, you said we produced lot of pounds of honey there.

So I'm going to say, kilograms you want?

Max: Kilograms of honey per person.

Jackie: I would say like two kilograms per person.

Vince: Kilograms?

Max: Mm-hmm.

Vince: I have no idea.

Max: Got to guess. Take your time.

Vince: 1,800 kilograms.

Max: 1,800 kilograms per person.

Vince: Let's just go with that.

Max: The answer is just over one kilogram per Canadian.

Vince: Oh, really?

Jackie: Really?

Max: Yeah. Great answer.

Jackie: Well, that's awesome.

Marc: Okay, now let's not have that go to air then.

Max: No, good try. Good try. 25, I mean, you're, you're in the ballpark still. I mean...

Marc: I just, I figured, yeah, I figured it would produce a lot more.

Max: Congratulations to my and your queen bee, Jacquie Luffman.

Jackie: Okay. There. That's awesome.

I do make a mean honey cake.

Max: Okay. Well...

Jackie: Yes. And you use about, you know, a full cup and a half of honey.

Max: I need to try this cake then.

Jackie: Yes. Okay. Yes. I have a very good recipe if you ever need it, so.

Max: You've been listening to Eh Sayers. Thank you to our guests Jacquie Luffman, Vince Germano and Mark Lemire. You can find this show wherever you get your podcasts. There, you can also find a French version of our show called Écoutez bien. If you like this show, please rate, review and subscribe. And as always, thanks for listening.

Quarterly Survey of Financial Statements: Weighted Asset Response Rate - second quarter 2026

Weighted Asset Response Rate
Table summary
This table displays the results of Weighted Asset Response Rate. The information is grouped by Release date (appearing as row headers), 2025 Q2, Q3 and Q4 and 2026 Q1 and Q2 calculated using percentage units of measure (appearing as column headers).
Release date20252026
Q2Q3Q4Q1Q2
percentage
August 24, 202684.583.178.678.062.1
May 25, 202684.583.178.659.7 
February 25, 202681.878.258.1  
November 24, 202574.861.0   
August 25, 202561.4    
.. not available for a specific reference period
Source: Quarterly Survey of Financial Statements (2501)

Quarterly Financial Report for the quarter ended June 30, 2026

Statement outlining results, risks and significant changes in operations, personnel and program

A) Introduction

Statistics Canada's mandate

Statistics Canada ("the agency") is a member of the Innovation, Science and Economic Development portfolio.

Statistics Canada's role is to ensure that Canadians have access to a trusted source of statistics on Canada that meets their highest priority needs.

The agency's mandate derives primarily from the Statistics Act. The Act requires that the agency collects, compiles, analyzes and publishes statistical information on the economic, social, and general conditions of the country and its people. It also requires that Statistics Canada conduct the 2026 Census of Population and the 2026 Census of Agriculture every fifth year and protects the confidentiality of the information with which it is entrusted.

Statistics Canada also has a mandate to co-ordinate and lead the national statistical system. The agency is considered a leader, among statistical agencies around the world, in co–ordinating statistical activities to reduce duplication and reporting burden.

More information on Statistics Canada's mandate, roles, responsibilities and programs can be found in the 2026-2027 Main Estimates and in the Statistics Canada 2026-2027 Departmental Plan.

The Quarterly Financial Report:

  • should be read in conjunction with the 2026-2027 Main Estimates;
  • has been prepared by management, as required by Section 65.1 of the Financial Administration Act, and in the form and manner prescribed by Treasury Board of Canada Secretariat;
  • has not been subject to an external audit or review.

Statistics Canada has the authority to collect and spend revenue from other federal government departments and agencies, as well as from external clients, for statistical services and products.

Basis of presentation

This quarterly report has been prepared by management using an expenditure basis of accounting. The accompanying Statement of Authorities includes the agency's spending authorities granted by Parliament and those used by the agency consistent with the Main Estimates for the 2026-2027 fiscal year. This quarterly report has been prepared using a special purpose financial reporting framework designed to meet financial information needs with respect to the use of spending authorities.

The authority of Parliament is required before moneys can be spent by the Government. Approvals are given in the form of annually approved limits through appropriation acts or through legislation in the form of statutory spending authority for specific purposes.

The agency uses the full accrual method of accounting to prepare and present its annual departmental financial statements that are part of the departmental results reporting process. However, the spending authorities voted by Parliament remain on an expenditure basis.

B) Highlights of fiscal quarter and fiscal year-to-date results

This section highlights the significant items that contributed to the net increase in resources available for the year, as well as actual expenditures for the quarter ended June 30.

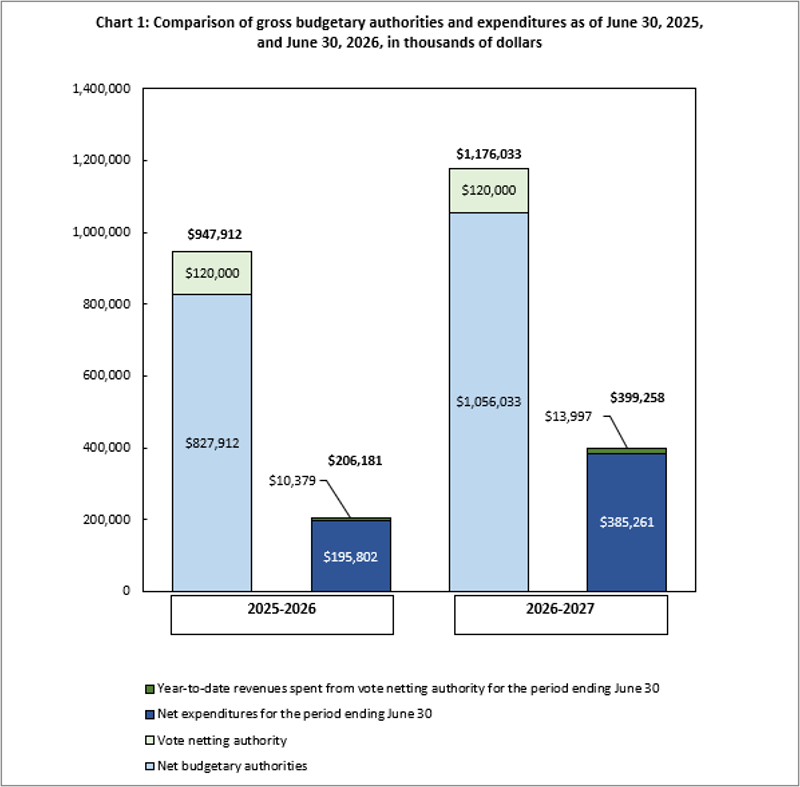
Chart 1 outlines the gross budgetary authorities, which represent the resources available for use for the year as of June 30.

Chart 1: Comparison of gross budgetary authorities and expenditures as of June 30, 2025, and June 30, 2026, in thousands of dollars

Significant changes to authorities

Total authorities available for 2026-27 have increased by $228.1 million, or 24.1%, from the previous year, from $947.9 million to $1.176 billion (Chart 1). The net increase is mostly the result of the following:

  • An increase of $300.7 million for the 2026 Census programs for new cyclical funding received to cover operational activities including Census collection;
  • An increase of $14.9 million for the Employee Benefit Plan adjustments and compensation funding related to collective agreements;
  • A decrease in $52.9 million for the Comprehensive Expenditure Review (CER) announced in Budget 2025;
  • A decrease of $25.9 million for cloud operations. Through the Spring Economic Update 2026, the Government announced an extension of this funding through 2028–29;
  • A decrease of $8 million for various initiatives including Canada's Action Plan on Combatting Hate and the Flood Risk Awareness Portal.

In addition to the appropriations allocated to the agency through the Main Estimates, Statistics Canada also has vote net authority within Vote 1, which entitles the agency to spend revenues collected from other federal government departments, agencies, and external clients to provide statistical services. The vote netting authority is stable at $120 million when comparing the first quarter of fiscal years 2025-2026 and 2026-2027.

Significant changes to expenditures

Year-to-date net expenditures recorded to the end of the first quarter increased by $189.5 million, or 96.8% from the previous year, from $195.8 million to $385.3 million (see Table A: Variation in Departmental Expenditures by Standard Object).

Statistics Canada spent approximately 36.5% of its authorities by the end of the first quarter, compared with 23.7% in the same quarter of 2025-2026.

Table A: Variation in Departmental Expenditures by Standard Object (unaudited)
Departmental Expenditures Variation by Standard Object:Q1 year-to-date variation between fiscal year 2025-2026 and 2026-2027
$'000%
(01) Personnel11,4846.1
(02) Transportation and communications53,6571,496.0
(03) Information4,923373.5
(04) Professional and special services121,1943,054.6
(05) Rentals2,04022.5
(06) Repair and maintenance32.5
(07) Utilities, materials and supplies-7-8.3
(08) Acquisition of land, buildings and works--
(09) Acquisition of machinery and equipment-390-87.1
(10) Transfer payments--
(12) Other subsidies and payments174118.5
Total gross budgetary expenditures193,07896.1
Less revenues netted against expenditures:
Revenues3,61834.9
Total net budgetary expenditures189,46096.8

Note: Explanations are provided for variances of more than $1 million.

Personnel: There is an overall increase in the agency's activities as the 2026 Censuses are in their main collection period this quarter. This increase in spending is partly offset by savings targets announced in Budget 2025 under the Comprehensive Expenditure Review (CER).

Transportation and communications: The increase is mainly due to postage costs for the mailing of Census materials as well as travel expenditures for enumerators for the 2026 Censuses collection activities occurring this fiscal year.

Information: The increase is mainly due to advertisement and printing costs for the 2026 Census materials such as questionnaires, envelopes, and letters.

Professional and special services: The increase is mainly due to the cost incurred for Statistics Act employees hired to conduct the 2026 Censuses.

Rentals: The increase is mainly due to additional costs for logistical requirements for the 2026 Censuses, as well as timing differences in invoicing compared to last year.

Revenues: The increase is mainly due to timing differences in invoicing compared to last year.

C) Significant changes to operations, personnel and programs

In 2026-27, the following changes in operations, personnel and program activities are underway:

  • The 2026 Census programs are currently underway. As a result, expenditures for this program are at their peak.
  • Funding for cloud infrastructure is not reflected in the authorities for 2026-27 since funding was originally set to end in 2025–26. However, through the Spring Economic Update 2026, the Government announced an extension of this funding through 2028–29. The associated funding is expected to be received by Statistics Canada during the 2026–27 fiscal year. As a result, the impact of this announced funding is not yet captured in the figures presented.
  • To support the implementation of the savings targets announced in Budget 2025 for the Comprehensive Expenditure Review, Statistics Canada will achieve these reductions through program realignment, targeted reductions and rescoping, and cost-saving efficiencies.

D) Risks and uncertainties

Statistics Canada continues to address financial and operational uncertainties through its integrated risk management framework.  Budget fluctuations related to cyclical programs, such as the Censuses, and anticipated impacts from the Comprehensive Expenditure Review are being managed through strong governance, disciplined financial management, and strategic resource allocation. At the same time, the agency continues to improve efficiency through automation, greater use of existing data sources and enhanced digital services. Strong partnerships across government and continued refinement of collaborative approaches are strengthening organizational resilience and supporting the efficient delivery of high-quality statistical information to Canadians.

Approval by senior officials

Approved by:

André Loranger
Chief Statistician
Ottawa, Ontario
Signed on: August 11, 2026

Martin Chapman
Acting Chief Financial Officer
Ottawa, Ontario
Signed on: July 30, 2026

Appendix

Statement of Authorities (unaudited)
 Fiscal year 2026-2027Fiscal year 2025–2026
Total available for use for the year ending March 31, 2027Footnote 1Used during the quarter ended June 30, 2026Year-to-date used at quarter-endTotal available for use for the year ending March 31, 2026Footnote 1Used during the quarter ended June 30, 2025Year-to-date used at quarter-end
in thousands of dollars
Vote 1 — Net operating expenditures945,509357,630357,630724,106169,851169,851
Statutory authority — Contribution to employee benefit plans110,52427,63127,631103,80625,95125,951
Total budgetary authorities1,056,033385,261385,261827,912195,802195,802
Departmental budgetary expenditures by Standard Object (unaudited)
 Fiscal year 2026-2027Fiscal year 2025–2026
Planned expenditures for the year ending March 31, 2027Expended during the quarter ended June 30, 2026Year-to-date used at quarter-endPlanned expenditures for the year ending March 31, 2026Expended during the quarter ended June 30, 2025Year-to-date used at quarter-end
in thousands of dollars
Expenditures:
(01) Personnel784,447198,919198,919782,276187,435187,435
(02) Transportation and communications107,58357,24457,24431,9943,5873,587
(03) Information24,5706,2416,24114,8651,3181,318
(04) Professional and special services218,207125,162125,16249,4473,9683,968
(05) Rentals27,06311,10411,10452,1899,0649,064
(06) Repair and maintenance1,3851281281,314125125
(07) Utilities, materials and supplies1,59682822,6868989
(08) Acquisition of land, buildings and works277--502--
(09) Acquisition of machinery and equipment9,60658588,983448448
(10) Transfer payments------
(12) Other subsidies and payments1,2993203203,656147147
Total gross budgetary expenditures1,176,033399,258399,258947,912206,181206,181
Less revenues netted against expenditures:
Revenues120,00013,99713,997120,00010,37910,379
Total revenues netted against expenditures120,00013,99713,997120,00010,37910,379
Total net budgetary expenditures1,056,033385,261385,261827,912195,802195,802

Annual Exploration, Development and Capital Expenditures Survey: Petroleum and Natural Gas Industry - Preliminary Estimate for 2026 and Intentions for 2027

Why are we conducting this survey?

This survey collects data on capital expenditures in Canada. The information is used by federal and provincial government departments and agencies, trade associations, universities and international organizations for policy development and as a measure of regional economic activity.

Your information may also be used by Statistics Canada for other statistical and research purposes.

Your participation in this survey is required under the authority of the Statistics Act.

Other important information

Authorization to collect this information

Data are collected under the authority of the Statistics Act, Revised Statutes of Canada, 1985, Chapter S-19.

Confidentiality

By law, Statistics Canada is prohibited from releasing any information it collects that could identify any person, business, or organization, unless consent has been given by the respondent, or as permitted by the Statistics Act. Statistics Canada will use the information from this survey for statistical purposes only.

Record linkages

To enhance the data from this survey and to reduce the reporting burden, Statistics Canada may combine the acquired data with information from other surveys or from administrative sources.

Data-sharing agreements

To reduce respondent burden, Statistics Canada has entered into data-sharing agreements with provincial and territorial statistical agencies and other government organizations, which have agreed to keep the data confidential and use them only for statistical purposes. Statistics Canada will only share data from this survey with those organizations that have demonstrated a requirement to use the data.

Section 11 of the Statistics Act provides for the sharing of information with provincial and territorial statistical agencies that meet certain conditions. These agencies must have the legislative authority to collect the same information, on a mandatory basis, and the legislation must provide substantially the same provisions for confidentiality and penalties for disclosure of confidential information as the Statistics Act. Because these agencies have the legal authority to compel businesses to provide the same information, consent is not requested and businesses may not object to the sharing of the data.

For this survey, there are Section 11 agreements with the provincial and territorial statistical agencies of Newfoundland and Labrador, Nova Scotia, New Brunswick, Quebec, Ontario, Manitoba, Saskatchewan, Alberta, British Columbia, and the Yukon. The shared data will be limited to information pertaining to business establishments located within the jurisdiction of the respective province or territory.

Section 12 of the Statistics Act provides for the sharing of information with federal, provincial or territorial government organizations. Under Section 12, you may refuse to share your information with any of these organizations by writing a letter of objection to the Chief Statistician, specifying the organizations with which you do not want Statistics Canada to share your data and mailing it to the following address:

Chief Statistician of Canada
Statistics Canada
Attention of Director, Enterprise Statistics Division
150 Tunney’s Pasture Driveway
Ottawa, Ontario
K1A 0T6

You may also contact us by email at statcan.esd-helpdesk-dse-bureaudedepannage.statcan@canada.ca- this link will open in a new window or by fax at 613-951-6583.

For this survey, there are Section 12 agreements with the statistical agencies of Prince Edward Island, the Northwest Territories and Nunavut as well as Environment and Climate Change Canada, Infrastructure Canada, the Canada Energy Regulator, Natural Resources Canada and Sustainability Development Technology Canada.

For agreements with provincial and territorial government organizations, the shared data will be limited to information pertaining to business establishments located within the jurisdiction of the respective province or territory.

Business or organization and contact information

1. Verify or provide the business or organization's legal and operating name and correct where needed.

Note: Legal name modifications should only be done to correct a spelling error or typo.

Legal Name

The legal name is one recognized by law, thus it is the name liable for pursuit or for debts incurred by the business or organization. In the case of a corporation, it is the legal name as fixed by its charter or the statute by which the corporation was created.

Modifications to the legal name should only be done to correct a spelling error or typo.

To indicate a legal name of another legal entity you should instead indicate it in question 3 by selecting 'Not currently operational' and then choosing the applicable reason and providing the legal name of this other entity along with any other requested information.

Operating Name

The operating name is a name the business or organization is commonly known as if different from its legal name. The operating name is synonymous with trade name.

Legal name

Operating name (if applicable)

2. Verify or provide the contact information of the designated business or organization contact person for this questionnaire and correct where needed.

Note: The designated contact person is the person who should receive this questionnaire. The designated contact person may not always be the one who actually completes the questionnaire.

First name

Last name

Title

Preferred language of communication

  • English
  • French

Mailing address (number and street)

City

Province, territory or state

Postal code or ZIP (Zone Improvement Plan) code
Example: A9A 9A9 or 12345-1234

Country
  • Afghanistan
  • Åland Islands
  • Albania
  • Algeria
  • American Samoa
  • Andorra
  • Angola
  • Anguilla
  • Antarctica
  • Antigua and Barbuda
  • Argentina
  • Armenia
  • Aruba
  • Australia
  • Austria
  • Azerbaijan
  • Bahamas
  • Bahrain
  • Bangladesh
  • Barbados
  • Belarus
  • Belgium
  • Belize
  • Benin
  • Bermuda
  • Bhutan
  • Bolivia
  • Bonaire, Sint Eustatius and Saba
  • Bosnia and Herzegovina
  • Botswana
  • Bouvet Island
  • Brazil
  • British Indian Ocean Territory
  • Brunei Darussalam
  • Bulgaria
  • Burkina Faso
  • Burma (Myanmar)
  • Burundi
  • Cambodia
  • Cameroon
  • Canada
  • Cape Verde
  • Cayman Islands
  • Central African Republic
  • Chad
  • Chile
  • China
  • Christmas Island
  • Cocos (Keeling) Islands
  • Colombia
  • Comoros
  • Congo, Republic of the
  • Congo, The Democratic Republic of the
  • Cook Islands
  • Costa Rica
  • Côte d'Ivoire
  • Croatia
  • Cuba
  • Curaçao
  • Cyprus
  • Czech Republic
  • Denmark
  • Djibouti
  • Dominica
  • Dominican Republic
  • Ecuador
  • Egypt
  • El Salvador
  • Equatorial Guinea
  • Eritrea
  • Estonia
  • Ethiopia
  • Falkland Islands (Malvinas)
  • Faroe Islands
  • Fiji
  • Finland
  • France
  • French Guiana
  • French Polynesia
  • French Southern Territories
  • Gabon
  • Gambia
  • Georgia
  • Germany
  • Ghana
  • Gibraltar
  • Greece
  • Greenland
  • Grenada
  • Guadeloupe
  • Guam
  • Guatemala
  • Guernsey
  • Guinea
  • Guinea-Bissau
  • Guyana
  • Haiti
  • Heard Island and McDonald Islands
  • Holy See (Vatican City State)
  • Honduras
  • Hong Kong Special Administrative Region
  • Hungary
  • Iceland
  • India
  • Indonesia
  • Iran
  • Iraq
  • Ireland, Republic of
  • Isle of Man
  • Israel
  • Italy
  • Jamaica
  • Japan
  • Jersey
  • Jordan
  • Kazakhstan
  • Kenya
  • Kiribati
  • Korea, North
  • Korea, South
  • Kosovo
  • Kuwait
  • Kyrgyzstan
  • Laos
  • Latvia
  • Lebanon
  • Lesotho
  • Liberia
  • Libya
  • Liechtenstein
  • Lithuania
  • Luxembourg
  • Macao Special Administrative Region
  • Macedonia, Republic of
  • Madagascar
  • Malawi
  • Malaysia
  • Maldives
  • Mali
  • Malta
  • Marshall Islands
  • Martinique
  • Mauritania
  • Mauritius
  • Mayotte
  • Mexico
  • Micronesia, Federated States of
  • Moldova
  • Monaco
  • Mongolia
  • Montenegro
  • Montserrat
  • Morocco
  • Mozambique
  • Namibia
  • Nauru
  • Nepal
  • Netherlands
  • New Caledonia
  • New Zealand
  • Nicaragua
  • Niger
  • Nigeria
  • Niue
  • Norfolk Island
  • Northern Mariana Islands
  • Norway
  • Oman
  • Pakistan
  • Palau
  • Panama
  • Papua New Guinea
  • Paraguay
  • Peru
  • Philippines
  • Pitcairn
  • Poland
  • Portugal
  • Puerto Rico
  • Qatar
  • Réunion
  • Romania
  • Russian Federation
  • Rwanda
  • Saint Barthélemy
  • Saint Helena
  • Saint Kitts and Nevis
  • Saint Lucia
  • Saint Martin (French part)
  • Saint Pierre and Miquelon
  • Saint Vincent and the Grenadines
  • Samoa
  • San Marino
  • Sao Tome and Principe
  • Sark
  • Saudi Arabia
  • Senegal
  • Serbia
  • Seychelles
  • Sierra Leone
  • Singapore
  • Sint Maarten (Dutch part)
  • Slovakia
  • Slovenia
  • Solomon Islands
  • Somalia
  • South Africa, Republic of
  • South Georgia and the South Sandwich Islands
  • South Sudan
  • Spain
  • Sri Lanka
  • Sudan
  • Suriname
  • Svalbard and Jan Mayen
  • Swaziland
  • Sweden
  • Switzerland
  • Syria
  • Taiwan
  • Tajikistan
  • Tanzania
  • Thailand
  • Timor-Leste
  • Togo
  • Tokelau
  • Tonga
  • Trinidad and Tobago
  • Tunisia
  • Turkey
  • Turkmenistan
  • Turks and Caicos Islands
  • Tuvalu
  • Uganda
  • Ukraine
  • United Arab Emirates
  • United Kingdom
  • United States
  • United States Minor Outlying Islands
  • Uruguay
  • Uzbekistan
  • Vanuatu
  • Venezuela
  • Viet Nam
  • Virgin Islands, British
  • Virgin Islands, United States
  • Wallis and Futuna
  • West Bank and Gaza Strip (Palestine)
  • Western Sahara
  • Yemen
  • Zambia
  • Zimbabwe

Email address
Example: user@example.gov.ca

Telephone number (including area code)
Example: 123-123-1234

Extension number (if applicable)

Fax number (including area code)
Example: 123-123-1234

3. Verify or provide the current operational status of the business or organization identified by the legal and operating name above.

  • Operational
  • Not currently operational
  • e.g., (for example) temporarily or permanently closed, change of ownership

Why is this business or organization not currently operational?

  • Seasonal operations
  • Ceased operations
  • Sold operations
  • Amalgamated with other businesses or organizations
  • Temporarily inactive but will re-open
  • No longer operating due to other reasons

When did this business or organization close for the season?

  • Date
    Example: YYYY-MM-DD

When does this business or organization expect to resume operations?

  • Date
    Example: YYYY-MM-DD

When did this business or organization cease operations?

  • Date
    Example: YYYY-MM-DD

Why did this business or organization cease operations?

  • Bankruptcy
  • Liquidation
  • Dissolution
  • Other

Specify the other reasons why the operations ceased.

When was this business or organization sold?

  • Date
    Example: YYYY-MM-DD

What is the legal name of the buyer?

When did this business or organization amalgamate?

  • Date
    Example: YYYY-MM-DD

What is the legal name of the resulting or continuing business or organization?

What are the legal names of the other amalgamated businesses or organizations?

When did this business or organization become temporarily inactive?

  • Date
    Example: YYYY-MM-DD

When does this business or organization expect to resume operations?

  • Date
    Example: YYYY-MM-DD

Why is this business or organization temporarily inactive?

When did this business or organization cease operations?

  • Date
    Example: YYYY-MM-DD

Why did this business or organization cease operations?

4. Verify or provide the current main activity of the business or organization identified by the legal and operating name above.

Note: The described activity was assigned using the North American Industry Classification System (NAICS).

This question verifies the business or organization's current main activity as classified by the North American Industry Classification System (NAICS). The North American Industry Classification System (NAICS) is an industry classification system developed by the statistical agencies of Canada, Mexico and the United States. Created against the background of the North American Free Trade Agreement, it is designed to provide common definitions of the industrial structure of the three countries and a common statistical framework to facilitate the analysis of the three economies. NAICS is based on supply-side or production-oriented principles, to ensure that industrial data, classified to NAICS , are suitable for the analysis of production-related issues such as industrial performance.

The target entity for which NAICS is designed are businesses and other organizations engaged in the production of goods and services. They include farms, incorporated and unincorporated businesses and government business enterprises. They also include government institutions and agencies engaged in the production of marketed and non-marketed services, as well as organizations such as professional associations and unions and charitable or non-profit organizations and the employees of households.

The associated NAICS should reflect those activities conducted by the business or organizational units targeted by this questionnaire only, as identified in the 'Answering this questionnaire' section and which can be identified by the specified legal and operating name. The main activity is the activity which most defines the targeted business or organization's main purpose or reason for existence. For a business or organization that is for-profit, it is normally the activity that generates the majority of the revenue for the entity.

The NAICS classification contains a limited number of activity classifications; the associated classification might be applicable for this business or organization even if it is not exactly how you would describe this business or organization's main activity.

Please note that any modifications to the main activity through your response to this question might not necessarily be reflected prior to the transmitting of subsequent questionnaires and as a result they may not contain this updated information.

The following is the detailed description including any applicable examples or exclusions for the classification currently associated with this business or organization.

Description and examples

  • This is the current main activity
  • This is not the current main activity

Provide a brief but precise description of this business or organization's main activity.

e.g. , breakfast cereal manufacturing, shoe store, software development

Main activity

5. You indicated that is not the current main activity.

Was this business or organization's main activity ever classified as:?

  • Yes
    • When did the main activity change?
      • Date
  • No

6. Search and select the industry classification code that best corresponds to this business or organization's main activity.

How to search:

  • if desired, you can filter the search results by first selecting this business or organization's activity sector
  • enter keywords or a brief description that best describes this business or organization main activity
  • press the Search button to search the database for an activity that best matches the keywords or description you provided
  • then select an activity from the list.

Select this business or organization's activity sector (optional)

  • Farming or logging operation
  • Construction company or general contractor
  • Manufacturer
  • Wholesaler
  • Retailer
  • Provider of passenger or freight transportation
  • Provider of investment, savings or insurance products
  • Real estate agency, real estate brokerage or leasing company
  • Provider of professional, scientific or technical services
  • Provider of health care or social services
  • Restaurant, bar, hotel, motel or other lodging establishment
  • Other sector

Reporting period information

1. What are the start and end dates of this organization's 2026 fiscal year?

Note: For this survey, the end date should fall between April 1, 2026 and March 31, 2026.

Here are twelve common fiscal periods that fall within the targeted dates:

  • May 1, 2025 to April 30, 2026
  • June 1, 2025 to May 31, 2026
  • July 1, 2025 to June 30, 2026
  • August 1, 2025 to July 31, 2026
  • September 1, 2025 to August 31, 2026
  • October 1, 2025 to September 30, 2026
  • November 1, 2025 to October 31, 2026
  • December 1, 2025 to November 30, 2026
  • January 1, 2026 to December 31, 2026
  • February 1, 2026 to January 31, 2027
  • March 1, 2026 to February 28, 2027
  • April 1, 2026 to March 31, 2027.

Here are other examples of fiscal periods that fall within the required dates:

  • September 18, 2025 to September 15, 2026 (e.g., floating year-end)
  • June 1, 2026 to December 31, 2026 (e.g., a newly opened business).

Fiscal Year Start
Example: YYYY-MM-DD

  • Date

Fiscal Year-End
Example: YYYY-MM-DD

  • Date

2. What is the reason the reporting period does not cover a full year?

Select all that apply.

Seasonal operations

New business

Change of ownership

Temporarily inactive

Change of fiscal year

Ceased operations

Other reason - specify:

Additional reporting instructions

3. Throughout this questionnaire, please report financial information in thousands of Canadian dollars.

For example, an amount of $763,880.25 should be reported as:

CAN$ '000

I will report in the format above.

Capital Expenditures - Preliminary Estimate 2026

4. For the fiscal year 2026, what are this organization's preliminary estimates for capital expenditures?

Include: all capitalized overhead and capitalized interest.

  • When there are partnerships and joint venture activities or projects, report the expenditures reflecting this corporation's net interest in such projects or ventures.
  • Report all dollar amounts in thousands of Canadian dollars ('000).
  • Exclude sales tax.
  • When precise figures are not available, please provide your best estimates.

If there are no capital expenditures, please enter '0'.

A. Oil and gas rights acquisition and retention costs (exclude inter-company sales or transfers):

Include acquisition costs and fees for oil and gas rights (include bonuses, legal fees and filing fees), and oil and gas retention costs.

B. Exploration and evaluation, capitalized or expensed ( e.g. , leases and licences, seismic, exploration drilling):

These expenditures include mineral rights fees and retention costs, geological, geophysical and seismic expenses, exploration drilling, and other costs incurred during the reporting period in order to determine whether oil or gas reserves exist and can be exploited commercially. Report gross expenditures, before deducting any incentive grants, incurred for oil and gas activities on a contracted basis and/or by your own employees. Exclude the cost of land acquired from other oil and gas companies.

C. Building construction ( e.g. , process building, office building, camp, storage building, and maintenance garage):

Include capital expenditures on buildings such as office buildings, camps, warehouses, maintenance garages, workshops, and laboratories. Fixtures, facilities and equipment that are integral parts of the building are included.

D. Other construction assets ( e.g. , development drilling and completions, processing facilities, natural gas plants, upgraders):

Include all infrastructure, other than buildings, such as the cost of well pads, extraction and processing infrastructure and plants, upgrading units, transportation infrastructure, water and sewage infrastructure, tailings, pipelines and wellhead production facilities (pumpjacks, separators, etc. ). Include all preconstruction planning and design costs such as development drilling, regulatory approvals, environmental assessments, engineering and consulting fees and any materials supplied to construction contractors for installation, as well as site clearance and preparation. Equipment which is installed as an integral or built-in feature of a fixed structure ( e.g. , casings, tanks, steam generators, pumps, electrical apparatus, separators, flow lines, etc. ) should be reported with the construction asset; however, when the equipment is replaced within an existing structure, the replacement cost should be reported in machinery and equipment (sustaining capital).

E. Machinery and equipment purchases ( e.g. , trucks, shovels, computers, etc. ):

Include transportation equipment for people and materials, computers, software, communication equipment, and processing equipment not included in the above categories.

Preliminary Estimate

 2026 Preliminary Estimate ( CAN$ '000 )
Oil and gas rights acquisitions and retention costs 
Exploration and evaluation 
Non-residential building construction 
Development and other construction 
Machinery and equipment 
Total 

Total

Research and Development

5. For the fiscal year 2026, did this organization perform scientific research and development in Canada of at least $10,000 or outsource (contract-out) to another organization scientific research and development activities of at least $10,000?

Research and experimental development (R&D) comprise creative and systematic work undertaken in order to increase the stock of knowledge - including knowledge of humankind, culture and society - and to devise new applications of available knowledge. For an activity to be an R&D activity, it must satisfy five core criteria:

  1. To be aimed at new findings (novel);
  2. To be based on original, not obvious, concepts and hypothesis (creative);
  3. To be uncertain about the final outcome (uncertainty);
  4. To be planned and budgeted (systematic);
  5. To lead to results to could be possibly reproduced (transferable/ or reproducible).

The term R&D covers three types of activity: basic research, applied research and experimental development. Basic research is experimental or theoretical work undertaken primarily to acquire new knowledge of the underlying foundations of phenomena and observable facts, without any particular application or use in view. Applied research is original investigation undertaken in order to acquire new knowledge. It is, however, directed primarily towards a specific, practical aim or objective. Experimental development is systematic work, drawing on knowledge gained from research and practical experience and producing additional knowledge, which is directed to producing new products or processes or to improving existing products or processes.

  • Yes
  • No

Capital Expenditures - Intentions 2027

6. For the fiscal year 2027, what are this organization's intentions for capital expenditures?

Include: all capitalized overhead and capitalized interest.

  • When there are partnerships and joint venture activities or projects, report the expenditures reflecting this corporation's net interest in such projects or ventures.
  • Report all dollar amounts in thousands of Canadian dollars ('000).
  • Do not include sales tax.
  • Percentages should be rounded to whole numbers.
  • When precise figures are not available, please provide your best estimates.

If there are no capital expenditures, please enter '0'.

A. Oil and gas rights acquisition and retention costs (exclude inter-company sales or transfers):

Include acquisition costs and fees for oil and gas rights (include bonuses, legal fees and filing fees), and oil and gas retention costs

B. Exploration and evaluation, capitalized or expensed ( e.g. , leases and licences, seismic, exploration drilling):

These expenditures include mineral rights fees and retention costs, geological, geophysical and seismic expenses, exploration drilling, and other costs incurred during the reporting period in order to determine whether oil or gas reserves exist and can be exploited commercially. Report gross expenditures, before deducting any incentive grants, incurred for oil and gas activities on a contracted basis and/or by your own employees. Exclude the cost of land acquired from other oil and gas companies.

C. Building construction ( e.g. , process building, office building, camp, storage building, and maintenance garage):

Include capital expenditures on buildings such as office buildings, camps, warehouses, maintenance garages, workshops, and laboratories. Fixtures, facilities and equipment that are integral parts of the building are included.

D. Other construction assets ( e.g. , development drilling and completions, processing facilities, natural gas plants, upgraders):

Include all infrastructure, other than buildings, such as the cost of well pads, extraction and processing infrastructure and plants, upgrading units, transportation infrastructure, water and sewage infrastructure, tailings, pipelines and wellhead production facilities (pumpjacks, separators, etc. ). Include all preconstruction planning and design costs such as development drilling, regulatory approvals, environmental assessments, engineering and consulting fees and any materials supplied to construction contractors for installation, as well as site clearance and preparation. Equipment which is installed as an integral or built-in feature of a fixed structure ( e.g. , casings, tanks, steam generators, pumps, electrical apparatus, separators, flow lines, etc. ) should be reported with the construction asset; however, when the equipment is replaced within an existing structure, the replacement cost should be reported in machinery and equipment (sustaining capital).

E. Machinery and equipment purchases ( e.g. , trucks, shovels, computers, etc. ):

Include transportation equipment for people and materials, computers, software, communication equipment, and processing equipment not included in the above categories.

Intentions 2027

 Intentions 2027 ( CAN$ '000 )
Oil and gas rights acquisitions and retention costs 
Exploration and evaluation 
Non-residential building construction 
Development and other construction 
Machinery and equipment 
Total 

Total

7.  You have not reported any capital expenditure intentions for 2027.

Please indicate the reason.

  • Zero capital expenditure intentions for 2027
  • Figures not available but plans are for no change in capital expenditures for 2027
  • Figures not available but plans are for an increase in capital expenditures for 2027
  • Figures not available but plans are for a decrease in capital expenditures for 2027

Research and Development

8. For the 2027 fiscal year, does this organization plan on performing scientific research and development in Canada of at least $10,000 or outsourcing (contracting-out) to another organization scientific research and development activities of at least $10,000?

Research and experimental development (R&D) comprise creative and systematic work undertaken in order to increase the stock of knowledge - including knowledge of humankind, culture and society - and to devise new applications of available knowledge. For an activity to be an R&D activity, it must satisfy five core criteria:

  1. To be aimed at new findings (novel);
  2. To be based on original, not obvious, concepts and hypothesis (creative);
  3. To be uncertain about the final outcome (uncertainty);
  4. To be planned and budgeted (systematic);
  5. To lead to results to could be possibly reproduced (transferable/ or reproducible).

The term R&D covers three types of activity: basic research, applied research and experimental development. Basic research is experimental or theoretical work undertaken primarily to acquire new knowledge of the underlying foundations of phenomena and observable facts, without any particular application or use in view. Applied research is original investigation undertaken in order to acquire new knowledge. It is, however, directed primarily towards a specific, practical aim or objective. Experimental development is systematic work, drawing on knowledge gained from research and practical experience and producing additional knowledge, which is directed to producing new products or processes or to improving existing products or processes.

  • Yes
  • No

Notification of intent to extract web data

9. Does this business have a website?

Statistics Canada engages in web-data extraction, also known as web scraping, which is a process by which information is gathered and copied from the Web using automated scripts or robots, for retrieval and analysis. As a result, we may visit the website for this organization to search for and compile additional information. The use of web scraping is part of a broader effort to reduce the response burden on organizations, as well as produce additional statistical indicators to ensure that our data remain accurate and relevant.

We will strive to ensure that the data collection does not interfere with the functionality of the website. Any data collected will be used by Statistics Canada for statistical and research purposes only, in accordance with the agency’s privacy and confidentiality mandate.

More information regarding Statistics Canada’s web scraping initiative- this link will open in a new window.

Learn more about Statistics Canada’s transparency and accountability- this link will open in a new window.

If you have any questions or concerns, please contact Statistics Canada Client Services, toll-free at 1-877-949-9492 [Teletypewriter or Telecommunication device for the deaf/teletype machine (TTY): 1-800-363-7629] or by email at infostats@statcan.gc.ca - this link will open in a new window. Additional information about this survey can be found by selecting the following link: Annual Capital Expenditures Survey: Preliminary Estimate for 2026 and Intentions for 2027.

Changes or events

10. Indicate any changes or events that affected the reported values for this business or organization, compared with the last reporting period.

Select all that apply.

  • Labour shortages or employee absences
  • Disruptions in supply chains
  • Deferred plans to future or projects on hold
  • Strike or lock-out
  • Exchange rate impact
  • Price changes in goods or services sold
  • Contracting out
  • Organizational change
  • Price changes in labour or raw materials
  • Natural disaster
  • Recession
  • Change in product line
  • Sold business or business units
  • Expansion
  • New or lost contract
  • Plant closures
  • Acquisition of business or business units
  • Other
    Specify the other changes or events:
  • No changes or events

Contact person

11. Statistics Canada may need to contact the person who completed this questionnaire for further information.

Is [Provided Given Names], [Provided Family Name] the best person to contact?

  • Yes
  • No

Who is the best person to contact about this questionnaire?

First name:

Last name:

Title:

Email address:
Example: user@example.gov.ca

Telephone number (including area code):
Example: 123-123-1234

Extension number (if applicable):
The maximum number of characters is 5.

Fax number (including area code):
Example: 123-123-1234

Feedback

12. How long did it take to complete this questionnaire?

Include the time spent gathering the necessary information.

  • Hours:
  • Minutes:

13. Do you have any comments about this questionnaire?