Households and the Environment Survey, 2023 (HES)
Getting started
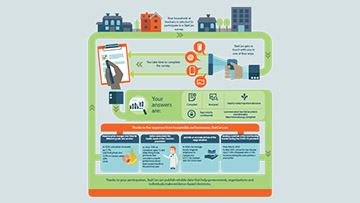
Why are we conducting this survey?
This survey collects information on the behaviours, practices, and awareness level of Canadian households regarding the environment. Results from this survey will help us to understand how Canadians are interacting with the environment.
Your information may also be used by Statistics Canada for other statistical and research purposes.
Although voluntary, your participation is important so that the information collected is as accurate and complete as possible.
Other important information
Authorization and confidentiality
Data are collected under the authority of the Statistics Act, Revised Statutes of Canada, 1985, Chapter S-19. Your information will be kept strictly confidential.
Record linkages
To enhance the data from this survey and to reduce the response burden, Statistics Canada may combine the information you provide with other survey or administrative data sources.
Contact us if you have any questions or concerns about record linkage:
Email: infostats@statcan.gc.ca
Telephone: 1-877-949-9492
Mail:
Chief Statistician of Canada
Statistics Canada
Attention of Director, Environment Accounts and Statistics Division
150 Tunney's Pasture Driveway
Ottawa, Ontario K1A 0T6
Address confirmation
Is the following address your household's primary dwelling?
[Address Line 1]
[Address Line 2]
[City], [Province]
[Postal Code]
- Yes
- No
What is the street address of your primary dwelling?
Please do not enter the address at which you receive your mail if it is different.
- Street number
- Suffix
- 1/4
- 1/2
- 3/4
- Bsmt
- A
- B
- C
- D
- E
- F
- G
- H
- I
- J
- K
- L
- M
- N
- O
- P
- Q
- R
- S
- T
- U
- V
- W
- X
- Y
- Z
- Apartment number
- Street name
- Select a street type from the dropdown menu below.
- Street type
- Street direction
- E (East)
- N (North)
- NE (Northeast)
- NW (Northwest)
- W (West)
- S (South)
- SE (Southeast)
- SW (Southwest)
- P.O. Box or Rural Route number
- City, municipality, town, village
- Province or territory
- Newfoundland and Labrador
- Prince Edward Island
- Nova Scotia
- New Brunswick
- Quebec
- Ontario
- Manitoba
- Saskatchewan
- Alberta
- British Columbia
- Yukon
- Northwest Territories
- Nunavut
- Postal code
Household mailing address
Is this also the mailing address for this household?
- Yes
- No
What is the mailing address?
- Street number
- Suffix
- 1/4
- 1/2
- 3/4
- Bsmt
- A
- B
- C
- D
- E
- F
- G
- H
- I
- J
- K
- L
- M
- N
- O
- P
- Q
- R
- S
- T
- U
- V
- W
- X
- Y
- Z
- Apartment number
- Street name
- Select a street type from the dropdown menu below.
- Street type
- Street direction
- E (East)
- N (North)
- NE (Northeast)
- NW (Northwest)
- W (West)
- S (South)
- SE (Southeast)
- SW (Southwest)
- P.O. Box or Rural Route number
- City, municipality, town, village
- Province or territory
- Newfoundland and Labrador
- Prince Edward Island
- Nova Scotia
- New Brunswick
- Quebec
- Ontario
- Manitoba
- Saskatchewan
- Alberta
- British Columbia
- Yukon
- Northwest Territories
- Nunavut
- Postal code
Dwelling
What type of dwelling is this?
Is it:
- Single-detached house
- Semi-detached house
- Row or terrace
- Duplex
- Apartment or flat
- Institution
- Hotel, rooming or lodging house, camp
- Mobile home
- Other
- Specify type of dwelling
How many floors are there in your building?
Count all floors that have apartments or condo units.
- Floors in your building
Household composition
The next few questions ask for important basic information about the people in this household.
List all persons (names or initials) that usually live at this address. These will be used to help you answer questions about each person.
Include:
those who regard this dwelling as their usual residence or are staying in the dwelling and have no other usual place of residence
those who reside at this dwelling, even if they are temporarily away, at school, at hospital, or somewhere else.
- First name
- Last name
- Age
Sex at birth and gender
The following questions are about sex at birth and gender.
What was the sex at birth of [First name] [Last name] (age [Age])?
Sex refers to sex assigned at birth.
- Male
- Female
What is the gender of [First name] [Last name] (age [Age])?
Gender refers to current gender which may be different from sex assigned at birth and may be different from what is indicated on legal documents.
- Male
- Female
- Or please specify
- Specify this person's gender
Disability
Does [First name] [Last name] (age [Age]) identify as a person with a disability?
A person with a disability is a person who has a long-term difficulty or condition, such as vision, hearing, mobility, flexibility, dexterity, pain, learning, developmental, memory or mental health-related impairments, that limits their daily activities inside or outside the home, such as at school, work, or in the community in general.
- Yes
- No
Indigenous Identity
Is [First name] [Last name] (age [Age]) First Nations, Métis or Inuk (Inuit)?
First Nations (North American Indian) includes Status and Non-Status Indians.
If "Yes", select the responses that best describes this person now.
- No, not First Nations, Métis or Inuk (Inuit)
OR - Yes, First Nation (North American Indian)
- Yes, Métis
- Yes, Inuk (Inuit)
Sociodemographic characteristics
The following question collects information in accordance with the Employment Equity Act and its Regulations and Guidelines to support programs that promote equal opportunity for everyone to share in the social, cultural, and economic life of Canada.
Select all that apply.
Is this person:
- White
- South Asian
e.g. East Indian, Pakistani, Sri Lankan - Chinese
- Black
- Filipino
- Arab
- Latin American
- Southeast Asian
e.g. Vietnamese, Cambodian, Laotian, Thai - West Asian
e.g. Iranian, Afghan - Korean
- Japanese
- Other
- Specify other group
Educational diploma or certificate
What is the highest certificate, diploma or degree that [First name] [Last name] (age [Age]) has completed?
- Less than high school diploma or its equivalent
- High school diploma or a high school equivalency certificate
- Trades certificate or diploma
- College, CEGEP or other non-university certificate or diploma (other than trades certificates or diplomas)
- University certificate or diploma below the bachelor's level
- Bachelor's degree
e.g. B.A., B.A. (Hons), B.Sc., B.Ed., LL.B. - University certificate, diploma or degree above the bachelor's level
Dwelling characteristics
The word "dwelling" refers to a separate set of living quarters with a private entrance either from outside or from a common hall, lobby, vestibule or stairway inside the building. The entrance to the dwelling must be one that can be used without passing through the living quarters of someone else.
What is the heated area of your dwelling?
Exclude the basement, attic and garage.
- Unit of measure
- Square feet (ft²)
- Square metres (m²)
- Area
OR - Don't know
Please provide your best estimate of the heated area.
Exclude the basement and garage.
- 600 ft2 (55 m2) or less
- 601 to 1,000 ft2 (56 to 95 m2)
- 1,001 to 1,500 ft2 (96 to 140 m2)
- 1,501 to 2,000 ft2 (141 to 185 m2)
- 2,001 to 2,500 ft2 (186 to 230 m2)
- 2,501 to 3,000 ft2 (231 to 280 m2)
- 3,001 to 3,500 ft2 (281 to 325 m2)
- 3,501 to 4,000 ft2 (326 to 371 m2)
- 4,001 ft2 (372 m2) or more
- Don't know
Does your dwelling have a basement?
- Yes
- No
- Don't know
What is the heated area of your basement?
- Unit of measure
- Square feet (ft²)
- Square metres (m²)
- Area
OR - Basement not heated
OR - Don't know
Please provide your best estimate of the heated area of your basement.
- 600 ft2 (55 m2) or less
- 601 to 1,000 ft2 (56 to 95 m2)
- 1,001 to 1,500 ft2 (96 to 140 m2)
- 1,501 to 2,000 ft2 (141 to 185 m2)
- 2,001 to 2,500 ft2 (186 to 230 m2)
- 2,501 to 3,000 ft2 (231 to 280 m2)
- 3,001 to 3,500 ft2 (281 to 325 m2)
- 3,501 to 4,000 ft2 (326 to 371 m2)
- 4,001 ft2 (372 m2) or more
- Don't know
How much insulation does the basement have?
- All of the exterior walls
- Half or more of the exterior walls
- Less than half of the exterior walls
- None of the exterior walls
- Don't know
How many stories does your dwelling have?
- Number of stories
OR - Don't know
Does your dwelling have an attic?
- Yes, a partially or fully heated attic
- Yes, an unheated attic
- No
- Don't know
What is the heated area of the attic?
- Unit of measure
- Square feet (ft²)
- Square metres (m²)
- Area
OR - Don't know
Please provide your best estimate of the heated area of your attic.
- 600 ft2 (55 m2) or less
- 601 to 1,000 ft2 (56 to 95 m2)
- 1,001 to 1,500 ft2 (96 to 140 m2)
- 1,501 to 2,000 ft2 (141 to 185 m2)
- 2,001 to 2,500 ft2 (186 to 230 m2)
- 2,501 to 3,000 ft2 (231 to 280 m2)
- 3,001 to 3,500 ft2 (281 to 325 m2)
- 3,501 to 4,000 ft2 (326 to 371 m2)
- 4,001 ft2 (372 m2) or more
- Don't know
Does your dwelling have a garage?
- Yes
- No
- Don't know
Is it attached to the dwelling?
- Yes
- No
- Don't know
What is the heated area of the attached garage?
- Unit of measure
- Square feet (ft²)
- Square metres (m²)
- Area of attached garage
OR - Attached garage is not heated
OR - Don't know
What is the heated area of the detached garage?
- Unit of measure
- Square feet (ft²)
- Square metres (m²)
- Area of detached garage
OR - Detached garage is not heated
OR - Don't know
Please provide your best estimate of the heated area of your garage.
- 600 ft2 (55 m2) or less
- 601 to 1,000 ft2 (56 to 95 m2)
- 1,001 to 1,500 ft2 (96 to 140 m2)
- 1,501 to 2,000 ft2 (141 to 185 m2)
- 2,001 to 2,500 ft2 (186 to 230 m2)
- 2,501 to 3,000 ft2 (231 to 280 m2)
- 3,001 to 3,500 ft2 (281 to 325 m2)
- 3,501 to 4,000 ft2 (326 to 371 m2)
- 4,001 ft2 (372 m2) or more
- Garage is not heated
- Don't know
How much insulation does the garage have?
- Full insulation - all walls, and garage doors are insulated
- Full insulation - all walls, but not the garage doors are insulated
- Partial insulation - some walls are insulated
- None
- Don't know
In what year was this dwelling originally built?
Provide your best estimate.
- Year
When was this dwelling built?
Was it:
- Before 1946
- Between 1946 and 1960
- Between 1961 and 1977
- Between 1978 and 1983
- Between 1984 and 1995
- Between 1996 and 2000
- Between 2001 and 2009
- In 2010 or later
- Don't know
Is this dwelling owned by a member of this household?
Would you say:
- Yes, owned, even if it is still being paid for
- No, rented, even if no cash rent is paid
Is this dwelling part of a condominium development?
- Yes
- No
Is [the condominium corporation/the landlord or property manager] responsible for paying any of the energy bills for this dwelling?
Include bills for electricity, natural gas, heating oil and propane.
- Yes
- No
How long [have you/has your household] lived in this dwelling?
Include the length of time that at least one household member has lived in the current dwelling.
Provide best estimate in months, years or since what year.
- Unit of time
- Months
- Years
- Number
OR - Since what year
Secondary residence
In the past 12 months, did [you/anyone in your household] own a secondary residence in Canada, that was lived in by members of your household for at least part of the year?
A secondary residence is any other dwelling used by the household as secondary living quarters, such as cottages, hobby farms and summer residences.
Exclude income properties, time-shares, and moveable secondary residences, such as trailers and motor homes.
Exclude properties outside of Canada.
- Yes
- No
What is the address of the secondary residence?
- Street number
- Suffix
- 1/4
- 1/2
- 3/4
- Bsmt
- A
- B
- C
- D
- E
- F
- G
- H
- I
- J
- K
- L
- M
- N
- O
- P
- Q
- R
- S
- T
- U
- V
- W
- X
- Y
- Z
- Apartment number
- Street name
- Select a street type from the dropdown menu below.
- Street type
- Street direction
- E (East)
- N (North)
- NE (Northeast)
- NW (Northwest)
- W (West)
- S (South)
- SE (Southeast)
- SW (Southwest)
- P.O. Box or Rural Route number
- City, municipality, town, village
- Province or territory
- Newfoundland and Labrador
- Prince Edward Island
- Nova Scotia
- New Brunswick
- Quebec
- Ontario
- Manitoba
- Saskatchewan
- Alberta
- British Columbia
- Yukon
- Northwest Territories
- Nunavut
- Postal code
During the last 12 months, when was this secondary residence used?
Was it:
- All year
- Partial year
- Not used during the last 12 months
Months when the secondary residence was used:
Select all that apply.
- January
- February
- March
- April
- May
- June
- July
- August
- September
- October
- November
- December
What type of dwelling is this?
Is it:
- Single-detached house
- Semi-detached house
- Row or terrace
- Duplex
- Apartment or flat
- Institution
- Hotel, rooming or lodging house, camp
- Mobile home
- Other
- Specify type of dwelling
How many floors are there in your building?
Count all floors that have apartments or condo units.
- Floors in your building
When was this secondary residence built?
Provide your best estimate.
- Year
When was this secondary residence built?
Was it:
- Before 1946
- Between 1946 and 1960
- Between 1961 and 1977
- Between 1978 and 1983
- Between 1984 and 1995
- Between 1996 and 2000
- Between 2001 and 2009
- In 2010 or later
- Don't know
What is the heated area of your secondary residence?
Include a heated basement, heated attic, and heated attached garage.
- Unit of measure
- Square feet (ft²)
- Square metres (m²)
- Area
OR - Don't know
Please provide your best estimate of the heated area.
Include a heated basement, heated attic and heated attached garage.
- 600 ft2 (55 m2) or less
- 601 to 1,000 ft2 (56 to 95 m2)
- 1,001 to 1,500 ft2 (96 to 140 m2)
- 1,501 to 2,000 ft2 (141 to 185 m2)
- 2,001 to 2,500 ft2 (186 to 230 m2)
- 2,501 to 3,000 ft2 (231 to 280 m2)
- 3,001 to 3,500 ft2 (281 to 325 m2)
- 3,501 to 4,000 ft2 (326 to 371 m2)
- 4,001 ft2 (372 m2) or more
- Don't know
Is this secondary residence connected to the electricity grid?
- Yes
- No
- Don't know
What is the main source of off-grid electricity?
- Solar panels
- Wind turbine
- Micro-hydro
Small-scale hydroelectric systems, such as micro-hydro turbines, can produce enough energy to power off-grid homes. The system pumps water in a pond or a river through a turbine to power an electric generator, which produces electricity that can be stored or used.
- Generator
- Other
- Specify the other main source of off-grid electricity
- Don't know
- Secondary dwelling does not use electricity
What is the secondary dwelling's main type of heating?
Is it:
- A forced air furnace
e.g., hot air vents - Centralized HVAC system
- Electric baseboards
- A heating stove
- Fireplace
- A boiler with hot water or steam radiators
- Electric radiant heating
Exclude in-floor heating
- A heat pump
- Heated floors
- Mini-split heat pump
- Other
- Specify other type of heating equipment
- Don't know
What source of energy does your [forced air furnace/centralized HVAC system/heating stove/fireplace/boiler with hot water or steam radiators/heated floor system/mini-split heat pump/other type of heating equipment] use?
Select all that apply.
Is it:
- Electricity
- Natural gas
- Heating oil
- Wood
Exclude wood pellets.
- Wood pellets
- Propane
- Other
- Specify other source of energy
OR - Don't know
[Do you/Does anyone in your household] own any secondary dwellings used as income properties located within Canada?
Include only income properties.
Exclude:
time-shares, and movable secondary residences, such as trailers and motor homes
properties outside of Canada.
- Yes
- No
How many income properties do you own?
Exclude:
properties outside of Canada
the secondary residence at [Address] in [City] you told us about already
- Number of income properties
What is the primary use of [this income property/the oldest of the income properties]?
- Timeshare vacation property
Shared ownership with other households.
- Vacation property owned fully by your household
- Long-term rental property for investment purpose or additional source of income
- A property for children, parents, or friends to stay without paid rent
- A second home
e.g., stay in the dwelling during work days or weekends only - Other
- Please specify its primary use
Energy use and home heating
The next questions are about how you heat [your primary dwelling/your dwelling].
What is [your primary dwelling/your dwelling]'s main type of heating equipment?
Is it:
- A forced air furnace
e.g., hot air vents - Centralized HVAC system
- Electric baseboards
- A heating stove
- Fireplace
- A boiler with hot water or steam radiators
- Electric radiant heating
Exclude in-floor heating.
- A heat pump
- Heated floors
- Mini-split heat pump
- Other
- Specify other type of heating equipment
- Don't know
What source of energy does your [forced air furnace/centralized HVAC system/heating stove/fireplace/boiler with hot water or steam radiators/heated floor system/mini-split heat pump/other type of heating equipment] use?
Select all that apply.
Is it:
- Electricity
- Natural gas
- Heating oil
- Wood
Exclude wood pellets.
- Wood pellets
- Propane
- Other
- Specify other source of energy
OR - Don't know
What is the efficiency rating of the furnace?
- High
i.e., the exhaust pipe is plastic and vents through the side of the house
- Medium
i.e., the exhaust pipe or chimney is metal and vents through the side of the house or through the roof
- Low
i.e., the exhause pipe or chimney is metal and vents through the roof
- Don't know
In addition to the [forced air furnace/centralized HVAC system/electric baseboards/heating stove/fireplace/boiler with hot water or steam radiators/electric radiant heating/heat pump/heated floor system/mini-split heat pump/other type of heating equipment], do you have another type of heating equipment?
- Yes
- No
Is it:
- A forced air furnace
e.g., hot air vents - Centralized HVAC system
- Electric baseboards
- A heating stove
- Fireplace
- A boiler with hot water or steam radiators
- Electric radiant heating
Exclude in-floor heating.
- A heat pump
- Heated floors
- Mini-split heat pump
- Other
- Specify other type of heating equipment
- Don't know
What source of energy does your [forced air furnace/centralized HVAC system/heating stove/fireplace/boiler with hot water or steam radiators/heated floor system/mini-split heat pump/other type of heating equipment] use?
Select all that apply.
Is it:
- Electricity
- Natural gas
- Heating oil
- Wood
Exclude wood pellets.
- Wood pellets
- Propane
- Other
- Specify other source of energy
OR - Don't know
Wood [– primary dwelling]
The following questions pertain to your primary dwelling.
[In addition to the forced air furnace that uses wood or wood pellets, d/In addition to the heating stove that uses wood or wood pellets, d/In addition to the boiler with hot water or steam radiators that uses wood or wood pellets, d/In addition to the heated floors that use wood or wood pellets, d/In addition to the fireplace that uses wood or wood pellets, d/In addition to the main heating system that uses wood or wood pellets, d/D]id you use wood or wood pellets in any other appliances inside [your primary dwelling/your home], such as for supplemental heating or cooking, in the past 12 months?
- Yes
- No
In which appliances?
Select all that apply.
- Heating stove that does not use wood pellets
- Heating stove that does use wood pellets
- Wood fireplace that does not have an insert for wood
- Wood fireplace that has an insert for wood
- Cook stove with oven
- Water heater
- Hydronic heater
e.g., wood-fired boiler - Forced air furnace
- Other
- Specify other appliances
[Including the forced air furnace you mentioned earlier, w/Including the heating stove you mentioned earlier, w/Including the boiler with hot water or steam radiators you mentioned earlier, w/Including the heated floors you mentioned earlier, w/Including the other type of heating equipment you mentioned earlier, w/W]hich one did you use most often in the past 12 months?
- Heating stove that does not use wood pellets
- Heating stove that does use wood pellets
- Wood fireplace that does not have an insert for wood
- Wood fireplace that has an insert for wood
- Cook stove with oven
- Water heater
- Hydronic heater
e.g., wood-fired boiler - Forced air furnace
- [Forced air furnace/Heating stove/Boiler with hot water or steam radiators/Heated floors/Fireplace/Other type of heating equipment] (main heating system)
Thinking of your heating stove, is it a cook stove with oven?
- Yes
- No
- Don't know
Thinking of your fireplace that does not have an insert, is it open (i.e., it does not have doors)?
- Yes, it is open
- No
- Don't know
Thinking of your fireplace that does have an insert, is it open (i.e., it does not have doors)?
- Yes, it is open
- No
- Don't know
How old is your [heating stove that does not use wood pellets/heating stove that does use wood pellets/wood fireplace that does not have an insert for wood/wood fireplace that has an insert for wood/cook stove with oven/water heater/hydronic heater/forced air furnace/boiler with hot water or steam radiators/heating stove/heated floor system/fireplace/main heating system/appliance]?
Provide age in years or year purchased.
- Age in years
- Age in years
Enter "0" if less than 12 months.
- Year purchased
- Year
- Same age as the primary dwelling
- Don't know
Does your [heating stove that does not use wood pellets/heating stove that does use wood pellets/wood fireplace that does not have an insert for wood/wood fireplace that has an insert for wood/cook stove with oven/water heater/hydronic heater/forced air furnace/boiler with hot water or steam radiators/heating stove/heated floor system/fireplace/main heating system/appliance] have a gasket or rope seal around the door?
- Yes
- No
- Don't know
When was the last time the chimney or flue connected to your [heating stove that does not use wood pellets/heating stove that does use wood pellets/wood fireplace that does not have an insert for wood/wood fireplace that has an insert for wood/cook stove with oven/water heater/hydronic heater/forced air furnace/boiler with hot water or steam radiators/heating stove/heated floor system/fireplace/main heating system/appliance] was cleaned?
Exclude chimney cleaning logs.
- Within the last year
- 1 year to less than 3 years ago
- 3 years to less than 5 years ago
- 5 or more years ago
- Never
- Don't know
Do you have an outdoor wood oven or fireplace, a fire pit or something similar outside [your primary dwelling/your home]?
- Yes
- No
How many times did you use it in the past 12 months?
- Number of times
How often did you use your outdoor wood oven or fireplace, fire pit or something similar outside [your primary dwelling/your home]?
- Daily
- More than once a week
- More than once a month
- A few times a season
- A few times a year
- Other
- Specify other frequency
Excluding wood pellets and manufactured logs, how much wood have you burned at home for heating, cooking and outdoors in the past 12 months?
- Unit of measure
- Full or bush cords (8 feet long by 4 feet high by 4 feet wide; or 3 to 4 face cords)
- Face cords (8 feet long by 4 feet high by 12 to 16 inches wide)
- Full-sized pick-up trucks (8 foot box)
- Compact-sized pick-up trucks (6 foot box)
- Bags (64 bags = 1 full cord)
- Logs (1 log = 16 inches in length)
- Cubic feet
- Cubic metres
- Other – specify
- Specify other unit of measure
- Quantity
OR - Not applicable
How much of this wood was burned during the winter heating season?
Was it:
- All
- At least half or more
- Less than half
- None
What type of wood was burned?
Was it:
- Mostly hard wood
- Mostly soft wood
- Mixed
- Don't know
Where do you obtain most of your wood from?
Is it:
- From trees on land around your home, including deadfall
- From trees on land [you own/your household owns] elsewhere
e.g., your secondary residence - From trees on land [you rent or lease/your household rents or leases]
- From trees cut on public land or Crown land
- From an individual, including neighbours
- From a store other than a lumber store
- From a lumber store
- From a wood or lumber or forestry company
- Other
- Specify other source of your wood
For the wood that you burned, how was it cut?
- Mostly cut to length, but not split
e.g., round wood - Mostly cut to length and split
- Other
- Specify how it was cut
Do you usually store your wood at home prior to burning?
- Yes
- No, it is usually burned immediately
How long is it typically stored for?
- Unit of time
- Days
- Weeks
- Months
- Seasons
- Years
- Other – specify
- Specify other unit of time
- Length of time
Is your wood stored primarily indoors or outdoors?
It is stored:
- Primarily indoors
Include garages and sheds as indoors.
- Primarily outdoors
Is it covered or protected from the elements?
e.g., by a tarp or shelter
- Yes, covered on top and sides
- Yes, partially covered on top only
- Yes, partially covered on sides only
- No
In the past 12 months, did you use manufactured logs?
Manufactured logs, also known as eco logs, are made from sawdust and wood-shavings that have been formed into briquettes of high-energy fuel.
Exclude pressure-treated wood and logs to clean your chimney.
- Yes
- No
How many have you used at home?
- Unit of measure
- Logs
- Bags
- Boxes/Cases
- Pallets
- Kilograms
- Tonnes (metric)
- Pounds
- Tons (imperial)
- Tons (United States)
- Other – specify
- Specify other unit of measure
- Quantity
How many logs are in a [bag/box/case/pallet]?
- Number of logs
Do you know the quantity of wood pellets used at home in the past 12 months?
- Yes
- Unit of measure
- Kilograms
- Tonnes (metric)
- Pounds
- Tons (imperial)
- Tons (United States)
- Skid
- Other – specify
- Specify other unit of measure
- Quantity
- Unit of measure
- No
- Did not use wood pellets
Would you say it is:
- 100 pounds (45 kilograms) or less
- 101 to 250 pounds (46 to 113 kilograms)
- 251 to 500 pounds (114 to 227 kilograms)
- 501 to 1,000 pounds (228 to 454 kilograms)
- 1,001 to 2,500 pounds (455 to 1,136 kilograms)
- 2,501 to 4,000 pounds (1,137 to 1,818 kilograms)
- 4,001 to 5,500 pounds (1,819 to 2,500 kilograms)
- 5,501 pounds (2,501 kilograms) or more
- Don't know
How do you purchase your wood pellets?
Select all that apply.
- Bags or boxes
- Bulk
- Other
- Specify other type of purchase
Wood - secondary residence
The following questions pertain to your secondary residence.
[In addition to the forced air furnace that uses wood or wood pellets, d/In addition to the heating stove that uses wood or wood pellets, d/In addition to the boiler with hot water or steam radiators that uses wood or wood pellets, d/In addition to the heated floors that use wood or wood pellets, d/In addition to the fireplace that uses wood or wood pellets, d/In addition to the main heating system that uses wood or wood pellets, d/D]id you use wood or wood pellets in any other appliances inside your secondary residence, such as for supplemental heating or cooking, in the past 12 months?
- Yes
- No
In which appliances?
Select all that apply.
- Heating stove that does not use wood pellets
- Heating stove that does use wood pellets
- Wood fireplace that does not have an insert for wood
- Wood fireplace that has an insert for wood
- Cook stove with oven
- Water heater
- Hydronic heater
e.g., wood-fired boiler - Forced air furnace
- Other
- Specify other appliances
[Including the forced air furnace you mentioned earlier, w/Including the heating stove you mentioned earlier, w/Including the boiler with hot water or steam radiators you mentioned earlier, w/Including the heated floors you mentioned earlier, w/Including the fireplace you mentioned earlier, w/Including the other type of heating equipment you mentioned earlier, w/W]hich one did you use most often in the past 12 months at your secondary residence?
- Heating stove that does not use wood pellets
- Heating stove that does use wood pellets
- Wood fireplace that does not have an insert for wood
- Wood fireplace that has an insert for wood
- Cook stove with oven
- Water heater
- Hydronic heater
e.g., wood-fired boiler - Forced air furnace
- [Forced air furnace/Heating stove/Boiler with hot water or steam radiators/Heated floors/Fireplace/Other type of heating equipment] (main heating system)
Thinking of your heating stove, is it a cook stove with oven?
- Yes
- No
- Don't know
Thinking of your fireplace that does not have an insert, is it open (i.e., it does not have doors)?
- Yes, it is open
- No
- Don't know
Thinking of your fireplace that does have an insert, is it open (i.e., it does not have doors)?
- Yes, it is open
- No
- Don't know
How old is your [heating stove that does not use wood pellets/heating stove that does use wood pellets/wood fireplace that does not have an insert for wood/wood fireplace that has an insert for wood/cook stove with oven/water heater/hydronic heater/forced air furnace/boiler with hot water or steam radiators/heating stove/heated floor system/fireplace/main heating system/appliance]?
Provide age in years or year purchased.
- Age in years
- Age in years
Enter "0" if less than 12 months.
- Year purchased
- Year
- Same age as the secondary residence
- Don't know
Does your [heating stove that does not use wood pellets/heating stove that does use wood pellets/wood fireplace that does not have an insert for wood/wood fireplace that has an insert for wood/cook stove with oven/water heater/hydronic heater/forced air furnace/boiler with hot water or steam radiators/heating stove/heated floor system/fireplace/main heating system/appliance] have a gasket or rope seal around the door?
- Yes
- No
- Don't know
When was the last time the chimney or flue connected to it was cleaned at your secondary residence?
Exclude chimney cleaning logs.
- Within the last year
- 1 year to less than 3 years ago
- 3 years to less than 5 years ago
- 5 or more years ago
- Never
- Don't know
Do you have an outdoor wood oven or fireplace, a fire pit or something similar outside your secondary residence?
- Yes
- No
How many times did you use it in the past 12 months?
- Number of times
How often did you use your outdoor wood oven or fireplace, fire pit or something similar outside your secondary residence?
- Daily
- More than once a week
- More than once a month
- A few times a season
- A few times a year
- Other
- Specify other frequency
Excluding wood pellets and manufactured logs, how much wood have you burned at your secondary residence for heating, cooking and outdoors in the past 12 months?
- Unit of measure
- Full or bush cords (8 feet long by 4 feet high by 4 feet wide; or 3 to 4 face cords)
- Face cords (8 feet long by 4 feet high by 12 to 16 inches wide)
- Full-sized pick-up trucks (8 foot box)
- Compact-sized pick-up trucks (6 foot box)
- Bags (64 bags = 1 full cord)
- Logs (1 log = 16 inches in length)
- Cubic feet
- Cubic metres
- Other – specify
- Specify other unit of measure
- Quantity
OR - Not applicable
How much of this wood was burned during the winter heating season at your secondary residence?
Was it:
- All
- At least half or more
- Less than half
- None
What type of wood was burned?
Was it:
- Mostly hard wood
- Mostly soft wood
- Mixed
- Don't know
Where do you obtain most of your wood from at your secondary residence?
Is it:
- From trees on land around your secondary residence, including deadfall
- From trees on land [you own/your household owns] elsewhere
e.g., your primary dwelling - From trees on land [you rent or lease/your household rents or leases]
- From trees cut on public land or Crown land
- From an individual, including neighbours
- From a store other than a lumber store
- From a lumber store
- From a wood or lumber or forestry company
- Other
- Specify other source of your wood
For the wood that you burned at your secondary residence, how was it cut?
- Mostly cut to length, but not split
e.g., round wood - Mostly cut to length and split
- Other
- Specify how it was cut
Do you usually store your wood at your secondary residence prior to burning?
- Yes
- No, it is usually burned immediately
How long is it typically stored for?
- Unit of time
- Days
- Weeks
- Months
- Seasons
- Years
- Other – specify
- Specify other unit of time
- Length of time
Is your wood stored primarily indoors or outdoors?
It is stored:
- Primarily indoors
Include garages and sheds as indoors.
- Primarily outdoors
Is it covered or protected from the elements?
e.g., by a tarp or shelter
- Yes, covered on top and sides
- Yes, partially covered on top only
- Yes, partially covered on sides only
- No
In the past 12 months, did you use manufactured logs at your secondary residence?
Manufactured logs, also known as eco logs, are made from sawdust and wood-shavings that have been formed into briquettes of high-energy fuel.
Exclude pressure-treated wood and logs to clean your chimney.
- Yes
- No
How many have you used at your secondary residence?
- Unit of measure
- Logs
- Bags
- Boxes/Cases
- Pallets
- Kilograms
- Tonnes (metric)
- Pounds
- Tons (imperial)
- Tons (United States)
- Other – specify
- Specify other unit of measure
- Quantity
How many logs are in a [bag/box/case/pallet]?
- Number of logs
Do you know the quantity of wood pellets used at your secondary residence in the past 12 months?
- Yes
- Unit of measure
- Kilograms
- Tonnes (metric)
- Pounds
- Tons (imperial)
- Tons (United States)
- Skid
- Other – specify
- Specify other unit of measure
- Quantity
- Unit of measure
- No
- Did not use wood pellets
Would you say it is:
- 100 pounds (45 kilograms) or less
- 101 to 250 pounds (46 to 113 kilograms)
- 251 to 500 pounds (114 to 227 kilograms)
- 501 to 1,000 pounds (228 to 454 kilograms)
- 1,001 to 2,500 pounds (455 to 1,136 kilograms)
- 2,501 to 4,000 pounds (1,137 to 1,818 kilograms)
- 4,001 to 5,500 pounds (1,819 to 2,500 kilograms)
- 5,501 pounds (2,501 kilograms) or more
- Don't know
How do you purchase your wood pellets?
Select all that apply.
- Bags or boxes
- Bulk
- Other
- Specify other type of purchase
Information
The next questions are about [your primary dwelling/your dwelling].
Energy use and home heating [– primary dwelling]
The next questions are about the use of energy in [your primary dwelling/your dwelling].
[Do you/Does your household] use any alternative energy sources in your dwelling besides electricity, natural gas, heating oil, propane, wood or wood pellets?
- Yes
- No
Which alternative energy sources do you use?
Select all that apply.
- Geothermal
- Solar panels used to heat water
- Solar panels used to generate electricity
e.g., photovoltaic - Wind power
- Biofuels
e.g., biodiesel - Other
- Specify other alternative energy sources
Which of the following types of air conditioners does your dwelling have?
Select all that apply.
- A central air system
- A stand-alone unit in a window or elsewhere
- Mini-split through wall heat pump
- A heat pump
- A heat-recovery ventilation unit (HRV)
- Other
- Specify other type of air conditioner
OR - This dwelling does not have an air conditioner
How many stand-alone units in a window or elsewhere are in your dwelling?
- Number of stand-alone units
What is the cooling capacity of the standalone unit used most often?
If you don't know the cooling capacity, enter "0".
- Cooling capacity in BTUs
Does your dwelling have a thermostat?
A thermostat can control or regulate the temperature in your dwelling.
- Yes
- No
Do you have more than one thermostat?
- Yes
- No
[Is it/Is your main thermostat] programmable?
[The main thermostat is the one you use most often.]
A programmable thermostat can be set to automatically change the temperature according to the time of day.
- Yes
- No
- Don't know
Is it programmed?
- Yes
- No
Are any of the thermostats in your dwelling connected to the Internet?
- Yes
- No
- Don't know
During the winter season, at what temperature is the dwelling usually kept?
Round up to the nearest degree.
When you are there and awake
- Temperature
Report in °C or °F
OR
- Heating system turned off
- Don't know
When you are asleep
- Temperature
Report in °C or °F
OR
- Heating system turned off
- Don't know
Compared to when you are there and awake, what is the temperature when you are asleep?
Is it:
- Higher
- Lower
- Same
When using your air conditioner during the summer season, at what temperature is the dwelling usually kept?
Round up to the nearest degree.
When you are there and awake
- Temperature
Report in °C or °F
OR
- Air conditioner turned off
- Don't know
When you are asleep
- Temperature
Report in °C or °F
OR
- Air conditioner turned off
- Don't know
Compared to when you are there and awake, what is the temperature when you are asleep?
Is it:
- Higher
- Lower
- Same
When using your air conditioner during the summer season, at what temperature is the dwelling usually kept when you are not at home?
Round up to the nearest degree.
- Temperature
Report in °C or °F
OR
- Air conditioner turned off
- Don't know
The next questions are about [your primary dwelling/your dwelling].
Do you have any of the following types of energy saving lights?
Select all that apply.
Such as:
- Compact fluorescent lights
e.g., corkscrew or spiral - Fluorescent tubes
- Halogen lights
- LED holiday lights
- Other types of LED lights
OR - None of the above
What proportion of all of the lights in your dwelling are LEDs?
- All
- More than half
- Half
- Less than half
Has an energy audit ever been conducted for your dwelling?
- Yes
- No
- Don't know
Thinking about your energy audit, provide the following details.
a. Was it conducted in the last 10 years?
- Yes
- No
- Don't know
b. Were any changes made to the dwelling as a result of the audit?
e.g., replacing windows, upgrading insulation, replacing or upgrading furnace, or installing programmable thermostats
- Yes
- No
- Don't know
c. Was a government grant received as part of a home energy retrofit program?
- Yes
- No
- Don't know
How many windows do you have in your dwelling?
Include all exterior windows, windows in exterior doors (including patio doors), basement windows and windows that cannot be opened.
- Number of windows
Thinking of the majority of the windows in your dwelling, what type are they?
Exclude windows in doors and patio doors.
- Standard single pane with storm window
A storm window is an extra window pane installed either outside or inside of the main glass window to give extra wind protection and weather insulation.
- Standard single pane
- Standard double pane (with or without argon gas)
- Standard triple pane sealed unit (with or without argon gas)
- Other
- Specify the other type
- Don't know
In the past 12 months, were any of the following improvements made to your dwelling?
Select all that apply.
- Replaced or upgraded the heating equipment
- Replaced or upgraded the water heater
- Replaced windows
- Re-caulked windows
- Replaced or added insulation
- Replaced or installed exterior wall siding
- Replaced exterior doors
- Installed or upgraded a thermostat
- Installed solar photovoltaic panels
- Installed a solar hot water system
- Installed drain-water heat recovery system
- Replaced or installed central air conditioning or ventilation
- Repaired the foundation
- Replaced roof
- Other
- Specify the other improvements
OR - None of the above
What proportion of the windows in the dwelling were replaced?
- All
- More than half
- Half
- Less than half
- Don't know
What proportion of the windows in the dwelling were re-caulked?
- All
- More than half
- Half
- Less than half
- Don't know
What proportion of the exterior doors in the dwelling were replaced?
- All
- More than half
- Half
- Less than half
- Don't know
Do you plan to make any of the following improvements in the next 5 years?
- Replace or upgrade the heating equipment
- Replace or upgrade the water heater
- Replace windows
- Re-caulk windows
- Replace or add insulation
- Replace or install exterior wall siding
- Replace exterior doors
- Install or upgrade a thermostat
- Install solar photovoltaic panels
- Install a solar hot water system
- Install drain-water heat recovery system
- Replace or install central air conditioning or ventilation
- Repair the foundation
- Replace roof
- Other
- Specify the other improvements
OR - None of the above
OR - Don't know
What proportion of the windows in the dwelling are planned to be replaced?
- All
- More than half
- Half
- Less than half
- Don't know
What proportion of the windows in the dwelling are planned to be re-caulked?
- All
- More than half
- Half
- Less than half
- Don't know
What proportion of the exterior doors in the dwelling are planned to be replaced?
- All
- More than half
- Half
- Less than half
- Don't know
Appliances [– primary dwelling]
How many refrigerators [do you/does your household] have?
Exclude refrigerators that are not regularly used or are not plugged in.
If [you do/your household does] not have any refrigerators, enter "0".
- Number
OR - Don't know
How many stand-alone freezers [do you/does your household] have?
Include upright and chest freezers.
If [you do/your household does] not have any stand-alone freezer, enter "0".
- Number
OR - Don't know
Thinking of the [most frequently used] stand-alone freezer, what type is it?
- Upright
- Chest
- Don't know
What size is this [upright/chest] freezer?
- Very small (less than 7.0 cubic feet)
- Small (7.1 to 13.9 cubic feet)
- Medium (14.0 to 17.9 cubic feet)
- Large (18.0 to 22.9 cubic feet)
- Very large (23 cubic feet or larger)
- Don't know
How many regular stoves or ranges [do you/does your household] have?
Include gas, conventional electric and electric induction ranges and stoves that have both an oven and a stovetop.
Exclude built-in ovens that have no cooktops, and separate cooktops that have no oven.
If [you do/your household does] not have any regular stoves or ranges, enter "0".
- Number
OR - Don't know
Thinking of the stove or range [most frequently used], what is its source of energy?
Select all that apply.
- Electricity
- Natural gas
- Oil
- Wood
Exclude wood pellets.
- Wood pellets
- Propane
- Other
- Specify the other source of energy
OR - Don't know
What type is it?
- Convectional electric
- Induction
Electric stove that uses electromagnetism to heat cookware.
- Don't know
How many minutes a day is this stove or range used?
Provide your best estimate.
- Less than 30 minutes a day
- 30 minutes to less than 60 minutes a day
- 60 minutes to less than 90 minutes a day
- 90 minutes to less than 2 hours a day
- 2 hours a day or more
- Don't know
How many separate cook-tops [do you/does your household] have?
A separate cook-top is a cooking stove that does not have an oven below it.
Include built-in countertop, cook-tops, and cooking surfaces.
Exclude plug-in devices such as hot-plates, air fryers, electric grills, BBQs, etc.
If [you do/your household does] not have any separate cook-top, enter "0".
- Number
OR - Don't know
Thinking of the separate cook-top [most frequently used], what is its source of energy?
Select all that apply.
- Electricity
- Natural gas
- Oil
- Wood
Exclude wood pellets.
- Wood pellets
- Propane
- Other
- Specify the other source of energy
OR - Don't know
What type is it?
- Convectional electric
- Induction
Electric stove that uses electromagnetism to heat cookware.
- Don't know
How many built-in ovens [do you/does your household] have?
A built-in oven is an oven that is not part of a cook-top.
Exclude toaster ovens.
If [you do/your household does] not have any built-in oven, enter "0".
- Number
OR - Don't know
How many dishwashers [do you/does your household] have?
If [you do/your household does] not have any dishwashers, enter "0".
- Number
OR - Don't know
Thinking of the most frequently used dishwasher, are the dishes rinsed before they are put in the dishwasher?
- Always or almost always
- Often
- Sometimes
- Rarely
- Never
- Don't know
How are the dishes usually dried?
- Heated dry cycle
- Unheated dry, door closed
- Air dried, door open
- Don't know
How many clothes washing machines [do you/does your household] have?
[Report the number of clothes washing machines in your apartment unit. Exclude communal clothes washers.]
If [you do/your household does] not have any clothes washing machines, enter "0".
- Number
OR - Don't know
What water temperature is most often used for the following cycles?
a. Wash cycle
- Hot
- Warm
- Cold
- Don't know
b. Rinse cycle
- Hot
- Warm
- Cold
- Don't know
In an average week, how many loads of laundry are washed in your dwelling?
- Number of loads in the summer
- Number of loads in the winter
OR - Don't know
[Do you/Does your household] use the steam setting of the washing machine?
- Yes
- No
- Don't know
- Washing machine does not have a steam setting
How many clothes dryers [do you/does your household] have?
[Report the number of clothes dryer machines in your apartment unit. Exclude communal clothes dryers.]
If [you do/your household does] not have any clothes dryers, enter "0".
- Number
OR - Don't know
In an average week, how many loads of laundry are dried using the clothes dryer in your dwelling?
- Number of loads in the summer
- Number of loads in the winter
OR - Don't know
Thinking of the clothes dryer used most often, what is its source of energy?
Select all that apply.
- Electricity only
- Natural gas only
- Electricity and natural gas
- Oil
- Wood
Exclude wood pellets.
- Wood pellets
- Propane
- Other
- Specify the other source of energy
OR - Don't know
What size is this clothes dryer?
- Compact (less than 125 litres / 28 gallons capacity)
- Standard (125 litres / 28 gallons capacity or more)
- Don't know
[Do you/Does your household] use the steam setting of this clothes dryer?
- Yes
- No
- Don't know
- Clothes dryer does not have a steam setting
Humidifier: Adds extra moisture to the air.
How many portable humidifiers [do you/does your household] have?
If [you do/your household does] not have any portable humidifiers, enter "0".
- Number
OR - Don't know
Thinking of the [most frequently used] portable humidifier, how often is it used during summer and winter?
a. Summer
- Every day
- A few times a week
- A few times a month
- A few times in the season
- Rarely or never
b. Winter
- Every day
- A few times a week
- A few times a month
- A few times in the season
- Rarely or never
How many built-in humidifiers [do you/does your household] have?
Built-in humidifiers are typically part of a forced air system.
If [you do/your household does] not have any built-in humidifiers, enter "0".
- Number
OR - Don't know
Thinking of the [most frequently used] built-in humidifier, how often is it used during the summer and winter?
a. Summer
- Every day
- A few times a week
- A few times a month
- A few times in the season
- Rarely or never
- System operates automatically
b. Winter
- Every day
- A few times a week
- A few times a month
- A few times in the season
- Rarely or never
- System operates automatically
Dehumidifier: Removes excess moisture from the air.
How many portable dehumidifiers [do you/does your household] have?
If [you do/your household does] not have any portable dehumidifiers, enter "0".
- Number
OR - Don't know
Thinking of the [most frequently used] portable dehumidifier, how often is it used during the summer and winter?
a. Summer
- Every day
- A few times a week
- A few times a month
- A few times in the season
- Rarely or never
b. Winter
- Every day
- A few times a week
- A few times a month
- A few times in the season
- Rarely or never
How many built-in dehumidifiers (excluding devices used only for work purposes) [do you/does your household] have?
Built-in dehumidifiers are typically part of a forced air system.
If [you do/your household does] not have any built-in dehumidifiers, enter "0".
- Number
OR - Don't know
Thinking of the [most frequently used] build-in dehumidifier, how often is it used during the summer and winter?
a. Summer
- Every day
- A few times a week
- A few times a month
- A few times in the season
- Rarely or never
- System operates automatically
b. Winter
- Every day
- A few times a week
- A few times a month
- A few times in the season
- Rarely or never
- System operates automatically
How many ceiling fans are in the dwelling?
If this dwelling does not have ceiling fans, enter "0".
- Number
OR - Don't know
Thinking of the [most frequently used] ceiling fan, does it have lights?
- Yes
- No
- Don't know
How many hours a day is this ceiling fan typically used during the summer?
- Number of hours
OR - Don't know
How many hours a day is this ceiling fan typically used during the winter?
- Number of hours
OR - Don't know
How many air purifiers does the dwelling have?
If this dwelling does not have air purifiers, enter "0".
- Number
OR - Don't know
How many water coolers does the dwelling have?
Exclude water coolers built into a refrigerator and picnic coolers.
If this dwelling does not have water coolers, enter "0".
- Number
OR - Don't know
Electronic devices [– primary dwelling]
Excluding devices used only for work purposes, how many of each of the following electronic devices [do you/does your household] own?
a. Cell phones, including smart phones, for personal use
- Quantity
b. Televisions
- Quantity
c. Devices used with a television
e.g., receiver boxes, video game consoles, Blu-ray, DVD players
- Quantity
d. Sounds systems, including home theatre systems
Include radios, stereos, Bluetooth speakers and Bluetooth headphones.
- Quantity
e. Small portable media devices
e.g., portable gaming devices, iPods, MP3 players
- Quantity
f. Computers or tablets for personal use
Include desktop, laptop, notebook computers, e-readers.
- Quantity
g. Computer monitors for personal use
Exclude tablets, iPads.
- Quantity
h. Printers and scanners for personal use
i. Landline phones with or without cords, VoIP phones
Include the number of handsets.
Exclude cell phones and smart phones.
- Quantity
j. Smart home devices
e.g., Alexa, Google Home, Apple HomePod
- Quantity
k. Network equipment
e.g., modems, routers, Wifi hotspots
- Quantity
Water [– primary dwelling]
The next questions are about the use of water in your dwelling.
What is your dwelling's main source of water?
Is it:
- Water supplied by your city, town or municipality
- Water from a private well
- Water from a surface source
e.g., spring, lake, river or dugout - Other
- Specify other source of water
During the past 12 months, what type of water did [you/your household] primarily use for drinking at home?
Was it:
- Tap water
- Bottled water
Include purchased water in a water cooler, tank or other dispenser.
- Other
- Specify other type of water
During the past 12 months, did [you/your household] occasionally use [bottled water/tap water] for drinking at home?
- Yes
- No
During the past 12 months, did you do any of the following to the main water source?
Select all that apply.
Did you:
- Use a filter or purifier on the main water supply pipe
- Use a filter or purifier on the taps
- Include built-in water dispensers in your refrigerator.
- Use a jug filter
e.g., Brita system - Boil water in order to make it safe for drinking
OR - Did nothing
In the past 12 months, were you informed of a boil water advisory for your area?
- Yes
- No
How many times were you informed of a boil water advisory?
- Number of times
OR - Don't know
What did you do in response to the boil water advisory?
Select all that apply.
Did you:
- Boil your water
- Use bottled water instead of tap water
- Filter your water before drinking it
- Treat your water with chlorine or water purification tablets
- Other
- Specify other action taken
What type of filter or purifier was used on the main water supply pipe?
Select all that apply.
Was it:
- An activated charcoal or carbon filter
- A ceramic filter
- A reverse osmosis system
- An ultraviolet light system
- A distilled water system
- A water softener
- Other
- Specify other type of filter or purifier
[Other than due to a boil water advisory, why/Why] did you treat the main water source?
Select all that apply.
Was it:
- To improve the appearance, taste or odour
- To remove water treatment chemicals such as chlorine
- To soften the water
- To remove metals or minerals other than for hard water problems
- To remove possible bacterial contamination
- Only treated because of the boil water advisory
- The treatment device was already installed or pre-existing
- Other
- Specify other reason for treatment
In the past 12 months, did you have your water tested by a laboratory?
A laboratory is a public or private establishment where the quality of water is tested and analysed.
Exclude home testing kits.
- Yes
- No
Were any problems found?
- Yes
- No
What type of sewer or septic system is your dwelling connected to?
Is it:
- The sewer system of your city, town or municipality
- A private septic system, including holding tanks
- A communal septic system
- Other
- Specify other type of system
When was the last time your septic tank or system was pumped, maintained or inspected?
Was it:
- Within the last year
- 1 year to less than 3 years ago
- 3 years to less than 5 years ago
- 5 or more years ago
- Never
- Don't know
Were there any problems found the last time your septic system was pumped, maintained or inspected?
- Yes
- No
Is your water heater located in your dwelling?
- Yes
- No, it is centralized and shared with other units
- No, it is located outside the dwelling
e.g., in an out-building or shed -
- Specify the outside location of your water heater
- No, it is located somewhere else
- Specify the location of your water heater
- Don't know
Did [you/your household] replace a previous water heater with your current hot water heater?
- Yes
- No
What was the main reason for replacing the hot water heater? Was it:
- Planned or scheduled replacement
- Emergency replacement
- To save energy on water heating
- To change energy sources
e.g., from electricity to natural gas - Other
- Specify the other reason for replacing the water heater
- Don't know
Water — secondary residence
The following questions are about your secondary residence.
What type of sewer or septic system is your secondary dwelling connected to?
Is it:
- The sewer system of your city, town or municipality
- A private septic system with a leaching bed
- Private holding tanks
- A communal septic system
- An outhouse or latrine
- A composting toilet
- An incinerator toilet
- Other
- Specify other type of system
When was the last time the septic tank or system at your secondary dwelling was pumped, maintained or inspected?
Was it:
- Within the last year
- 1 year to less than 3 years ago
- 3 years to less than 5 years ago
- 5 or more years ago
- Never
Were there any problems found the last time the septic system at your secondary dwelling was pumped, maintained or inspected?
- Yes
- No
Water [– primary dwelling]
The next questions are about [your primary dwelling/your dwelling].
Do you have any of the following at [your primary dwelling/your dwelling]?
a. A meter to measure your water use
- Yes
- No
- Don't know
b. A water saving, low-flow showerhead
Low flow showerheads are able to regulate the flow of water. Traditionally they run at a higher pressure than regular flow showerheads.
- Yes
- No
- Don't know
c. A low-volume toilet
Include high efficiency toilets or toilets where the water volume has been modified.
e.g., adding a brick or bottle to the tank
- Yes
- No
- Don't know
d. An in-ground swimming pool
- Yes
- No
- Don't know
e. A permanent above ground swimming pool
Not removed and stored seasonally.
- Yes
- No
- Don't know
f. A temporary above ground swimming pool
Removed and stored seasonally.
- Yes
- No
- Don't know
g. A hot tub
- Yes
- No
- Don't know
h. A sauna
- Yes
- No
- Don't know
Do you have a lawn or an area with grass?
- Yes
- No
Last summer, did [you/anyone in your household] water your lawn?
Include automatic sprinkler and irrigation systems.
- Yes
- No
- Not applicable
No lawn or area with grass last summer.
How was your lawn usually watered?
Select all that apply.
Was it:
- By hand using a watering can or a hose
Include soaker hoses.
- With a stand-alone sprinkler
Exclude a sprinkler system.
- With a sprinkler system
- Other
Was it connected to a timer?
- Yes
- No
Was it connected to a timer?
- Yes
- No
How old is the sprinkler system?
Provide best estimate in years. For systems installed within the last 12 months, enter "0".
- Age in years
Do you have a garden or areas with trees, shrubs, flowers or vegetables on your property?
- Yes
- No
Last summer, did [you/anyone in your household] water these areas?
- Yes
- No
- Not applicable
No garden or areas with trees, shrubs, flowers or vegetables last summer.
How were these areas usually watered?
Select all that apply.
Was it:
- By hand using a watering can or a hose
Include soaker hoses.
- With a stand-alone sprinkler or sprinkler system
- Other
Was the sprinkler or sprinkler system connected to a timer?
- Yes
- No
Do you have a barrel or cistern to collect rain water?
- Yes
- No
Fertilizer and pesticide use [– primary dwelling]
The following questions are about fertilizer and pesticide use.
In the past 12 months, were any chemical fertilizers applied to your [lawn/garden or flowerbed/lawn, garden or flowerbed]?
Chemical fertilizers are chemicals given to plants with the intention of promoting growth. They are usually applied either via the soil or by spraying.
Include chemical fertilizers applied by commercial operators.
- Yes
- No
- Don't know
In the past 12 months, were any organic or natural fertilizers applied to your [lawn/garden or flowerbed/lawn, garden or flowerbed]?
Natural or organic fertilizers can include such items as compost, manure and mulch or products sold at retail establishments labelled as "natural" or "organic".
Include natural or organic fertilizers applied by commercial operators.
- Yes
- No
- Don't know
In the past 12 months, were any chemical pesticides such as weed killers (herbicides), bug killers (insecticides), or fungicides applied to your [lawn/garden or flowerbed/lawn, garden or flowerbed]?
Include fertilizer and herbicide mixes such as "Weed and Feed".
Include chemical pesticides applied by commercial operators.
- Yes
- No
What types of chemical pesticides were applied to your [lawn/garden or flowerbed/lawn, garden or flowerbed]?
Select all that apply.
- Weed killer (herbicides)
- Bug killer (insecticides)
- Fungicide
In the past 12 months, were any organic or natural pesticides applied to your [lawn/garden or flowerbed/lawn, garden or flowerbed]?
Include all natural, organic and barrier methods such as natural sprays, beer traps, and beneficial nemotodes.
Include natural or organic pesticides applied by commercial operators.
- Yes
- No
Recreational vehicles and outdoor equipment [– primary dwelling]
The next questions are about recreational vehicles and outdoor equipment.
[Have you/Has anyone in your household] owned any of the following recreational vehicles in the last 12 months?
Select all that apply.
- All-terrain vehicle (ATV)
- Snowmobile
- Dirt bike or motocross motorcycle
- Personal watercraft
e.g., Jet Ski or Sea-Doo - Motorboat with an inboard or outboard motor
OR - Household does not own any of these recreational vehicles
In the past 12 months, did [you/anyone in your household] use a lawnmower?
- Yes
- No
What type of engine did it have?
If you used more than one lawnmower, select all that apply.
- Gas
- Battery-powered
- Electric
- Manual
e.g., push reel
In the past 12 months, did [you/anyone in your household] use a grass trimmer?
Also known as string trimmer, weed trimmer, whipper snipper or Weed Eater.
- Yes
- No
What type of engine did it have?
If you used more than one grass trimmer, select all that apply.
- Gas
- Battery-powered
- Electric
In the past 12 months, did [you/anyone in your household] use a leaf blower?
- Yes
- No
What type of engine did it have?
If you used more than one leaf blower, select all that apply.
- Gas
- Battery-powered
- Electric
In the past 12 months, did [you/anyone in your household] use a chain saw at home?
- Yes
- No
What type of engine did it have?
If you used more than one chain saw, select all that apply.
- Gas
- Battery-powered
- Electric
In the past 12 months, did [you/anyone in your household] use a snow blower?
- Yes
- No
What type of engine did it have?
If you used more than one snow blower, select all that apply.
- Gas
- Battery-powered
- Electric
Indoor environment [– primary dwelling]
Have you ever heard of radon?
- Yes
- No
Do you consider radon to be a health hazard?
- Yes
- No
- Don't know
There are many substances that have similar characteristics to radon. Which of the following statements best describes radon?
Radon is:
- A gas that comes from natural gas in furnaces and water heaters, and at high levels can cause death
- A gas that comes from the ground and can cause lung cancer
- A gas that comes from carpets, furniture and paints, and can cause irritation in the eyes, nose and throat
- A gas found in air conditioners and refrigerators that can damage the ozone layer
- Don't know
Has your dwelling ever been tested for radon?
- Yes
- No
- Don't know
Was it tested in the last 10 years?
- Yes
- No
- Don't know
Did the results of the test indicate a problem?
- Yes
- No
- Don't know
Have you taken any steps to reduce radon in your home, such as installing a radon reduction system?
e.g., a sub-slab depressurization system
- Yes
- No
- Don't know
Composting [– primary dwelling]
The next questions are about composting.
During the past 12 months, did [you/your household] separate any kitchen waste from the rest of your garbage and put it out for compost collection, take it to a depot or put it in a compost bin or pile?
- Yes
- No
How was your kitchen waste composted?
Select all that apply.
- Collected by your city or private company
- Taken to a depot
- Put in a compost bin, pile or garden
- Other
In the past 12 months, did [you/your household] separate any yard waste such as leaves, plants, or grass clippings from the rest of your garbage and put it out for collection, take it to a depot, or put it in a compost bin or pile, or garden?
- Yes
- No
How was your yard waste composted?
Select all that apply.
- Collected by your city or private company
- Taken to a depot
- Put in a compost bin, pile or garden
- Other
During the past 12 months, did [you/your household] separate any compostable bioplastics from the rest of your garbage and put it out for compost collection, take it to a depot or put it in a compost bin or pile?
Examples include some types of drink cups and take out food packaging. Typically, these items are labelled as compostable.
- Yes
- No
How were your compostable bioplastics composted?
Select all that apply.
- Collected by your city or private company
- Taken to a depot
- Put in a compost bin, pile or garden
- Other
[Do you/Does your household] have access to a municipal composting or organics collection program for [kitchen waste/yard waste/compostable bioplastics/kitchen waste and yard waste/kitchen waste and compostable bioplastics/yard waste and compostable bioplastics/kitchen waste, yard waste, and compostable bioplastics]?
- Yes
- No
- Don't know
Air quality [– primary dwelling]
In the past 12 months, did [you/anyone in your household] burn yard waste on your property?
Include leaves, branches and grass clippings.
- Yes
- No
In the past 12 months, did [you/anyone in your household] burn household waste on your property?
Include all household items that can be burned.
Exclude yard waste and materials generated from the operation of a business.
- Yes
- No
Hazardous waste [– primary dwelling]
The next questions are about the disposal of hazardous products.
In the past 12 months, did [you/anyone in your household] have any leftover or expired medication to dispose of?
- Yes
- No
What did you do with them?
Select all that apply.
- Put them in the garbage
- Took or sent them to a depot or drop off centre
- Returned them to a supplier or retailer, including a pharmacy or doctor
- Poured them down the drain, sewer, toilet, sink, or on the ground
- Still have them
- Other
In the past 12 months, did [you/anyone in your household] have any medical sharps to dispose of?
Include syringes, needles, insulin pens and lancets.
- Yes
- No
What did you do with them?
Select all that apply.
- Put them in the garbage
- Used a medical sharps disposal program
- Returned them to a pharmacy or doctor
- Took or sent them to a depot or drop off centre
- Still have them
- Other
In the past 12 months, did [you/anyone in your household] have any leftover paint or solvents to dispose of?
- Yes
- No
What did you do with them?
Select all that apply.
- Put them in the garbage
- Took or sent them to a depot or drop off centre
- Returned them to a supplier or retailer
- Donated or gave them away
- Still have them
- Other
In the past 12 months, did [you/anyone in your household] have any unwanted engine oil or anti-freeze to dispose of?
- Yes
- No
What did you do with them?
Select all that apply.
- Put them in the garbage
- Took or sent them to a depot or drop off centre
- Returned them to a supplier or retailer
- Still have them
- Other
Excluding car batteries, in the past 12 months, did [you/anyone in your household] have any dead or unwanted batteries to dispose of?
Include general purpose batteries such as AA batteries, cellphone, PDA, laptop computer, hearing aid and watch batteries.
Exclude car, motorcycle, boat (marine) and tractor batteries.
- Yes
- No
What did you do with them?
Select all that apply.
- Put them in the garbage
- Took or sent them to a depot or drop off centre
- Returned them to a supplier or retailer
- Still have them
- Other
In the past 12 months, did [you/anyone in your household] have any leftover pesticides to dispose of?
- Yes
- No
What did you do with them?
Select all that apply.
- Put them in the garbage
- Took or sent them to a depot or drop off centre
- Returned them to a supplier or retailer
- Still have them
- Other
In the past 12 months, did [you/anyone in your household] have any mattresses to dispose of?
- Yes
- No
What did you do with them?
Select all that apply.
- Put them in the garbage
- Took or sent them to a depot or drop off centre
- Returned them to a supplier or retailer
- Donated or gave them away
- Sold them
- Still have them
- Other
In the past 12 months, did [you/anyone in your household] have any textiles to dispose of?
Textiles are composed of natural or synthetic fibers, including any combination of animal-derived material such as wool or silk, plant-derived material such as linen and cotton, and synthetic material such as polyester or nylon.
e.g., towels, shoes, purses, clothing, curtains and carpets
- Yes
- No
What did you do with them?
Select all that apply.
- Put them in the garbage
- Took or sent them to a depot or drop off centre
- Returned them to a supplier or retailer
- Donated or gave them away
- Sold them
- Still have them
- Other
In the past 12 months, which of the following unwanted electronic products did [you/anyone in your household] have to dispose of?
Select all that apply.
- Computers
- Printers or fax machines
- Televisions or computer displays
- Audio-video equipment
Include DVD players, VCRs, speakers, portable digital music players.
- Set-top boxes
e.g., cable TV boxes, PVRs - Electronic gaming equipment
- Wearable electronics
e.g., smart watches, fitness trackers - Cellular phones
- Landline telephones, including cordless phones
Exclude cell phones.
- Microwave ovens
- Small appliances
e.g., coffee makers, kettles, hand mixers, power drills, power saws
OR
- None of the above
What did you do with your unwanted computers?
Select all that apply.
Did you:
- Put them in the garbage
- Take or send them to a depot or drop off centre
- Return them to a supplier or retailer
- Donate or give them away
- Repair them
- Sell them
- Still have them
- Other
Why do you still have your unwanted computers?
Select all that apply.
- They still work
- Waiting for date to bring them at the drop-off centre
- Planning to reuse them
- Planning on selling them
- Planning on giving them away
- Other
OR - Do not know how or where to dispose of them
What did you do with your unwanted printers or fax machines?
Select all that apply.
Did you:
- Put them in the garbage
- Take or send them to a depot or drop off centre
- Return them to a supplier or retailer
- Donate or give them away
- Repair them
- Sell them
- Still have them
- Other
Why do you still have your unwanted printers or fax machines?
Select all that apply.
- They still work
- Waiting for date to bring them at the drop-off centre
- Planning to reuse them
- Planning on selling them
- Planning on giving them away
- Other
OR - Do not know how or where to dispose of them
What did you do with your unwanted televisions or computer displays?
Select all that apply.
Did you:
- Put them in the garbage
- Take or send them to a depot or drop off centre
- Return them to a supplier or retailer
- Donate or give them away
- Repair them
- Sell them
- Still have them
- Other
Why do you still have your unwanted televisions or computer displays?
Select all that apply.
- They still work
- Waiting for date to bring them at the drop-off centre
- Planning to reuse them
- Planning on selling them
- Planning on giving them away
- Other
OR - Do not know how or where to dispose of them
What did you do with your unwanted set-top boxes?
Select all that apply.
Did you:
- Put them in the garbage
- Take or send them to a depot or drop off centre
- Return them to a supplier or retailer
- Donate or give them away
- Repair them
- Sell them
- Still have them
- Other
Why do you still have your unwanted set-top boxes?
Select all that apply.
- They still work
- Waiting for date to bring them at the drop-off centre
- Planning to reuse them
- Planning on selling them
- Planning on giving them away
- Other
OR - Do not know how or where to dispose of them
What did you do with your unwanted audio-video equipment?
Include DVD players, VCRs, speakers, portable digital music players.
Select all that apply.
Did you:
- Put them in the garbage
- Take or send them to a depot or drop off centre
- Return them to a supplier or retailer
- Donate or give them away
- Repair them
- Sell them
- Still have them
- Other
Why do you still have your unwanted audio-video equipment?
Select all that apply.
- They still work
- Waiting for date to bring them at the drop-off centre
- Planning to reuse them
- Planning on selling them
- Planning on giving them away
- Other
OR - Do not know how or where to dispose of them
What did you do with your unwanted electronic gaming equipment?
Select all that apply.
Did you:
- Put them in the garbage
- Take or send them to a depot or drop off centre
- Return them to a supplier or retailer
- Donate or give them away
- Repair them
- Sell them
- Still have them
- Other
Why do you still have your unwanted electronic gaming equipment?
Select all that apply.
- They still work
- Waiting for date to bring them at the drop-off centre
- Planning to reuse them
- Planning on selling them
- Planning on giving them away
- Other
OR - Do not know how or where to dispose of them
What did you do with your unwanted wearable electronics?
e.g., smart watches, fitness trackers
Select all that apply.
Did you:
- Put them in the garbage
- Take or send them to a depot or drop off centre
- Return them to a supplier or retailer
- Donate or give them away
- Repair them
- Sell them
- Still have them
- Other
Why do you still have your unwanted wearable electronics?
Select all that apply.
- They still work
- Waiting for date to bring them at the drop-off centre
- Planning to reuse them
- Planning on selling them
- Planning on giving them away
- Other
OR - Do not know how or where to dispose of them
What did you do with your unwanted cellular phones?
Select all that apply.
Did you:
- Put them in the garbage
- Take or send them to a depot or drop off centre
- Return them to a supplier or retailer
- Donate or give them away
- Repair them
- Sell them
- Still have them
- Other
Why do you still have your unwanted cellular phones?
Select all that apply.
- They still work
- Waiting for date to bring them at the drop-off centre
- Planning to reuse them
- Planning on selling them
- Planning on giving them away
- Other
OR - Do not know how or where to dispose of them
What did you do with your unwanted landline phones, including cordless phones?
Exclude cell phones.
Select all that apply.
Did you:
- Put them in the garbage
- Take or send them to a depot or drop off centre
- Return them to a supplier or retailer
- Donate or give them away
- Repair them
- Sell them
- Still have them
- Other
Why do you still have your unwanted landline phones?
Select all that apply.
- They still work
- Waiting for date to bring them at the drop-off centre
- Planning to reuse them
- Planning on selling them
- Planning on giving them away
- Other
OR - Do not know how or where to dispose of them
What did you do with your unwanted microwave ovens?
Select all that apply.
Did you:
- Put them in the garbage
- Take or send them to a depot or drop off centre
- Return them to a supplier or retailer
- Donate or give them away
- Repair them
- Sell them
- Still have them
- Other
Why do you still have your unwanted microwave ovens?
Select all that apply.
- They still work
- Waiting for date to bring them at the drop-off centre
- Planning to reuse them
- Planning on selling them
- Planning on giving them away
- Other
OR - Do not know how or where to dispose of them
What did you do with your unwanted small appliances?
e.g., coffee makers, kettles, hand mixers, power drills, power saws
Exclude microwave ovens.
Select all that apply.
Did you:
- Put them in the garbage
- Take or send them to a depot or drop off centre
- Return them to a supplier or retailer
- Donate or give them away
- Repair them
- Sell them
- Still have them
- Other
Why do you still have your unwanted small appliances?
Select all that apply.
- They still work
- Waiting for date to bring them at the drop-off centre
- Planning to reuse them
- Planning on selling them
- Planning on giving them away
- Other
OR - Do not know how or where to dispose of them
In the past 12 months, did [you/anyone in your household] have any dead or unwanted compact fluorescent light bulbs to dispose of?
Compact fluorescent lights, also known as corkscrew or spiral light bulbs, are similar to and can replace most incandescent lights. They typically use 75% less energy and can last up to ten times as long as a conventional incandescent light bulb.
Exclude fluorescent tubes.
- Yes
- No
What did you do with them?
Select all that apply.
- Put them in the garbage
- Took or sent them to a depot or drop off centre
- Returned them to a supplier or retailer
- Still have them
- Other
Why do you still have them?
Select all that apply.
- They still work
- Waiting for date to bring them at the drop-off centre
- Planning to reuse them
- Planning on selling them
- Planning on giving them away
- Other
OR - Do not know how or where to dispose of them
In the past 12 months, did [you/anyone in your household] have any dead or unwanted fluorescent tubes to dispose of?
Fluorescent tubes are glass tubes of various lengths whose inner walls are coated with a material that fluoresces when an electrical current causes a vapour within the tube to discharge electrons.
Exclude compact fluorescent lights.
- Yes
- No
What did you do with them?
Select all that apply.
- Put them in the garbage
- Took or sent them to a depot or drop off centre
- Returned them to a supplier or retailer
- Still have them
- Other
Why do you still have them?
Select all that apply.
- They still work
- Waiting for date to bring them at the drop-off centre
- Planning to reuse them
- Planning on selling them
- Planning on giving them away
- Other
OR - Do not know how or where to dispose of them
Interactions with nature
The following questions are about your [household's] interactions with nature.
In the past 12 months, did [you/anyone in your household] grow vegetables, herbs, fruits, flowers or plants for personal use?
- Yes
- No
Where were they grown?
Select all that apply.
- Outside in the yard
- On a balcony, porch or deck
- In a community garden or allotment garden
- Indoors
- In a rooftop garden
- Greenhouse
- Somewhere else
Are there any shrubs or hedges on your property?
- Yes
- No
Are there any trees on your property?
- Yes
- No
In the past 5 years, were any trees planted on your property?
- Yes
- No
- Don't know
In the past 5 years, were any trees cut down or removed on your property?
- Yes
- No
- Don't know
In the past 12 months, did [you/anyone in your household] make any purchases to feed or shelter birds on your property?
- Yes
- No
- Don't know
In which seasons do [you/you or someone in the household] feed birds at home?
Select all that apply.
- Winter
- Spring
- Summer
- Fall
OR - I only feed birds elsewhere
In the past 12 months, did [you/anyone in your household] make any purchases to watch birds, such as binoculars or bird books, or travel for bird watching trips?
- Yes
- No
- Don't know
In the past 12 months, have [you/anyone in your household] observed a bird accidentally crash into a window at your home?
- Yes
- No
- Don't know
How many cats [do/does] [you/your household] own?
If [you do/your household does] not have cats, please enter "0".
- Number of cats
How often [does the cat/do the cats] go outside?
- Daily
- More than once a week
- More than once a month
- A few times a season
- A few times a year
- Never, [it is strictly an indoor cat/they are strictly indoor cats]
In the past 12 months, did [you/your household] participate in any outdoor activities close to your home?
Close to your home means within a 10 minute walk or drive.
Outdoor activities can include individual activities such as walking, running, skiing or picnicking, and team activities such as playing soccer, baseball or football.
- Yes
- No
What type of outdoor activities?
Select all that apply.
- Walking
- Jogging, running, rollerblading, or cross-country running
- Hiking
- Football, soccer, field hockey, basketball, volleyball, baseball, rugby, lacrosse, ultimate (frisbee), or ball or road hockey
- Golfing, croquet, lawn darts, lawn bowling, or bocci
- Boating, sailing, canoeing, kayaking, rafting, rowing, dragonboating, or seadooing
- Swimming, going to the beach, surfing, scuba, or snorkeling
- Bicycling
- ATV
- Skiing, snowboarding, or telemark
- Snowmobiling
- Cross-country skiing or snowshoeing
- Hunting
- Fishing
- Camping
- Picnicking or BBQ
- Skating
- Ice hockey, broomball, or curling
- Bird watching, or photography
- Exercise, tai chi, aerobics, or yoga
- Going to the park or playground
- Mountain climbing
- Tobogganing or sliding
- Geocaching
- Badminton, tennis, or pickleball
- Other
- Specify other outdoor activities
Are there any parks or public greenspaces close to your home?
Close to your home means within a 10 minute walk or drive.
- Yes
- No
- Don't know
In the past 12 months, did [you/anyone in your household] visit these parks or public greenspaces?
- Yes
- No
- Don't know
In the past 12 months, how often did [you/anyone in your household] visit a park that was close to where you live?
- Daily
- More than once a week
- More than once a month
- A few times a season
- A few times a year
- Other
- Specify other
Why did [you/members of your household] visit a park that was close to where you live? Was it:
- To reduce stress
- To improve physical health
- To improve mental health
- To get some fresh air
- To go the playground
- To play sports or exercise
- To attend events or festivals
- To pass through on the way to another destination
- To walk the dog
- Other
- Specify the other reason
Why [did you not visit/did no one in your household visit] a park or public green space close to home?
Select all that apply.
- Inability to get there due to lack of transportation
- Felt unsafe or had concerns about discrimination, harassment or violence
- Personal mobility limitations
- Park or public green space was closed due to pandemic limitations
- Park or public green space was not open when I wanted to visit it
- Preferred to visit another park or public green space that was not close to home
- Other reason
- Specify the other reason
In the past 12 months, did [you/anyone in your household] visit any [other parks/parks] or public greenspaces [that were not close to your home]?
- Yes
- No
- Don't know
In the past 12 months, did [you/anyone in your household] engage, without pay, in activities aimed at conservation or protection of the environment or wildlife?
e.g., picking up litter, planting trees, naturalizing or restoring areas, writing letters to political officials
- Yes
- No
- Don't know
How did [you/your household] participate in these activities?
a. On behalf of a group or an organization
Include activities like beach or park clean-up days, unpaid help provided to schools, religious organizations, sports or community associations.
- Yes
- No
- Don't know
b. Independently, that is, not on behalf of a group or an organization
e.g., picking up litter, writing letters to political officials
- Yes
- No
- Don't know
In the past 12 months, did [you/anyone in your household] participate, without pay, in any of these activities?
a. Cleaning up shorelines, beaches, rivers, lakes or roadsides
- Yes
- No
- Don't know
b. Monitoring or assessing wild species or natural habitats to assist with nature conservation
- Yes
- No
- Don't know
In the past 12 months, did [you/anyone in your household] participate, without pay, in teaching about nature?
Include:
giving guided nature walks
chaperoning school trips to nature centres
leading or assisting indoor courses on nature and the environment.
- Yes
- No
- Don't know
Emergency preparedness
In the past 12 months, has your household been affected by an extreme weather event or natural disaster?
Include events such as flooding, wind storms, tornadoes, wild fires, winter storms, blizzards, hurricanes, extreme smoke, prolonged poor air quality, earthquakes, and similar types of events.
- Yes
- No
- Don't know
Where did you experience this?
If you have been affected by more than one event, report for the most recent event.
- Primary residence
- Secondary residence
- Both primary and secondary residences
- Somewhere else in Canada
- Specify where in Canada
- Somewhere else outside of Canada
- Specify the country
What type of event was it?
Select all that apply.
- Heavy rain
- River flooding
- Storm
- Strong winds
- Winter storm, blizzard, or ice storm
- Extreme cold
- Extreme heat
- Hurricane
- Tornado
- Poor air quality
e.g., smoke or smog - Forest fire, wildfire, or grass fire
- Landslide, avalanche, or sinkhole
- Earthquake
- Other
- Specify the other event
How [were/was] [you/your household] affected by the event?
Select all that apply.
- Lost power for a short period of time (less than 24 hours)
- Lost power for a long period of time (one day or longer)
- Had to throw out food
- Water damage
- Some damage to house
- Complete loss of house
- Poor air quality
- Road closures
e.g., unable to go to the store - Interruption to drinking water
- Property flooded
- Damage to family vehicles
- Household member injured or killed by the event
- Other
- Specify the other impacts
How long did it take to recover from the event?
- Same day
- Days
- Weeks
- Months
- Other
- Still recovering from the event
Did [you/your household] receive an alert for the event?
e.g., telephone notification, alert on radio or television
- Yes
- No
- Don't know
How far in advance did [you/your household] receive the alert?
- Amount of time
- Unit of time
- Minutes
- Hours
- Days
- Weeks
OR - After the event was underway
How [were/was] [you/your household] alerted for the event?
Select all that apply.
- By phone notification
Please include automated phone calls and emergency notifications.
- From the TV
- On the radio
- Social media
- On a sign on the highway while driving
- From a family member or friend
- An app
- A website
- Other
- Specify the other source of information
How would [you/your household] most prefer to receive an alert for an extreme weather event or natural disaster?
- By phone notification
Please include automated phone calls and emergency notifications.
- From the TV
- On the radio
- Social media
- On a sign on the highway while driving
- From a family member or friend
- An app
- A website
- Other
- Specify the other source of information
What steps [have you/has your household] taken to prepare for a natural disaster?
Select all that apply.
- 3-day supply of drinking water
e.g., 72 hours; 2 litres per person per day plus water for pets - Food
- Money
- Medication
- Battery powered radio
- Emergency lights
e.g., flash lights, chemical light sticks - Portable backup generator
- Permanently installed home backup generator
e.g., Generac - Emergency solar PV
Include portable solar panels.
- Other
- Specify other preparations
OR - None of the above
Perception and awareness of risk of flooding
Thinking of [your primary dwelling/your dwelling], how high is the risk to your dwelling from flooding?
- Extremely high – experience flooding multiple times a year
- Very high – experience flooding annually
- Moderately high – experience flooding every 5 years on average
- Low – experience flooding every 20 years on average
- Little or none – property is not on a floodplain, or flooding has not happened in more than 20 years
- Don't know
Transportation Decisions
The next few questions are about transportation decisions for your household.
How long does it take to get to the public transportation system closest to where you live?
- 2 minutes or less
- 3 to 5 minutes
- 6 to 10 minutes
- More than 10 minutes
- Don't know
- There is no public transportation system where I live
In the past 12 months, did [you/anyone in your household] use the public transportation system?
- Yes
- No
- Don't know
Why did [you not use/no one in your household use] the public transportation system?
Select all that apply.
Was it because:
- It was too expensive
- It was too slow
- Scheduling problems
- Service was too infrequent
- The destination was within walking or cycling distance
- Used a car instead of public transit
- Health concerns
e.g., exposure to COVID-19 or flu - Personal safety concerns
- Other
- Specify the other reason
In the past 12 months, how often did [you/anyone in your household] use a bicycle to go to work, school, or to run errands during the summer and winter?
a. Summer
- Daily
- More than once a week
- More than once a month
- A few times a season
- Never
b. Winter
- Daily
- More than once a week
- More than once a month
- A few times a season
- Never
Why did [you not use/no one in your household use] a bicycle to go to work, school or run errands in the last 12 months?
Select all that apply.
- Did not own a bicycle
- Destination was too far away
- Would take too long to ride to destination
- Did not feel safe riding alone
- Would have had to ride at night
- Would have had to ride on roads that have no bike lanes
- Did not feel safe in bike lanes on busy roads
- Nowhere to securely park bicycle at destination
- Nowhere to change or shower at the destination
- Did not have a way to safely carry items while riding
- Could not transport children, parents or other family members by bike
- Weather
e.g., too hot, too cold, too windy, rain, snow - Unable to bicycle due to a physical inability
- Bicycle was broken or needed repairs
- Other
- Specify the other reason
In the past 12 months, how often did [you/anyone in your household] walk, jog, or run to go to work, school, or to run errands during the summer and winter?
a. Summer
- Daily
- More than once a week
- More than once a month
- A few times a season
- Never
b. Winter
- Daily
- More than once a week
- More than once a month
- A few times a season
- Never
Why did [you not/no one in your household] walk, jog, or run to go to work, school or run errands in the last 12 months?
Select all that apply.
- Destination was too far away
- Would take too long to get to destination
- Did not feel safe walking, jogging, or running alone
- Would have had to go at night
- Would have had to go on roads that have no side walks
- Did not feel safe on side walks on busy roads
- Nowhere to change or shower at the destination
- Did not have a way to safely carry items while going to destination
- Could not transport children, parents or other family members while walking, jogging, or running
- Weather
e.g., too hot, too cold, too windy, rain, snow - Unable to walk, jog, or run due to a physical inability
- Other
- Specify the other reason
Purchasing decisions [– primary dwelling]
In the past 12 months, how often did [you/your household] use [your/its] own bags or containers to carry [your/its] groceries?
Include bags usually made of canvas or heavy plastic that can be reused numerous times for groceries.
Exclude plastic disposable bags.
- Always
- Often
- Sometimes
- Rarely
- Never
How many plastic drinking straws are thrown out at home in a typical week?
Include straws brought home with take-out food and straws on juice boxes.
Exclude reusable straws and straws thrown out elsewhere.
Provide your best estimate. Enter a "0" for none.
- Number of drinking straws
How many of these plastic drinking straws are used more than once before being thrown out?
- All
- Most
- Some
- None
When possible, [do/does] [you/anyone in your household] use [your/their] own refillable water bottle instead of buying a bottle of water?
- Always
- Often
- Sometimes
- Rarely
- Never
- Not applicable
How often do [you/members of your household] drink hot drinks outside the home, for example at work, at school or in transportation?
e.g., coffee, tea, herbal tea, hot chocolate
- Every day
- A few times a week
- A few times a months
- A few times a year
- Never
When possible, do [you/members of your household] use a refillable cup or mug instead of buying hot drinks in a disposable cup?
e.g., coffee, tea, herbal tea, hot chocolate
- Always or almost always
- Often
- Sometimes
- Rarely
- Never
In the past 12 months, how often did [you/anyone in your household] use reusable food containers instead of disposable ones?
- Always
- Often
- Sometimes
- Rarely
- Never
In the past 12 months, how often did [you/anyone in your household] purchase reusable personal care products?
e.g., diapers, feminine hygiene products and personal wipes.
- Always
- Often
- Sometimes
- Rarely
- Never
In the past 12 months, how often did [you/anyone in your household] purchase a commodity, such as soap, in bulk to be able to refill a smaller container?
- Always
- Often
- Sometimes
- Rarely
- Never
Why do [you/members of your household] not use the following?
[refillable water bottles]
[refillable cups or mugs]
[reusable food containers]
[reusable personal care products]
[commodity items in bulk]
Select all that apply.
Was it because:
- They are too inconvenient
- They would cost more compared to single-use versions
- They take too much time to clean (if applicable)
- Reusable versions of these items are not available
- They do not want to reuse these types of items
- Items are not applicable
- Some other reason
- Specify the other reason
In the past year, did [you/anyone in your household] make any online purchases?
- Yes
- No
What did you do with the cardboard boxes the items were shipped in?
Select all that apply.
- Recycled the boxes via curbside pickup, depot, or a drop off program
- Reused the boxes to ship or store something else
- Used or repurposed the cardboard for something else
- Put the boxes in the garbage
- Burned the boxes
- Kept the boxes for future use
- Other
- Specify what else you did with the boxes
OR - Made online purchases, but none of the items were shipped in boxes
In the past 12 months, did [you/anyone in your household] use a meal preparation kit?
Include delivery of ingredient boxes with a recipe, e.g., Goodfood, HelloFresh
Exclude delivery from restaurants.
- Yes
- No
In total, how many meal preparation kits were delivered to your household in the past 12 months?
- 1
- 2 to 4
- 5 to 9
- 10 to 19
- 20 or more
What did you do with the boxes?
Would you say:
- Recycled the boxes via curbside pickup, depot, or a drop off program
- Returned the boxes to the supplier
- Put the boxes in the garbage
- Used or repurposed the cardboard for something else
- Burned the boxes
- Other
- Specify what else you did with the boxes
In the past 12 months, how often did [you/anyone in your household] choose products based on the type or amount of packaging?
e.g., choosing a product that has less packaging or recyclable packaging, a product that comes in a reusable container, buying in bulk instead of pre-packaged products
- Always
- Often
- Sometimes
- Rarely
- Never
In the past 12 months, how often did [you/anyone in your household] purchase products labelled as being "environmentally-friendly" or "green" instead of similar products that were not?
- Always
- Often
- Sometimes
- Rarely
- Never
Would you consider repairing or have an electronic item repaired rather than buying a new one?
- Yes
- Maybe
- No
- Don't know
Why would you not attempt to have an electronic item repaired or repair it yourself?
Select all that apply.
- Too costly
- Too inconvenient
- It would take too much time
- The quality of the repair would not be high enough
- The potential environmental benefits do not warrant repairing the item
- The availability of tools or parts makes it impractical to repair the item
- I don't know how to repair the item
- I don't know where to obtain the parts or tools needed to repair the item
- I would prefer to have a new item
- Other
- Specify the other reason
Would you consider repairing or having a small appliance, such as a coffee maker, blender, or power tool, repaired rather than buying a new one?
- Yes
- Maybe
- No
- Don't know
Why would you not attempt to have a small appliance, such as a coffee maker, blender, or power tool, repaired or repair it yourself?
Select all that apply.
- Too costly
- Too inconvenient
- It would take too much time
- The quality of the repair would not be high enough
- The potential environmental benefits do not warrant repairing the item
- The availability of tools or parts makes it impractical to repair the item
- I don't know how to repair the item
- I don't know where to obtain the parts or tools needed to repair the item
- I would prefer to have a new item
- Other
- Specify the other reason
Would you consider repairing or having a large appliance, such as a stove, refrigerator, washing machine, or clothes dryer, repaired rather than buying a new one?
- Yes
- Maybe
- No
- Don't know
Why would you not attempt to have a large appliance, such as a stove, refrigerator, washing machine, or clothes dryer, repaired or repair it yourself?
Select all that apply.
- Too costly
- Too inconvenient
- It would take too much time
- The quality of the repair would not be high enough
- The potential environmental benefits do not warrant repairing the item
- The availability of tools or parts makes it impractical to repair the item
- I don't know how to repair the item
- I don't know where to obtain the parts or tools needed to repair the item
- I would prefer to have a new item
- Other
- Specify the other reason
Would you consider buying a refurbished or reconditioned product instead of buying a new item?
- Yes
- Maybe
- No
- Don't know
Why would you not buy a refurbished or reconditioned product?
Select all that apply.
- Too costly
- Too inconvenient
- It takes too much time to find such an item
- Lower quality
- Concerns about warranty or after sales support
- The potential environmental benefits do not warrant it
- Lack of availability or selection
- Do not know where to find them
- Do not have the skills or tools to repair it
- I would prefer to have a new item
- Other
- Specify the other reason
Would you consider buying a product that is easily repairable even if it was more expensive?
Easily repairable either by yourself or repair shop.
- Yes
- Maybe
- No
- Don't know
Why would you not buy an easily repairable product?
Select all that apply.
- Too costly
- Too inconvenient
- It takes too much time to find such an item
- Lower quality
- The potential environmental benefits do not warrant it
- Lack of availability or selection
- Do not know where to find them
- Do not have the skills or tools to repair it
- I would prefer to have a new item
- Other
- Specify the other reason
Would you consider buying a product with a longer life span even if it is more expensive?
- Yes
- No
- Don't know
Why would you not buy a product with a longer life span?
Select all that apply.
- Concerns about quality of the product
- The potential environmental benefits do not warrant the increased price
- Lack of availability or selection
- Do not know where to find them
- The price is too high compared to similar items with lower life spans
- Other
- Specify the other reason
Did [you/anyone in your household] make use of a vehicle sharing program in the past 12 months?
Vehicle sharing is a vehicle rental service that allows people to use vehicles for short periods of time, often by the hour.
Please include services such as Communauto, Vrtucar, Zipcar, Autonomik, Carshare Cooperatives and Modo.
Please exclude services such as Uber and Lyft that use a driver.
- Yes
- No
Why did [you/anyone in your household] use a vehicle sharing program?
- In place of owning any vehicles
- To occasionally supplement the number of vehicles owned by household members
- Because [you do/you or someone in the household does] not otherwise have access to a vehicle
- Other
- Specify other
How many of the following types of vehicles were owned by [you/all members in your household] in the past year?
Type of vehicle
a. Gasoline or diesel vehicle
Exclude vehicles used exclusively for work purposes.
- Number of vehicles
b. Non plug-in hybrid vehicle
Cannot be charged by plugging into an outlet or charging station
Has both a gasoline engine and an electric motor
Uses energy recovered from braking to recharge its battery.
- Number of vehicles
c. Plug-in hybrid vehicle
Must be charged by plugging into an outlet or charging station
Has both a gasoline engine and an electric motor.
- Number of vehicles
d. Pure electric vehicle (zero emission vehicle)
Has only an electric motor
- Number of vehicles
In the past 12 months, how far was [the/the most frequently used] pure electric vehicle (zero emission vehicle) driven?
Exclude commercial use.
- Unit of measure
- Kilometres
- Miles
- Distance
OR - Don't know
Please indicate the types and number of charging stations at your home.
Type
a. Level 1
Uses 120V, 200 kilometres in 20 hours.
- Number of charging stations
b. Level 2
Uses 240V, 30 kilometres in 1 hour.
- Number of charging stations
In the past 12 months, what percentage of the time [was/were] the pure electric [vehicle/vehicles] (zero emission vehicle) charged at the following locations:
Percentage of time that it was charged at the location
a. At home, using the dwelling's power
- Percentage
b. At work
- Percentage
c. At a publicly-accessible charging station
- Percentage
d. Other location
- Specify the other location
- Percentage
When do you expect to purchase your next vehicle?
- In less than 6 months
- In 6 months or more, but less than 1 year
- In 1 year or more, but less than 2 years
- In 2 years or more, but less than 3 years
- In 3 years or more, but less than 4 years
- No vehicle purchase expected in the next 4 years
- Uncertain
On a scale of 0 to 5, where 0 means "definitely not" and 5 means "almost certain", how likely is it that your next vehicle purchase will be a:
a. Gasoline or diesel vehicle
Exclude vehicles used exclusively for work purposes.
- 0 Definitely not
- 1
- 2
- 3
- 4
- 5 Almost Certain
b. Non plug-in hybrid vehicle
Cannot be charged by plugging into an outlet or charging station
Has both a gasoline engine and an electric motor
Uses energy recovered from braking to recharge its battery.
- 0 Definitely not
- 1
- 2
- 3
- 4
- 5 Almost Certain
c. Plug-in hybrid vehicle
Must be charged by plugging into an outlet or charging station
Has both a gasoline engine and an electric motor.
- 0 Definitely not
- 1
- 2
- 3
- 4
- 5 Almost Certain
d. Pure electric vehicle (zero emission vehicle)
Has only an electric motor
- 0 Definitely not
- 1
- 2
- 3
- 4
- 5 Almost Certain
In the past 12 months, did [you/anyone in your household] make use of any of the following services?
a. Tool lending libraries
Tool lending libraries allow members to borrow tools, similar to borrowing a book from a library, to avoid purchasing tools that may only be needed occasionally or may be expensive.
- Yes
- No
- Don't Know
b. Shared workshops
e.g., wood working shops, metal working shops, maker spaces
- Yes
- No
- Don't Know
c. Shared bicycle repair space
- Yes
- No
- Don't Know
d. Shared garages to maintain a vehicle
- Yes
- No
- Don't Know
e. Shared studios
e.g., art studios, photographic studios
- Yes
- No
- Don't Know
f. Shared office space
Exclude employer-provided shared offices.
- Yes
- No
- Don't Know
Total household income
Now a question about total household income.
What is your best estimate of the total household income received by all household members, from all sources, before taxes and deductions, during the year ending December 31, [2023]?
Income can come from various sources such as from work, investments, pensions or government. Examples include Employment Insurance, social assistance, child benefits and other income such as child support, spousal support (alimony) and rental income.
Capital gains should not be included in the household income.
- Rounded to the nearest CAN$
OR - Don't know
What was the total household income during the year ending December 31, [2023]?
Include income received by all household members, from all sources, before taxes and deductions.
Was it:
- Less than $50,000, including income loss
- $50,000 and more
- Don't know
Was it:
- Less than $5,000
- $5,000 to less than $10,000
- $10,000 to less than $15,000
- $15,000 to less than $20,000
- $20,000 to less than $30,000
- $30,000 to less than $40,000
- $40,000 to less than $50,000
- Don't know
Was it:
- $50,000 to less than $60,000
- $60,000 to less than $70,000
- $70,000 to less than $80,000
- $80,000 to less than $90,000
- $90,000 to less than $100,000
- $100,000 to less than $150,000
- $150,000 and over
- Don't know