Wholesale Trade Survey (monthly): CVs for Total sales by geography – August 2021

Wholesale Trade Survey (monthly): CVs for Total sales by geography – August 2021
Geography Month
202008 202009 202010 202011 202012 202101 202102 202103 202104 202105 202106 202107 202108
percentage
Canada 0.7 0.7 0.5 0.6 0.8 0.8 0.7 0.6 0.7 0.9 0.8 0.6 0.6
Newfoundland and Labrador 0.4 0.4 0.4 0.4 0.4 0.6 0.5 0.2 1.2 2.3 0.3 0.3 0.4
Prince Edward Island 0.0 0.0 0.0 0.0 0.0 0.0 0.0 0.0 0.0 0.0 0.0 0.0 0.0
Nova Scotia 1.9 1.7 2.7 3.4 6.3 1.8 1.7 2.6 4.8 8.1 3.0 2.3 2.6
New Brunswick 3.6 3.5 2.9 5.0 3.5 3.4 2.6 1.1 1.1 1.9 3.4 2.1 2.1
Quebec 2.3 1.9 1.5 1.4 1.7 1.8 1.8 1.9 1.8 3.1 2.9 1.6 1.7
Ontario 0.9 1.0 0.8 0.9 1.3 1.2 1.1 0.9 1.1 1.2 0.9 0.8 1.0
Manitoba 1.8 2.8 1.7 1.4 2.5 1.7 2.4 1.8 2.8 5.3 1.7 0.8 1.1
Saskatchewan 1.4 0.7 0.9 0.9 1.0 1.0 1.6 1.2 0.8 0.7 0.8 0.5 1.3
Alberta 1.9 3.4 1.3 1.3 1.7 1.0 1.2 1.1 1.2 1.4 1.2 1.5 1.1
British Columbia 1.9 1.8 1.4 1.5 1.4 1.5 1.4 1.5 1.3 1.4 1.4 1.5 1.4
Yukon Territory 0.0 0.0 0.0 0.0 0.0 0.0 0.0 0.0 0.0 0.0 0.0 0.0 0.0
Northwest Territories 0.0 0.0 0.0 0.0 0.0 0.0 0.0 0.0 0.0 0.0 0.0 0.0 0.0
Nunavut 0.0 0.0 0.0 0.0 0.0 0.0 0.0 0.0 0.0 0.0 0.0 0.0 0.0

Microsoft 365 - Privacy Impact Assessment Summary

Introduction

Microsoft 365 is an enterprise-level, cloud-based version of the Microsoft office productivity tools for creating documents, presentations, and spreadsheets, for internal communications, for managing emails, for work planning, and for other common administrative tasks. This integrated suite of tools supports the daily activities of Statistics Canada's employees, including collaboration within the organization.

Objective

A privacy impact assessment (PIA) for Microsoft 365 (M365) was conducted to determine if there were any privacy, confidentiality or security issues with this product and, if so, to make recommendations for their resolution or mitigation.

Description

Microsoft 365 will replace the Microsoft Office suite (e.g., Word, Excel, PowerPoint) and the current email system. It also provides other applications and products (e.g., Planner, Power Apps) that will help staff work effectively.

Risk Area Identification and Categorization

The PIA identifies the level of potential risk (level 1 is the lowest level of potential risk and level 4 is the highest) associated with the following risk areas:

a) Type of program or activity

Administration of program or activity and services.

Risk scale: 2

b) Type of personal information involved and context

Personal information may include an individual's Social Insurance Number, medical, financial or other sensitive personal information, context surrounding personal information that is sensitive, personal information of minors or of legally incompetent individuals or involving a representative acting on behalf of the individual.

Risk scale: 3

c) Program or activity partners and private sector involvement

Private sector organizations, international organizations or foreign governments.

Risk scale: 4

d) Duration of the program or activity

Long-term program or activity (ongoing).

Risk scale: 3

e) Program population

The program's use of personal information for internal administrative purposes affects all employees.

Risk scale: 2

f) Personal information transmission

The personal information is transmitted using wireless technologies.

Risk scale:4

g) Technology and privacy

M365 includes updated and new office productivity applications and software tools that will support the creation, use, and storage of personal information by employees as part of their day-to-day work.

h) Potential risk that in the event of a privacy breach, there will be an impact on the individual or employee

There is a risk that a privacy breach could impact an individual. Depending on the type of information disclosed, the impact could include financial harm, harm to reputation, personal embarrassment or inconvenience.

The overall risk of a privacy breach is low because of system controls and procedures in place.

i) Potential risk that in the event of a privacy breach, there will be an impact on the institution

There is a risk that a privacy breach could impact Statistics Canada. Depending on the type of information disclosed, the impact could include harm to reputation, loss of confidence by employees in the security of this tool, and inconvenience. The overall risk of a privacy breach is low because of system controls and procedures in place.

Conclusion

This assessment of Microsoft 365 did not identify any privacy risks that cannot be managed using existing safeguards.

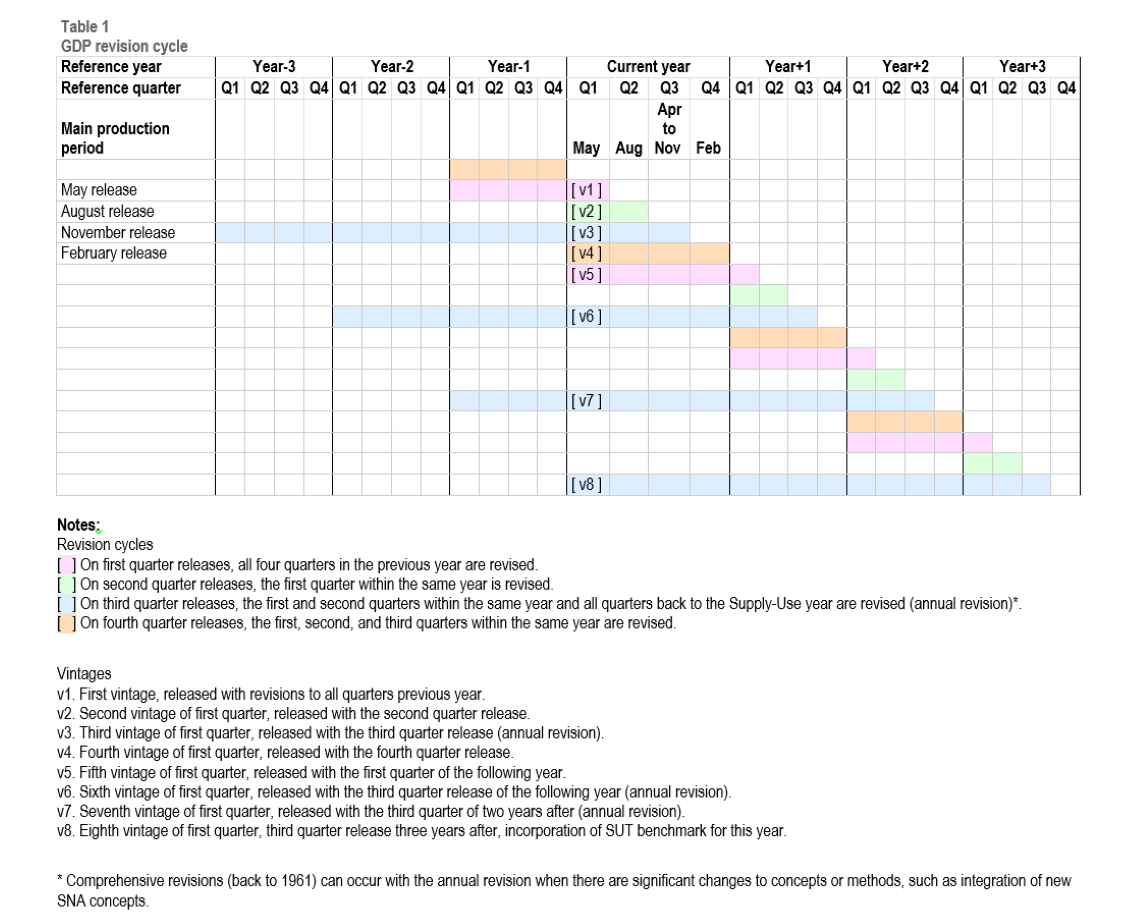
GDP revision cycle

The GDP revisions cycle is a set cycle year-to-year. Revisions occur to previously released quarters based on the reference period open with each release:

  • a first quarter release includes revisions to all quarters of the previous year;
  • a second quarter release includes revisions to only the first quarter of the same year;
  • a third quarter release is the annual revision* and includes revisions to all quarters back three years (due to incorporation of Supply-Use Table);
    * Comprehensive revisions (back to 1961) can occur with the annual revision when there are significant changes to concepts or methods, such as integration of new SNA concepts; and
  • a fourth quarter release includes revisions to all quarters of the same year.
Table 1: GDP revision cycle
Description - Table 1

The GDP revisions cycle is a set cycle year-to-year. Revisions occur to previously released quarters based on the reference period open with each release. For the first quarter of GDP by income and by expenditure, the release includes revisions to all quarters of the previous year; a second quarter release includes revisions to only the first quarter of the same year; a third quarter release is the annual revision and includes revisions to all quarters back three years (due to incorporation of the Supply-Use Table (SUT) for three years prior); and a fourth quarter release includes revisions to all quarters of the same year.

Comprehensive revisions (quarterly, back to 1961) can occur with the annual revision when there are significant changes to concepts or methods, such as integration of new System of National Accounts concepts.

The table illustrates the main production period for each quarter, the corresponding reference quarter/year and the release date. Using the first quarter of a year as an example: the first vintage of those estimates is released in May of the same reference year with revisions to all quarters previous year. The second vintage of the first quarter is released in August with the second quarter release. The third vintage of the first quarter is released with the third quarter release (annual revision) in November. The fourth vintage of the first quarter is released in February of the following year with the fourth quarter release. The fifth vintage of the first quarter is released in May with the first quarter of the following year. The sixth vintage of the first quarter is released with the third quarter release of the following year (annual revision) in November. The seventh vintage of the first quarter is released with the third quarter of two years after (annual revision) in November. The eighth vintage of the first quarter and the last revision vintage (excluding comprehensive revisions) is released in November with the third quarter release three years after, and reflects the incorporation of the SUT benchmark for that year.

Have your say

We want to hear from you. When you take the time to respond to surveys, participate in consultations, or provide us with feedback, you are helping us serve you better. Better data lead to better outcomes for all the people of Canada. Have your say today!

Consulting Canadians

Check out our Consulting Canadians page to see the various ways we seek input on new programs, initiatives, website features, and more.

Data service centres

We want to expand and strengthen our partnerships, which is why we put you, the data user, at the centre of our activities to enhance access, awareness and ease of use of the agency’s data and services via our Data service centres.

Monthly Survey of Manufacturing: National Weighted Rates by Source and Characteristic - August 2021

National Weighted Rates by Source and Characteristic, August 2021
Table summary
The information is grouped by Sales of goods manufactured, Raw materials and components, Goods / work in process, Finished goods manufactured, Unfilled Orders, Capacity utilization rates (appearing as row headers), and Data source as the first row of column headers, then Response or edited, and Imputed as the second row of column headers, calculated by percentage.
  Data source
Response or edited Imputed
%
Sales of goods manufactured 86.3 13.7
Raw materials and components 74.9 25.1
Goods / work in process 79.0 21.0
Finished goods manufactured 68.8 31.2
Unfilled Orders 76.3 23.7
Capacity utilization rates 69.6 30.4

Monthly Survey of Manufacturing: National Level CVs by Characteristic – August 2021

National Level CVs by Characteristic
Table summary
This table displays the results of Monthly Survey of Manufacturing: National Level CVs by Characteristic. The information is grouped by Month from August 2020 to August 2021 (appearing as row headers), and Sales of goods manufactured, Raw materials and components inventories, Goods / work in process inventories, Finished goods manufactured inventories and Unfilled Orders, calculated in percentage (appearing as column headers).
Month Sales of goods manufactured Raw materials and components inventories Goods / work in process inventories Finished goods manufactured inventories Unfilled Orders
%
August 2020 0.65 1.04 1.23 1.50 1.15
September 2020 0.67 1.02 1.18 1.55 1.15
October 2020 0.68 0.99 1.31 1.56 1.11
November 2020 0.68 1.05 1.21 1.48 1.16
December 2020 0.69 1.02 1.20 1.46 1.30
January 2021 0.80 1.00 1.24 1.59 1.42
February 2021 0.75 0.99 1.50 1.67 1.30
March 2021 0.71 1.01 1.45 1.69 1.35
April 2021 0.78 1.04 1.56 1.74 1.53
May 2021 0.79 1.04 1.48 1.58 1.45
June 2021 0.72 1.03 1.44 1.69 1.35
July 2021 0.76 1.06 1.48 1.67 1.37
August 2021 0.72 1.07 1.53 1.83 1.46

Employment services: CVs for operating revenue - 2020

Employment services: CVs for operating revenue - 2020
Table summary
This table displays the results of Employment services: CVs for operating revenue - 2020. The information is grouped by Geography (appearing as row headers), and percentage (appearing as column headers).
Geography CVs for operating revenue
percent
Canada 0.00
Newfoundland and Labrador 0.00
Prince Edward Island 0.00
Nova Scotia 0.00
New Brunswick 0.00
Quebec 0.01
Ontario 0.01
Manitoba 0.00
Saskatchewan 0.00
Alberta 0.00
British Columbia 0.01
Yukon 0.03
Northwest Territories 0.00
Nunavut 0.00

Retail Commodity Survey: CVs for Total Sales July 2021

Retail Commodity Survey: CVs for Total Sales July 2021
Table summary
This table displays the results of Retail Commodity Survey: CVs for Total Sales (July 2021). The information is grouped by NAPCS-CANADA (appearing as row headers), and Month (appearing as column headers).
NAPCS-CANADA Month
202104 202105 202106 202107
Total commodities, retail trade commissions and miscellaneous services 0.63 0.76 0.63 0.66
Retail Services (except commissions) [561] 0.63 0.75 0.62 0.65
Food at retail [56111] 0.65 0.64 0.58 0.60
Soft drinks and alcoholic beverages, at retail [56112] 0.56 0.63 0.65 0.64
Cannabis products, at retail [56113] 0.00 0.00 0.00 0.00
Clothing at retail [56121] 1.75 1.77 1.41 1.04
Footwear at retail [56122] 1.81 2.22 1.83 1.61
Jewellery and watches, luggage and briefcases, at retail [56123] 6.63 8.17 6.36 5.28
Home furniture, furnishings, housewares, appliances and electronics, at retail [56131] 0.81 0.62 0.70 0.59
Sporting and leisure products (except publications, audio and video recordings, and game software), at retail [56141] 3.06 3.51 2.79 2.07
Publications at retail [56142] 7.33 6.41 8.68 7.60
Audio and video recordings, and game software, at retail [56143] 4.17 4.57 3.21 2.47
Motor vehicles at retail [56151] 1.96 2.68 2.24 2.55
Recreational vehicles at retail [56152] 4.42 5.75 2.54 2.58
Motor vehicle parts, accessories and supplies, at retail [56153] 1.92 2.03 1.78 1.85
Automotive and household fuels, at retail [56161] 2.45 1.84 1.59 1.61
Home health products at retail [56171] 2.33 2.73 2.68 2.63
Infant care, personal and beauty products, at retail [56172] 2.18 1.98 2.03 2.09
Hardware, tools, renovation and lawn and garden products, at retail [56181] 1.87 1.94 2.02 1.68
Miscellaneous products at retail [56191] 2.94 3.18 3.21 3.17
Total retail trade commissions and miscellaneous services Footnote 1 1.74 2.08 2.04 1.58

Footnotes

Footnote 1

1. Comprises the following North American Product Classification System (NAPCS): 51411, 51412, 53112, 56211, 57111, 58111, 58121, 58122, 58131, 58141, 72332, 833111, 841, 85131 and 851511.

Return to footnote 1 referrer

Retail Commodity Survey: CVs for Total Sales (Second Quarter 2021)

Retail Commodity Survey: CVs for total sales (second quarter 2021)
Table summary
This table displays the results of Retail Commodity Survey: CVs for total sales (second quarter 2021). The information is grouped by NAPCS-CANADA (appearing as row headers), and Quarter (appearing as column headers).
NAPCS-CANADA Quarter
2020Q2 2020Q3 2020Q4 2021Q1 2021Q2
Total commodities, retail trade commissions and miscellaneous services 0.53 0.61 0.54 0.67 0.54
Retail Services (except commissions) [561] 0.53 0.60 0.53 0.66 0.54
Food at retail [56111] 0.69 0.66 0.71 1.16 0.63
Soft drinks and alcoholic beverages, at retail [56112] 0.48 0.52 0.58 0.61 0.60
Cannabis products, at retail [56113] 0.00 0.00 0.00 0.00 0.00
Clothing at retail [56121] 1.35 0.80 1.00 0.98 1.36
Footwear at retail [56122] 2.87 1.93 1.76 1.98 1.95
Jewellery and watches, luggage and briefcases, at retail [56123] 18.57 9.67 2.02 2.53 6.65
Home furniture, furnishings, housewares, appliances and electronics, at retail [56131] 0.57 0.55 0.56 0.58 0.63
Sporting and leisure products (except publications, audio and video recordings, and game software), at retail [56141] 1.98 3.23 2.19 1.70 2.45
Publications at retail [56142] 9.43 7.47 6.14 6.31 8.46
Audio and video recordings, and game software, at retail [56143] 3.27 5.69 5.95 4.61 3.81
Motor vehicles at retail [56151] 2.03 2.18 1.91 2.45 1.76
Recreational vehicles at retail [56152] 4.20 2.68 5.37 3.94 2.25
Motor vehicle parts, accessories and supplies, at retail [56153] 1.40 1.57 1.31 1.95 1.54
Automotive and household fuels, at retail [56161] 2.94 2.23 2.04 2.48 1.70
Home health products at retail [56171] 2.70 2.62 3.36 3.05 2.70
Infant care, personal and beauty products, at retail [56172] 2.82 2.12 2.76 2.97 1.93
Hardware, tools, renovation and lawn and garden products, at retail [56181] 1.84 1.46 1.14 1.52 1.83
Miscellaneous products at retail [56191] 2.69 2.34 2.36 1.99 3.23
Total retail trade commissions and miscellaneous services Footnotes 1 1.54 1.71 1.65 1.58 1.57

Footnotes

Footnote 1

Comprises the following North American Product Classification System (NAPCS): 51411, 51412, 53112, 56211, 57111, 58111, 58121, 58122, 58131, 58141, 72332, 833111, 841, 85131 and 851511.

Return to footnote 1 referrer

Results at a glance

Results at a glance
  Total actual spending for 2020–21 Total actual full-time equivalents for 2020–21
Total gross expenditures 666,463,788 6,099
Respendable revenues -123,989,068 -1,340
Total net expenditures 542,474,720 4,759

In 2020–21, Statistics Canada made significant investments in modernizing its operations and developing the resourcefulness of its employees, enabling the agency to rapidly adapt to sudden changes in priorities during the COVID-19 pandemic. The demand for relevant and trustworthy data was never more urgent and essential to fulfill, both in helping Canadians respond to the crisis and in charting a path towards an inclusive and sustainable recovery.

Results of Statistics Canada’s pan-Canadian partnerships for pandemic response

  • Measured the supply and demand of personal protective equipment to help public health officials better manage the nation’s inventory.
  • Mobilized Statistics Canada’s expert interviewers to make the equivalent of 1.2 million 15-minute calls to support COVID-19 contact tracing operations across the country.
  • Developed the first-ever nationally representative survey to measure the levels of immunity among Canadians against the virus that causes COVID-19.
  • Assessed the extent of COVID-19 infection rates across Canada and established models to identify COVID-19 geographical hotspots, which have helped public health officials with pandemic response and vaccine rollout.
  • Provided Canadian researchers with secure digital access to timely, high-quality microdata, which have improved public understanding of the economic impact of public health measures during the pandemic.

Providing user-centric services

Statistics Canada provides timely, high-quality data to Canadians. During the COVID-19 pandemic, which dominated its agenda in 2020–21, the agency developed the following new methods and technology-based solutions:

  • In April 2020, Statistics Canada pivoted to provide Canadians with crucial data about the impacts of the pandemic on employment, health, safety, business closures, consumption trends, immigration levels, interest rates and housing prices and provided evidence of the unequal impacts of the pandemic on diverse populations.
  • As the pandemic disrupted Canadians’ way of life, municipalities requested more granular data to support local decision making. Building on the results of a pilot project with the City of Vancouver, Statistics Canada has established a partnership with the Federation of Canadian Municipalities to produce more data broken down to the community level.

Developing leading-edge methods of data collection and integration

In 2020–21, Statistics Canada continued to invest in leading-edge methods of data collection, which included integrating more alternative data sources that went beyond the agency’s traditional survey-first approach. The methods below have reduced the time and effort required of Canadians to fill out surveys and have created opportunities to incorporate richer datasets into the agency’s products:

  • Canadians had access to timely and relevant survey findings provided using innovative data collection methods such as crowdsourcing, which enabled Statistics Canada to publish its first-ever study of how Canadians experienced discrimination during the pandemic.
  • Statistics Canada’s investments in data science and machine learning resulted in the development of artificial intelligence tools to help the Public Health Agency of Canada’s response to COVID-19. These tools enabled the development of data models aimed at helping to reduce transmission of the virus that causes COVID-19 and to evaluate the impact of public health measures to determine the extent to which these measures should be eased to allow businesses and schools to reopen and social gatherings to resume.

Building statistical capacity and leadership

Statistics Canada is a leader in fostering data literacy and numeracy. In the middle of a pandemic, the agency continued to lead a whole-of-government approach by using data as a strategic asset to better serve Canadians, which included improving the data analysis skills of Government of Canada employees.

  • The Data Science Network for the Federal Public Service was launched in 2020 with the goal of establishing a strategy to enable data science expertise to be shared across all orders of government and beyond.
  • As part of the Government of Canada’s efforts to address gender gaps and systemic racism, Statistics Canada’s Centre for Gender, Diversity and Inclusion Statistics gave more than 20 presentations on a diverse range of topics aimed at bringing fairness and inclusion to decisions that affect all the people in Canada.

Sharing and collaborating

Collaboration enabled Canadians to share data and use them to make evidence-based decisions about effective pandemic response.

  • In partnership with Health Canada, the Public Health Agency of Canada and other organizations, Statistics Canada developed a dashboard to track the supply and demand of personal protective equipment, forecast ventilator capacity, and automate the national COVID-19 vaccine supply tracker.
  • The agency’s interviewers, who are specially trained to conduct high-volume survey-based interviews, were mobilized to provide surge capacity in contact tracing for the provinces and territories. By March 31, 2021, they had made the equivalent of 1.2 million 15-minute calls for contact tracing, conducting everything from daily health check-ins with Canadians to in-depth case investigations, while still juggling their ongoing survey collection duties.
  • Together with the Canadian Chamber of Commerce, the country’s largest business group, Statistics Canada launched the Canadian Survey on Business Conditions within weeks of the pandemic’s first wave. The goal of this survey was to track the impact of the nationwide economic shutdown on the nation’s firms. The results of this survey were vital in providing the Government of Canada with the information it needed to design and implement emergency income-support programs that met the urgent needs of the moment.

Designing a modern and flexible workplace

When the COVID-19 pandemic hit Canada, Statistics Canada’s employees quickly adapted to deliver timely and accurate data and insights in a rapidly changing environment.

  • Statistics Canada led the Government of Canada in adopting cloud-based computing solutions during the pandemic to address the urgent need for advanced technology solutions in a digital and data-driven world.

For more information on Statistics Canada’s plans, priorities and results achieved, see the “Results: what we achieved” section of this report.