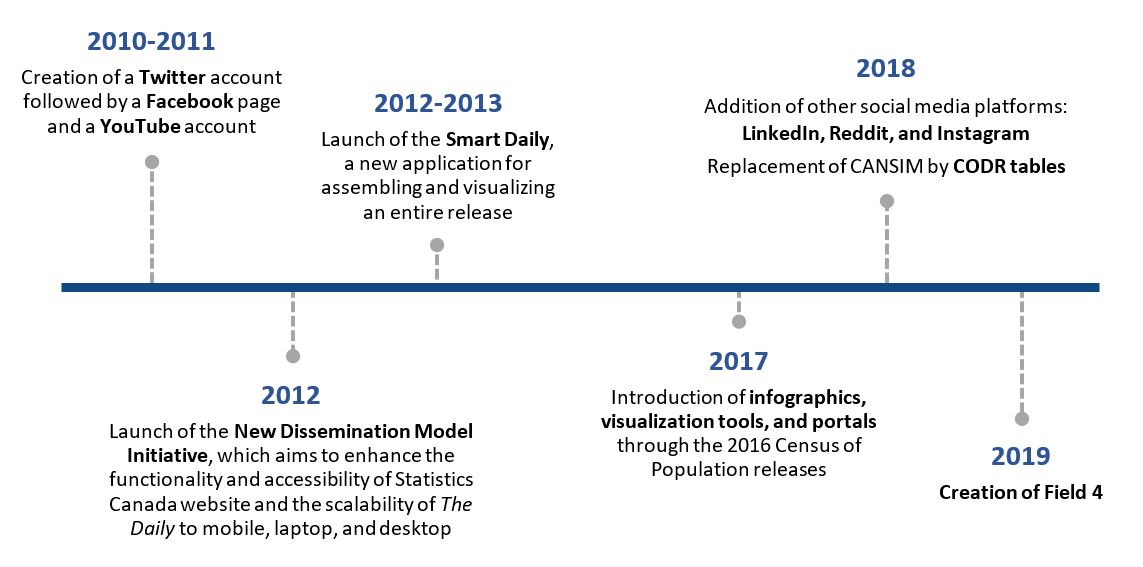
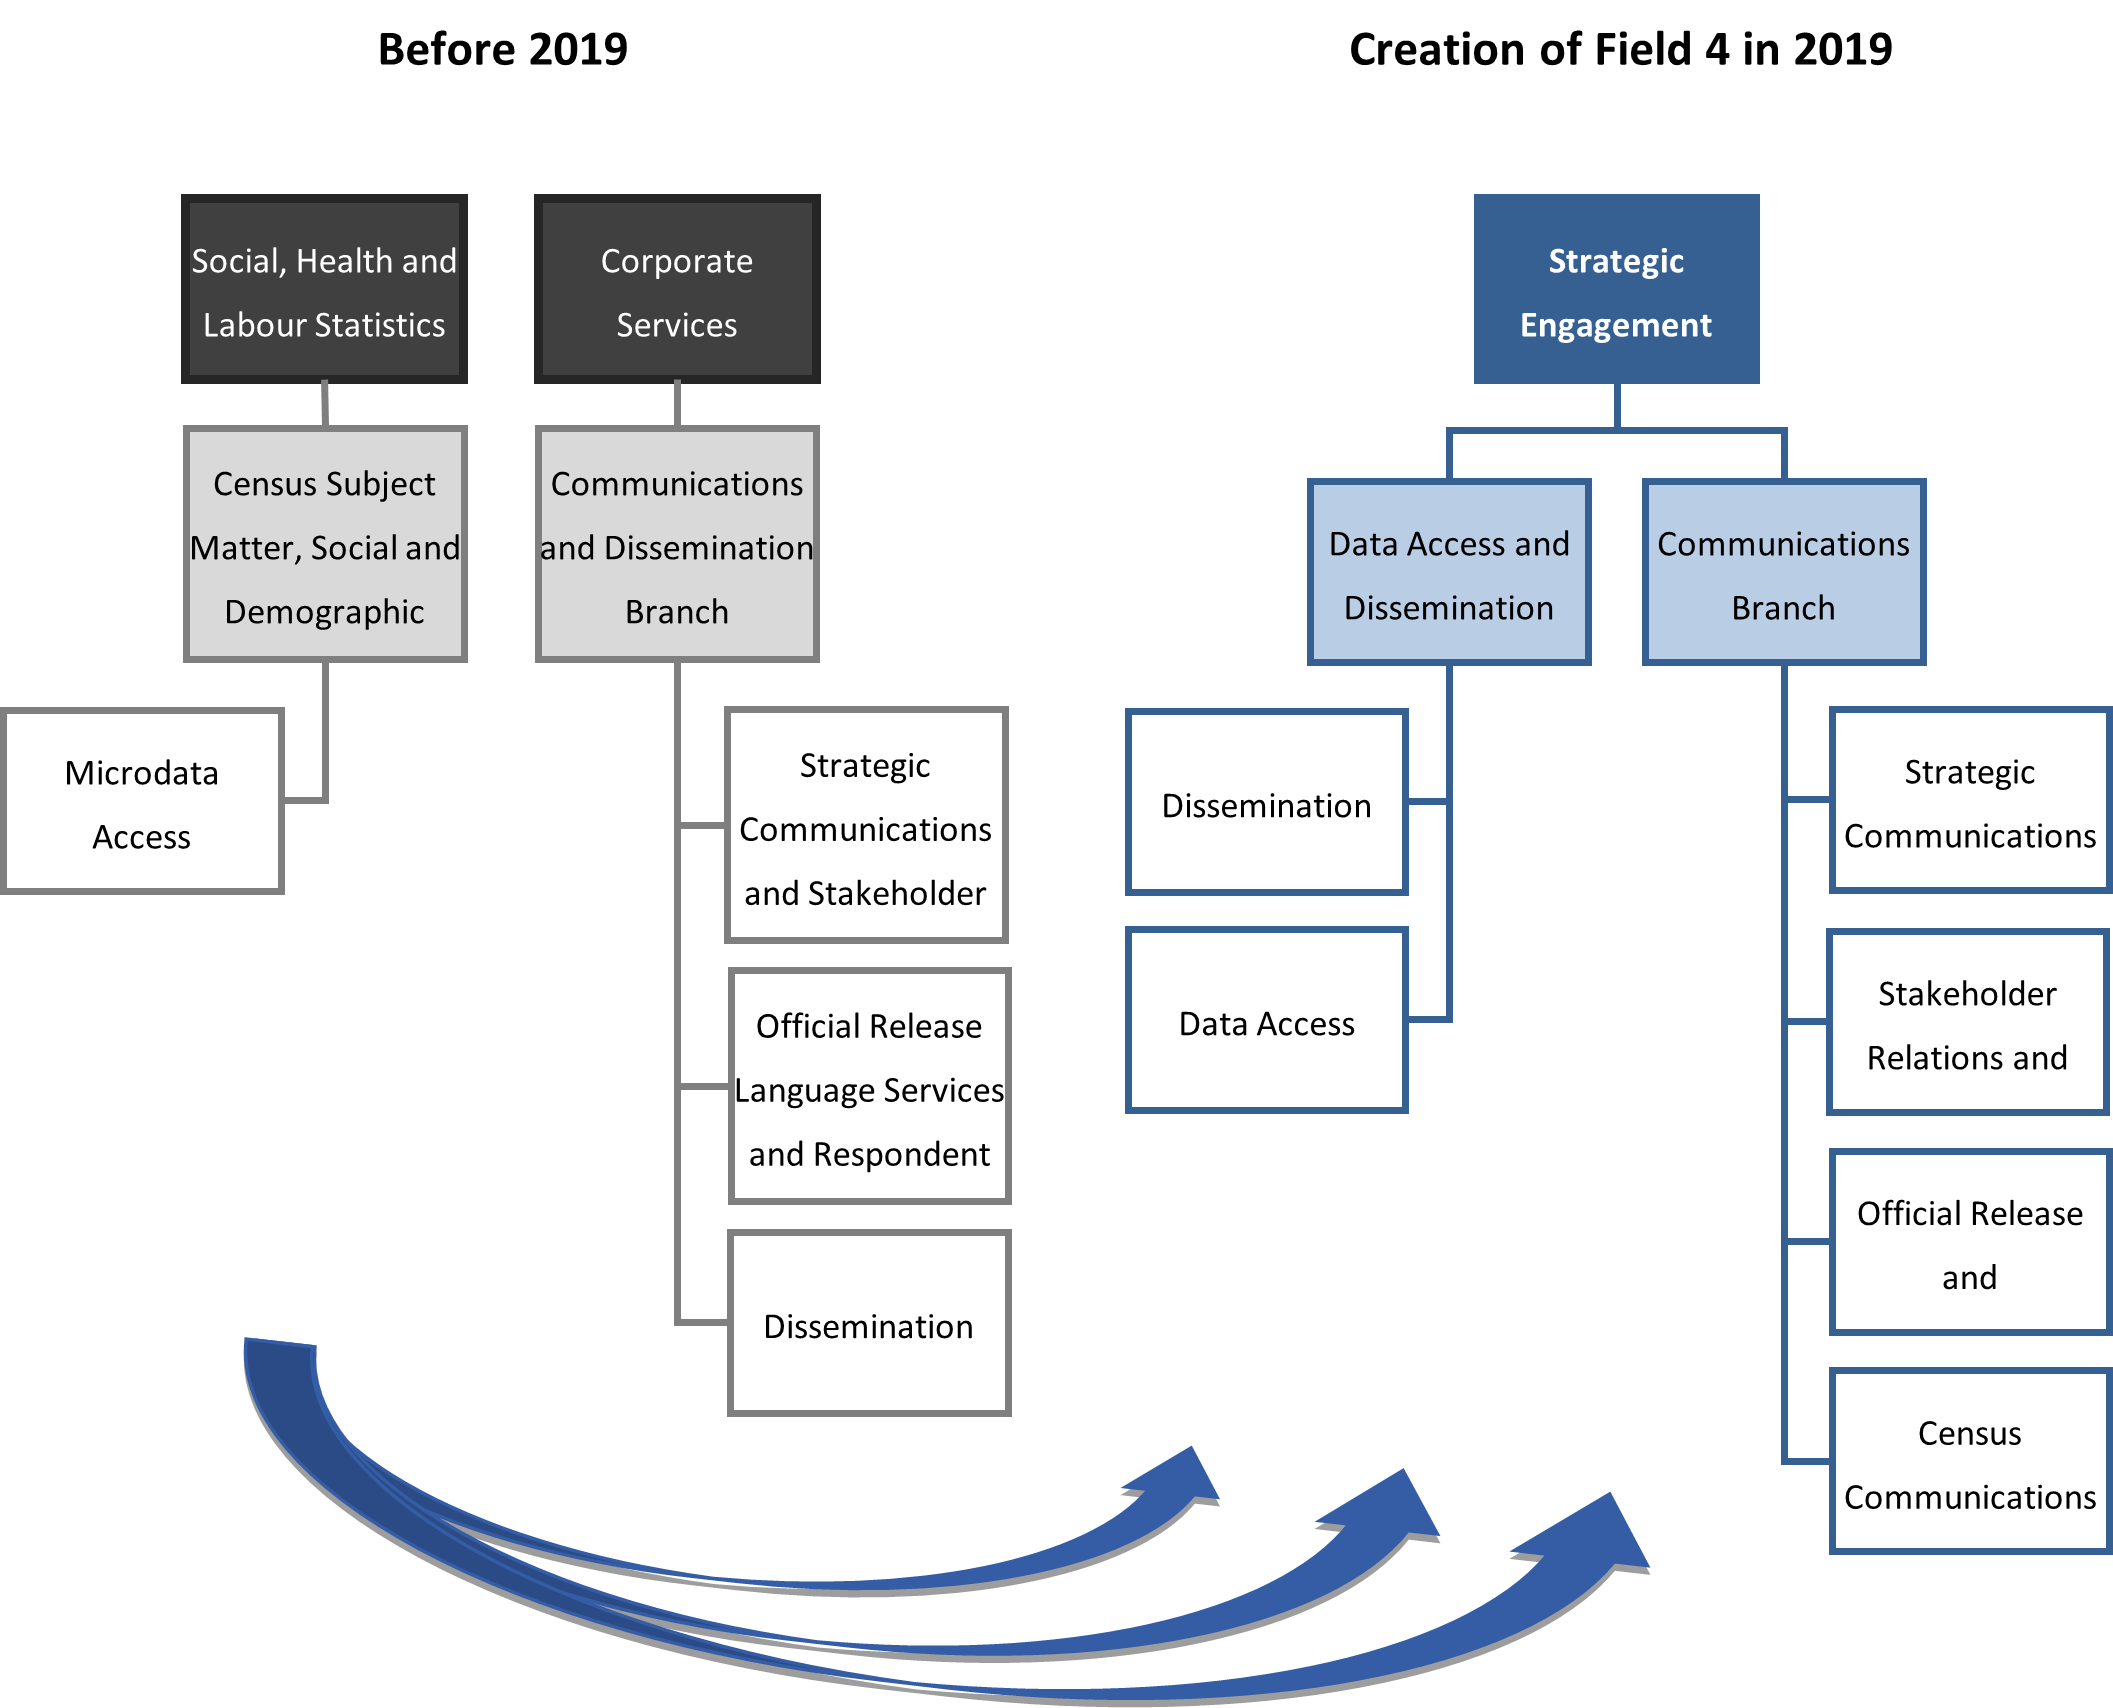
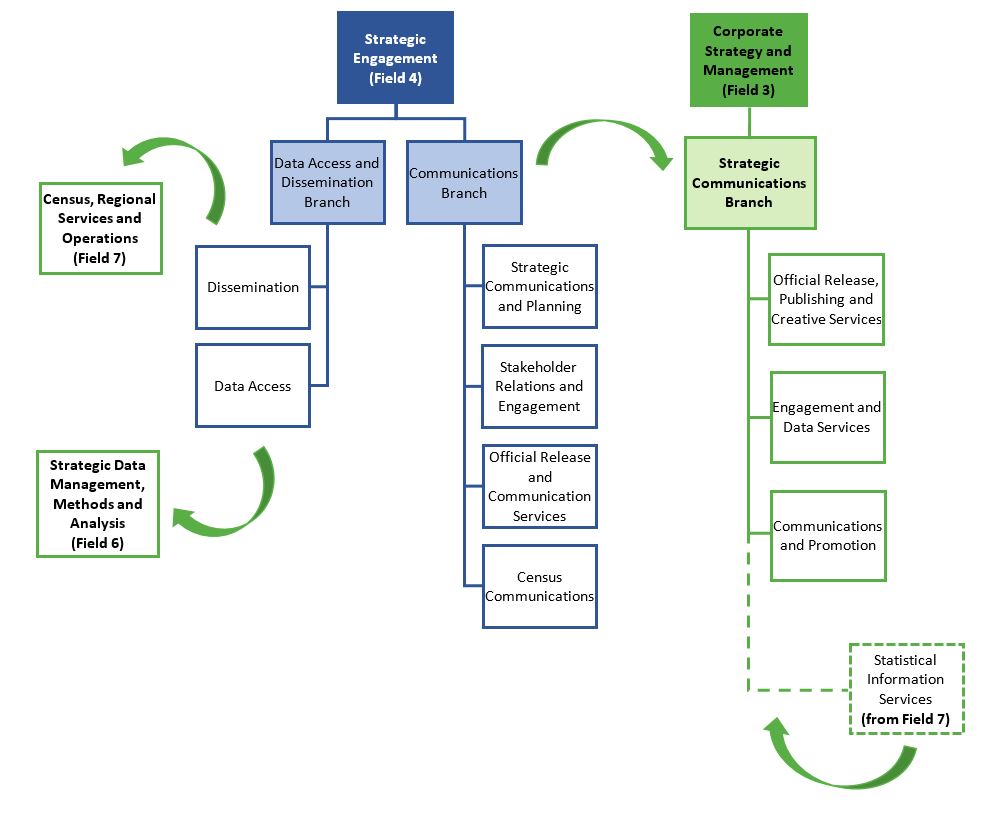
The Strategic Engagement Field (Field 4) was created in 2019 as part of Statistics Canada’s modernization agenda to help foster synergies and horizontal collaboration across the agency and to ensure integration of cross-cutting activities pertaining to the way statistical data and information were conveyed to Canadians. In this field, communications, dissemination, and microdata access activities were organized into two branches: the Communications Branch and the Data Access and Dissemination Branch. Following the agency’s recent organizational realignment exercise, which aimed at streamlining operations and better aligning resources, a decision was made to move the functions of Field 4 to other areas of the organization to enable greater synergies throughout the agency, as part of its evolving modernization journey.
The evaluation was conducted in accordance with the Treasury Board Policy on Results and Statistics Canada’s Integrated Risk-based Audit and Evaluation Plan 2022/2023 to 2026/2027. The objective of the evaluation was to provide a neutral assessment of the design, delivery and relevance of the communications and dissemination activities of the Strategic Engagement Field (Field 4). The evaluation also identified some of the key risks, opportunities and lessons learned to consider moving forward during the restructuring. Data access and internal communications activities were excluded from the evaluation scope.
Given that the decision to restructure Field 4 was announced during the conduct phase of the evaluation, the recommendations are focused on addressing the foundational elements of the reorganization, leveraging the lessons learned from Field 4 to help support the transition of communications and dissemination activities to the new structure. The report also provides areas of consideration to improve the effectiveness and efficiency of both the communications and dissemination functions.
Key findings and recommendations
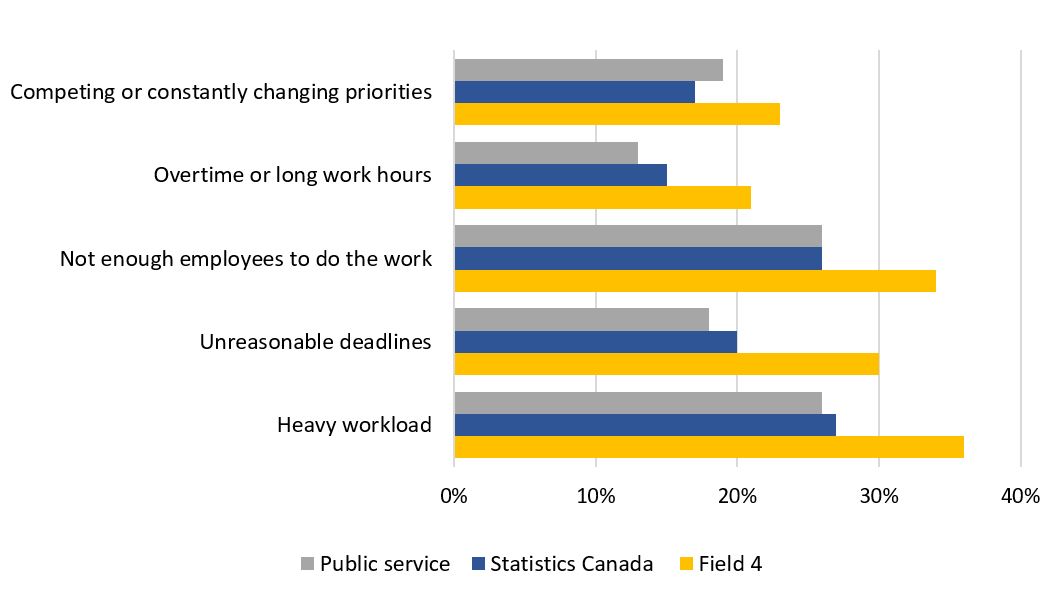
Since the creation of Field 4, communications and dissemination activities have shifted to a greater focus on engagement and user-centric service delivery. The field’s structure enabled operational effectiveness within each of the units in the divisions, but in some instances, the lack of integration across divisions hindered overall efficiency. Despite some initial growth in capacity, Field 4 has experienced a substantial rise in workload burden since 2019, which has impacted both the well-being of its employees and the effectiveness of its service delivery.
Communications and dissemination activities were a shared responsibility between Field 4, subject matter areas (SMAs), and regional offices (ROs). However, the lack of understanding around the roles of Stakeholder Relations and Engagement Division and Strategic Communications and Planning Division hindered the effectiveness and efficiency of some communications activities. Opportunities remain to improve integration between Field 4, SMAs and ROs through early involvement; better coordination tools; and a mutual understanding of and agreement on roles and responsibilities, including the role of the Communications Branch as the agency’s functional authority for all communication activities.
Performance indicators have been developed for all Field 4 divisions. Metrics for access indicators were used by Field 4 to assess the effectiveness of its activities. While media monitoring reports were also used, the lack of awareness of some SMAs around metrics and limitations in demographic data lessens their usefulness for decision-making. Performance metrics were not always updated nor monitored consistently, and gaps were also noted in the use of certain operational and availability metrics. While service standards were established for each division, not all divisions monitored whether their service standards were met.
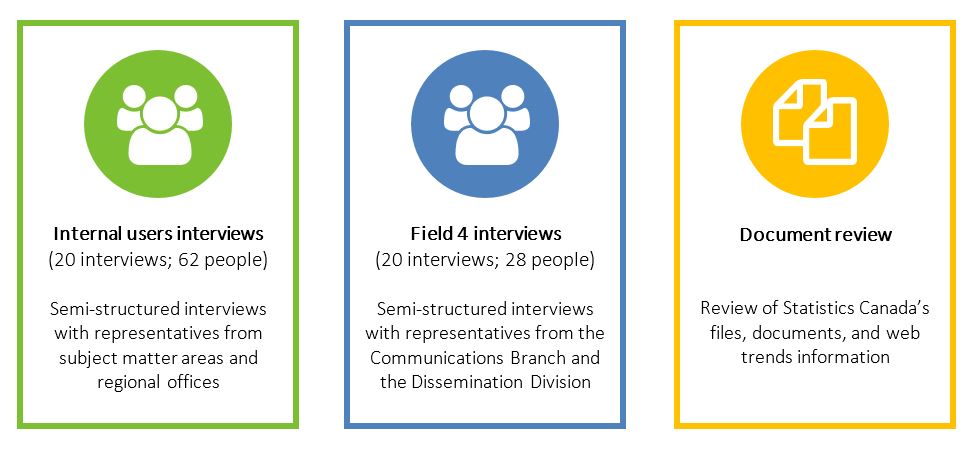
Communications and dissemination services supported the priorities of the agency and the initiatives of SMAs. While the Engagement Playbook provided guidance to SMAs in undertaking engagement activities, some wanted further support from Field 4. Overall, most internal users interviewed were satisfied with the communications and dissemination services provided by Field 4; however, some opportunities for improvement were identified.
Given that capacity, integration and coordination will remain key challenges, the restructuring of communications and dissemination presents an opportunity to reassess their core functions, redefine their roles and explore new ways to generate efficiencies. Change management, including ongoing communication, will be essential during the transition period. Performance measurement is also another area that could be strengthened in the future.
The evaluation proposed three recommendations:
Recommendation 1
The Assistant Chief Statistician (ACS) of the Corporate Strategy and Management Field (Field 3) should ensure that the core functions of the Strategic Communications Branch, including the extent of its role going forward, are clearly determined by
defining communications activities that each core function will, fully or in part, undertake itself, while
engaging key internal partners, including all SMAs with Information Services (IS) positions, for input.
Considering factors such as (but not limited to) value added, risk exposure and capacity of internal partners that could be leveraged
developing a formal framework (e.g., directives, guidelines, gating process, roles and responsibilities of internal partners) to guide communications activities, and sharing it with internal partners.
Recommendation 2
The ACS of Field 3, in collaboration with the ACS of the Census, Regional Services and Operations (Field 7), should ensure that
regular updates on the progress of the transition are provided to all employees
employees directly impacted by the change are informed of the new direction of communications and dissemination and engaged for input during the transition period through various channels (e.g., townhalls)
communications and dissemination services, including key contact information, processes for service requests, and related service standards are updated periodically and promoted through various channels
Recommendation 3
The ACS of Field 3, in collaboration with the ACS of Field 7, should strengthen the performance measurement of their respective communications and dissemination activities by
reviewing their respective performance measurement framework (e.g., performance information profiles, dashboards, strategic roadmaps) to ensure it aligns with the new structure
leveraging existing data to enhance business intelligence and decision-making, including providing guidance to internal partners (e.g., SMAs) to effectively use available information
incorporating more operational efficiency metrics
implementing a process to monitor service standards and satisfaction of internal users.
This survey is conducted by Statistics Canada in order to collect the necessary information to support the Integrated Business Statistics Program (IBSP). This program combines various survey and administrative data to develop comprehensive measures of the Canadian economy.
The statistical information from the IBSP serves many purposes, including:
calculating each province and territory's fair share of federal-provincial transfer payments for health, education and social programs
establishing government programs to assist businesses
assisting the business community in negotiating contracts and collective agreements
supporting the government in making informed decisions about fiscal, monetary and foreign exchange policies
indexing social benefit programs and determining tax brackets
enabling academics and economists to analyze the economic performance of Canadian industries and to better understand rapidly evolving business environments.
Your information may also be used by Statistics Canada for other statistical and research purposes.
Your participation in this survey is required under the authority of the Statistics Act.
Other important information
Authorization to collect this information
Data are collected under the authority of the Statistics Act, Revised Statutes of Canada, 1985, Chapter S-19.
Confidentiality
By law, Statistics Canada is prohibited from releasing any information it collects that could identify any person, business, or organization, unless consent has been given by the respondent, or as permitted by the Statistics Act. Statistics Canada will use the information from this survey for statistical purposes only.
Record linkages
To enhance the data from this survey and to reduce the reporting burden, Statistics Canada may combine the acquired data with information from other surveys or from administrative sources.
Data-sharing agreements
To reduce respondent burden, Statistics Canada has entered into data-sharing agreements with provincial and territorial statistical agencies and other government organizations, which have agreed to keep the data confidential and use them only for statistical purposes. Statistics Canada will only share data from this survey with those organizations that have demonstrated a requirement to use the data.
Section 11 of the Statistics Act provides for the sharing of information with provincial and territorial statistical agencies that meet certain conditions. These agencies must have the legislative authority to collect the same information, on a mandatory basis, and the legislation must provide substantially the same provisions for confidentiality and penalties for disclosure of confidential information as the Statistics Act. Because these agencies have the legal authority to compel businesses to provide the same information, consent is not requested and businesses may not object to the sharing of the data.
For this survey, there are Section 11 agreements with the provincial and territorial statistical agencies of Newfoundland and Labrador, Nova Scotia, New Brunswick, Québec, Ontario, Manitoba, Saskatchewan, Alberta, British Columbia and the Yukon. The shared data will be limited to information pertaining to business establishments located within the jurisdiction of the respective province or territory.
Section 12 of the Statistics Act provides for the sharing of information with federal, provincial or territorial government organizations.
Under Section 12, you may refuse to share your information with any of these organizations by writing a letter of objection to the Chief Statistician, specifying the organizations with which you do not want Statistics Canada to share your data and mailing it to the following address:
Chief Statistician of Canada
Statistics Canada
Attention of Director, Enterprise Statistics Division
150 Tunney's Pasture Driveway
Ottawa, Ontario
K1A 0T6
For this survey, there are Section 12 agreements with the statistical agencies of Prince Edward Island, the Northwest Territories and Nunavut.
For agreements with provincial and territorial government organizations, the shared data will be limited to information pertaining to business establishments located within the jurisdiction of the respective province or territory.
Business or organization and contact information
1. Verify or provide the business or organization's legal and operating name and correct where needed.
Note: Legal name modifications should only be done to correct a spelling error or typo.
Legal Name
The legal name is one recognized by law, thus it is the name liable for pursuit or for debts incurred by the business or organization. In the case of a corporation, it is the legal name as fixed by its charter or the statute by which the corporation was created.
Modifications to the legal name should only be done to correct a spelling error or typo.
To indicate a legal name of another legal entity you should instead indicate it in question 3 by selecting 'Not currently operational' and then choosing the applicable reason and providing the legal name of this other entity along with any other requested information.
Operating Name
The operating name is a name the business or organization is commonly known as if different from its legal name. The operating name is synonymous with trade name.
Legal name
Operating name (if applicable)
2. Verify or provide the contact information of the designated business or organization contact person for this questionnaire and correct where needed.
Note: The designated contact person is the person who should receive this questionnaire. The designated contact person may not always be the one who actually completes the questionnaire.
First name
Last name
Title
Preferred language of communication
English
French
Mailing address (number and street)
City
Province, territory or state
Postal code or ZIP code
Country
Canada
United States
Email address
Telephone number (including area code)
Extension number (if applicable)
The maximum number of characters is 10.
Fax number (including area code)
3. Verify or provide the current operational status of the business or organization identified by the legal and operating name above.
Operational
Not currently operational
Why is this business or organization not currently operational?
Seasonal operations
When did this business or organization close for the season?
Date
When does this business or organization expect to resume operations?
Date
Ceased operations
When did this business or organization cease operations?
Date
Why did this business or organization cease operations?
Bankruptcy
Liquidation
Dissolution
Other - Specify the other reasons why the operations ceased
Sold operations
When was this business or organization sold?
Date
What is the legal name of the buyer?
Amalgamated with other businesses or organizations
When did this business or organization amalgamate?
Date
What is the legal name of the resulting or continuing business or organization?
What are the legal names of the other amalgamated businesses or organizations?
Temporarily inactive but will re-open
When did this business or organization become temporarily inactive?
Date
When does this business or organization expect to resume operations?
Date
Why is this business or organization temporarily inactive?
No longer operating due to other reasons
When did this business or organization cease operations?
Date
Why did this business or organization cease operations?
4. Verify or provide the current main activity of the business or organization identified by the legal and operating name above.
Note: The described activity was assigned using the North American Industry Classification System (NAICS).
This question verifies the business or organization's current main activity as classified by the North American Industry Classification System (NAICS). The North American Industry Classification System (NAICS) is an industry classification system developed by the statistical agencies of Canada, Mexico and the United States. Created against the background of the North American Free Trade Agreement, it is designed to provide common definitions of the industrial structure of the three countries and a common statistical framework to facilitate the analysis of the three economies. NAICS is based on supply-side or production-oriented principles, to ensure that industrial data, classified to NAICS, are suitable for the analysis of production-related issues such as industrial performance.
The target entity for which NAICS is designed are businesses and other organizations engaged in the production of goods and services. They include farms, incorporated and unincorporated businesses and government business enterprises. They also include government institutions and agencies engaged in the production of marketed and non-marketed services, as well as organizations such as professional associations and unions and charitable or non-profit organizations and the employees of households.
The associated NAICS should reflect those activities conducted by the business or organizational units targeted by this questionnaire only, as identified in the 'Answering this questionnaire' section and which can be identified by the specified legal and operating name. The main activity is the activity which most defines the targeted business or organization's main purpose or reason for existence. For a business or organization that is for-profit, it is normally the activity that generates the majority of the revenue for the entity.
The NAICS classification contains a limited number of activity classifications; the associated classification might be applicable for this business or organization even if it is not exactly how you would describe this business or organization's main activity.
Please note that any modifications to the main activity through your response to this question might not necessarily be reflected prior to the transmitting of subsequent questionnaires and as a result they may not contain this updated information.
The following is the detailed description including any applicable examples or exclusions for the classification currently associated with this business or organization.
Description and examples
This is the current main activity
Provide a brief but precise description of this business or organization's main activity
e.g., breakfast cereal manufacturing, shoe store, software development
This is not the current main activity
Main activity
5. You indicated that is not the current main activity.
Was this business or organization's main activity ever classified as: ?
Yes
When did the main activity change?
Date
No
6. Search and select the industry classification code that best corresponds to this business or organization's main activity.
Select this business or organization's activity sector (optional)
Farming or logging operation
Construction company or general contractor
Manufacturer
Wholesaler
Retailer
Provider of passenger or freight transportation
Provider of investment, savings or insurance products
Real estate agency, real estate brokerage or leasing company
Provider of professional, scientific or technical services
Provider of health care or social services
Restaurant, bar, hotel, motel or other lodging establishment
Other sector
7. You have indicated that the current main activity of this business or organization is:
Main activity
Are there any other activities that contribute significantly (at least 10%) to this business or organization's revenue?
Yes, there are other activities
Provide a brief but precise description of this business or organization's secondary activity
e.g., breakfast cereal manufacturing, shoe store, software development
No, that is the only significant activity
8. Approximately what percentage of this business or organization's revenue is generated by each of the following activities?
When precise figures are not available, provide your best estimates.
Approximately what percentage of this business or organization's revenue is generated by each of the following activities?
Table summary
This table contains no data. It is an example of an empty data table used by respondents to provide data to Statistics Canada.
Percentage of revenue
Main activity
Secondary activity
All other activities
Total percentage
Reporting period information
1. What are the start and end dates of this business's or organization's most recently completed fiscal year?
Note: For the survey, the end date should fall between April 1, 2023 and March 31, 2024.
Here are twelve common fiscal periods that fall within the targeted dates:
May 1, 2022 to April 30, 2023
June 1, 2022 to May 31, 2023
July 1, 2022 to June 30, 2023
August 1, 2022 to July 31, 2023
September 1, 2022 to August 31, 2023
October 1, 2022 to September 30, 2023
November 1, 2022 to October 31, 2023
December 1, 2022 to November 30, 2023
January 1, 2023 to December 31, 2023
February 1, 2023 to January 31, 2024
March 1, 2023 to February 28, 2024
April 1, 2023 to March 31, 2024.
Here are other examples of fiscal periods that fall within the required dates:
September 18, 2022 to September 15, 2023 (e.g., floating year-end)
June 1, 2023 to December 31, 2023 (e.g., a newly opened business)
Fiscal Year Start date
Fiscal Year-End date
2. What is the reason the reporting period does not cover a full year?
Select all that apply.
Seasonal operations
New business
Change of ownership
Temporarily inactive
Change of fiscal year
Ceased operations
Other
Specify reason the reporting period does not cover a full year
Additional reporting instructions
1. Throughout this questionnaire, please report financial information in thousands of Canadian dollars.
For example, an amount of $763,880.25 should be reported as:
CAN$ '000
I will report in the format above
Revenue
1. For the reporting period of YYYY-MM-DD to YYYY-MM-DD, what was this business's revenue from each of the following sources?
Notes:
a detailed breakdown may be requested in other sections
these questions are asked of many different industries. Some questions may not apply to this business
Report dollar amounts in thousands of Canadian dollars.
Revenue
a. Sales of goods and services (e.g., fees, commissions, services revenue)
Report net of returns and allowances.
Sales of goods and services are defined as amounts derived from the sale of goods and services (cash or credit), falling within a business's ordinary activities. Sales should be reported net of trade discount, value added tax and other taxes based on sales.
Include:
sales from Canadian locations (domestic and export sales)
transfers to other business units or a head office of your firm.
Exclude:
transfers into inventory and consignment sales
federal, provincial and territorial sales taxes and excise duties and taxes
intercompany sales in consolidated financial statements.
b. Rental and leasing
Include rental or leasing of apartments, commercial buildings, land, office space, residential housing, investments in co-tenancies and co-ownerships, hotel or motel rooms, long and short term vehicle leasing, machinery or equipment, storage lockers, etc.
c. Commissions
Include commissions earned on the sale of products or services by businesses such as advertising agencies, brokers, insurance agents, lottery ticket sales, sales representatives and travel agencies - compensation could also be reported under this item (for example, compensation for collecting sales tax).
d. Subsidies (including grants, donations, fundraising and sponsorships)
Include:
non-repayable grants, contributions and subsidies from all levels of government
revenue from private sector (corporate and individual) sponsorships, donations and fundraising.
e. Royalties, rights, licensing and franchise fees
A royalty is defined as a payment received by the holder of a copyright, trademark or patent.
Include revenue received from the sale or use of all intellectual property rights of copyrighted materials such as musical, literary, artistic or dramatic works, sound recordings or the broadcasting of communication signals.
f. Dividends
Include:
dividend income
dividends from Canadian sources
dividends from foreign sources
patronage dividends.
Exclude equity income from investments in subsidiaries or affiliates.
g. Interest
Include:
investment revenue
interest from foreign sources
interest from Canadian bonds and debentures
interest from Canadian mortgage loans
interest from other Canadian sources.
Exclude equity income from investments in subsidiaries or affiliates.
h. All other revenue (Include intracompany transfers)
Include amounts not included in questions a. to g.
Total revenue
The sum of sub-questions a. to h.
Throughout this questionnaire, please report financial information in thousands of Canadian dollars.
Table summary
This table contains no data. It is an example of an empty data table used by respondents to provide data to Statistics Canada.
CAN$ '000
Sales of goods and services
Rental and leasing
Commissions
Subsidies
Royalties, rights, licensing and franchise fees
Dividends
Interest
Other
Total revenue
Expenses
1. For the reporting period of YYYY-MM-DD to YYYY-MM-DD, what were this business's expenses for the following items?
Notes:
a detailed breakdown may be requested in other sections
these questions are asked of many different industries. Some questions may not apply to this business
Report dollar amounts in thousands of Canadian dollars.
Expenses
a. Cost of goods sold
Many business units distinguish their costs of materials from their other business expenses (selling, general and administrative). This item is included to allow you to easily record your costs/expenses according to your normal accounting practices.
Include:
cost of raw materials and/or goods purchased for resale - net of discounts earned on purchases
freight in and duty.
Exclude all costs associated with salaries, wages, benefits, commissions and subcontracts (report at Employment costs and expenses, and Subcontracts).
b. Employment costs and expenses
b1. Salaries, wages and commissions
Please report all salaries and wages (including taxable allowances and employment commissions as defined on the T4 - Statement of Remuneration Paid) before deductions for this reporting period.
Include:
vacation pay
bonuses (including profit sharing)
employee commissions
taxable allowances (e.g., room and board, vehicle allowances, gifts such as airline tickets for holidays)
severance pay.
Exclude all payments and expenses associated with casual labour and outside contract workers (report at Subcontracts).
b2. Employee benefits
Include contributions to:
health plans
insurance plans
employment insurance
pension plans
workers' compensation
association dues
contributions to any other employee benefits such as child care and supplementary unemployment benefit (SUB) plans
contributions to provincial and territorial health and education payroll taxes.
c. Subcontracts
Subcontract expense refers to the purchasing of services from outside of the company rather than providing them in-house.
Include:
hired casual labour and outside contract workers
custom work and contract work
subcontract and outside labour
hired labour.
d. Research and development fees
Expenses from activities conducted with the intention of making a discovery that could either lead to the development of new products or procedures, or to the improvement of existing products or procedures.
e. Professional and business fees
Include:
legal services
accounting and auditing fees
consulting fees
education and training fees
appraisal fees
management and administration fees
property management fees
information technology (IT) consulting and service fees (purchased)
architectural fees
engineering fees
scientific and technical service fees
other consulting fees (management, technical and scientific)
veterinary fees
fees for human health services
payroll preparation fees
all other professional and business service fees.
Exclude service fees paid to Head Office (report at All other costs and expenses).
f. Utilities
Utility expenses related to operating your business unit such as water, electricity, gas and heating.
Include:
diesel, fuel wood, natural gas, oil and propane
sewage.
Exclude:
energy expenses covered in your rental and leasing contracts
telephone, Internet and other telecommunications
vehicle fuel (report at All other costs and expenses).
g. Office and computer related expenses
Include:
office stationery and supplies, paper and other supplies for photocopiers, printers and fax machines
postage and courier (used in the day to day office business activity)
computer and peripherals upgrade expenses
data processing.
Exclude telephone, Internet and other telecommunication expenses (report at Telephone, Internet and other telecommunication).
h. Telephone, Internet and other telecommunication
Include:
internet
telephone and telecommunications
cellular telephone
fax machine
pager.
i. Business taxes, licenses and permits
Include:
property taxes paid directly and property transfer taxes
vehicle license fees
beverage taxes and business taxes
trade license fees
membership fees and professional license fees
provincial capital tax.
j. Royalties, franchise fees and memberships
Include:
amounts paid to holders of patents, copyrights, performing rights and trademarks
gross overriding royalty expenses and direct royalty costs
resident and non-resident royalty expenses
franchise fees.
Exclude Crown royalties
k. Crown charges
Federal or Provincial royalty, tax, lease or rental payments made in relation to the acquisition, development or ownership of Canadian resource properties.
Include:
Crown royalties
Crown leases and rentals
oil sand leases
stumpage fees.
l. Rental and leasing
Include:
lease rental expenses, real estate rental expenses, condominium fees and equipment rental expenses
motor vehicle rental and leasing expenses
studio lighting and scaffolding
machinery and equipment rental expenses
storage expenses
road and construction equipment rental
fuel and other utility costs covered in your rental and leasing contracts.
m. Repair and maintenance
Include:
buildings and structures
machinery and equipment
security equipment
vehicles
costs related to materials, parts and external labour associated with these expenses
janitorial and cleaning services and garbage removal.
n. Amortization and depreciation
Include:
direct cost depreciation of tangible assets and amortization of leasehold improvements
amortization of intangible assets (e.g., amortization of goodwill, patents, franchises, copyrights, trademarks, deferred charges, organizational costs).
o. Insurance
Insurance recovery income should be deducted from insurance expenses.
Include:
professional and other liability insurance
motor vehicle and property insurance
executive life insurance
bonding, business interruption insurance and fire insurance.
p. Advertising, marketing, promotion, meals and entertainment
Include:
newspaper advertising and media expenses
catalogues, presentations and displays
tickets for theatre, concerts and sporting events for business promotion
fundraising expenses
meals, entertainment and hospitality purchases for clients.
exploration and development (including prospect/geological, well abandonment and dry holes, exploration expenses, development expenses)
amounts not included in sub-questions a. to t. above.
Total expenses
The sum of sub-questions a. to u.
For the reporting period of YYYY-MM-DD to YYYY-MM-DD, what were this business's expenses for the following items?
Table summary
This table contains no data. It is an example of an empty data table used by respondents to provide data to Statistics Canada.
CAN$ '000
Cost of goods sold
Opening inventories
Purchases
Closing inventories
Cost of goods sold
Employment costs and expenses
Salaries, wages and commissions
Employee benefits
Subcontracts
Research and development fees
Professional and business fees
Utilities
Office and computer related expenses
Telephone, Internet and other telecommunication
Business taxes, licenses and permits
Royalties, franchise fees and memberships
Crown charges
Rental and leasing
Repair and maintenance
Amortization and depreciation
Insurance
Advertising, marketing, promotion, meals and entertainment
Travel, meetings and conventions
Financial services
Interest expense
Other non-production-related costs and expenses
All other costs and expenses
Total expenses
Industry Characteristics
Sales
The following describes the types of periodicals for which you are requested to provide your sales revenue.
Consumer periodicals: periodicals covering topics of general or special interest aimed at a general consumer audience. Include arts, culture, leisure and entertainment, home and lifestyle, women's general interest, general business, religious and news.
Business-to-business, trade, and professional periodicals: periodicals dealing with industries, occupations and professions and scholarly publications aimed at professional audiences interested in keeping up-to-date with news, research and developments in a profession or a trade. Include business, farming and professional.
1. What were this business's print and digital sales for each of the following goods and services?
Include both print and digital revenue sources.
For questions 1a. to 1f, report revenue for your publishing business.
Please report all amounts in thousands of Canadian dollars.
Consumer periodicals: Periodicals covering topics of general or special interest aimed at a consumer audience. Examples include arts, culture, leisure and entertainment, home and lifestyles, women's general interest, general business and news.
Business-to-business, trade, and professional periodicals: Periodicals dealing with industries, occupations and professions and scholarly publications aimed at professional audiences interested in keeping up-to-date with news, research and developments in a profession or a trade. Include business, farming, and professional.
Custom publishing revenue: Periodicals created by publishers, media companies or agencies exclusively for third parties that are not primarily in the periodical publishing industry. Examples may include in-flight or other periodicals designed to foster a direct relationship between a company or brand, and its customers.
What were this business's print and digital sales for each of the following goods and services?
Table summary
This table contains no data. It is an example of an empty data table used by respondents to provide data to Statistics Canada.
CAN$ '000
Advertising revenue
Consumer periodicals
Business-to-business, trade, and professional periodicals
Total advertising revenue
Circulation revenue
Consumer periodicals
Business-to-business, trade, and professional periodicals
Total circulation revenue
Custom publishing revenue
Consumer periodicals
Business-to-business, trade, and professional periodicals
Total custom publishing revenue
Custom printing revenue
Events, conferences and trade-show revenue
Other
Total sales of goods and services
2. Of the $ [amount] reported as advertising revenue, what percentage was attributed to online or digital-only sources?
Percentage
3. Of the $ [amount] reported as circulation revenue, what percentage was attributed to digital products such as digital-only editions and online access?
Percentage
4. Of the $ [amount] reported as custom publishing revenue, what percentage was attributed to digital products such as digital-only editions and online access?
Percentage
5. What were this business's revenues from the following sources?
Please report all amounts in thousands of Canadian dollars.
What were this business's revenues from the following sources?
Table summary
This table contains no data. It is an example of an empty data table used by respondents to provide data to Statistics Canada.
CAN$ '000
Federal, provincial/territorial, municipal grants and subsidies
Other support
Selected expenses
6. What were this business's expenses for sub-contract printing?
Please report all amounts in thousands of Canadian dollars.
Expenses (CAN$ '000)
7. What was this business's annual editorial content expenses (for Print and Digital editions) in each of the following categories?
Editorial content: Text, photographs, graphics, illustrations and audio-visual content in a periodical and its associated digital extension (e.g., website, app, etc.).
Exclude expenses incurred for marketing, sales, advertising, management, accounting and other non-editorial functions.
Please report all amounts in thousands of Canadian dollars.
Note: In the event that an employee (or employees) spend only a portion of their time producing editorial content, please provide the estimated portion of the salary that is directly related to the production of the editorial content.
What was this business's annual editorial content expenses (for Print and Digital editions) in each of the following categories?
Table summary
This table contains no data. It is an example of an empty data table used by respondents to provide data to Statistics Canada.
Consumer periodicals
(CAN$ '000)
Business to business, trade, and professional periodicals
(CAN$ '000)
Total
(CAN$ '000)
Salaries
Freelance expenses
Purchasing content
Total editorial content expenses
8. From the total editorial content expenses reported in question 7, please provide the estimated percentage breakdown of those expenses incurred by the company for work completed by Canadians, permanent residents or other Canadian sources.
Percentage
9. What were this business's expenses for developing and maintaining its digital infrastructure?
Include employees who are directly involved with developing or maintaining your digital infrastructure, not in content creation.
e.g., hosting, infographics, software, hardware, other miscellaneous IT costs, employees
Expenses (CAN$ '000)
Titles published
10. How many titles did this business publish in each of the following categories?
Exclude newsletters.
Note: Do not provide the number of copies or copies circulated.
Titles published in print only: limited to no editorial content published digitally.
Titles published digitally only: limited to no editorial content published in print.
Titles published in both mediums: editorial content published in print and digitally.
How many titles did this business publish in each of the following categories?
Table summary
This table contains no data. It is an example of an empty data table used by respondents to provide data to Statistics Canada.
Print-only
Digital-only
Print and digital
(both mediums)
Consumer periodicals
Business-to-business, trade, and professional periodicals
Total titles by medium
Circulation
11. What was this business's annual print circulation net of return?
Include print circulation only.
Exclude newsletters.
Provide the total number of copies sold through the various channels of distribution listed.
a. Subscription: Copies of a periodical sold to a customer for a fixed period of time, generally one year or more.
If you sell subscriptions to 10 different publications that include both a print version and a digital version, and both versions are part of a package deal, then you should not classify the digital version as free. Therefore, please enter 20 as the answer to question 11a. Paid subscription, for an overall total of 20.
b. Newsstand or single copy: Copies of a periodical sold at newsstands or other retail outlets.
c. Other copies sold: Copies sold, other than through subscription or newsstand, e.g., back issues or one-off special interest publications.
d. Controlled or request circulation:
Controlled circulation: Free copies that are individually addressed to recipients who have directly requested the periodical from a publishing firm.
Requested circulation: Copies distributed free of charge on a regular basis to consumers selected by the publisher.
e. Other free, complimentary or promotional copies: Other copies distributed free of charge, e.g., to advertisers or agencies who have purchased advertising in the periodical or for promotional or marketing purposes.
What was this business's annual print circulation net of return?
Table summary
This table contains no data. It is an example of an empty data table used by respondents to provide data to Statistics Canada.
Consumer
periodicals
Business to business, trade, and professional periodicals
Total
number
Paid subscriptions
Newsstand or single copy
Other copies sold
Controlled or request circulation
Other free, complimentary or promotional copies
Total
Language
12. Indicate the number of titles you publish by language.
Exclude newsletters.
Note: Do not provide the number of copies circulated.
Temporary text until Specs are corrected.
Personnel
13. What was this business's number of employees and freelancers producing editorial content in the following categories?
Include paid or unpaid writers, photographers, graphic designers, translators and other editorial personnel that produce content for your periodical.
Exclude employees and subcontracts in marketing, sales, advertising, management, accounting and other non-editorial functions.
Note: Individuals working in both periodical domains does not represent a total, however it represents the number of employees and/or freelancers that work in both domains; the Consumer periodicals and Business to business, trade, and professional periodicals.
What was this business's number of employees and freelancers producing editorial content in the following categories?
Table summary
This table contains no data. It is an example of an empty data table used by respondents to provide data to Statistics Canada.
Dedicated to Consumer periodicals
Dedicated to Business to business, trade, and professional periodicals
Working in both periodical domains
Employees
Freelancers (paid and unpaid)
Total editorial employees and freelancers
14. For the editorial content employees and freelancers reported in question 13, please provide the percentage breakdown that are Canadian or permanent residents.
Note: Individuals working in both periodical domains does not represent a total, however it represents the number of employees and/or freelancers that work in both domains; the Consumer periodicals and Business to business, trade, and professional periodicals.
For the editorial content employees and freelancers reported in question 13, please provide the percentage breakdown that are Canadian or permanent residents.
Table summary
This table contains no data. It is an example of an empty data table used by respondents to provide data to Statistics Canada.
Dedicated to Consumer periodicals
Dedicated to Business to business, trade, and professional periodicals
Working in both periodical domains
Employees
Freelancers (paid and unpaid)
15. What were this business's personnel in each of the following categories?
Table summary
This table contains no data. It is an example of an empty data table used by respondents to provide data to Statistics Canada.
Number
Percentage
Average number of paid employees during the reporting period
Percentage of paid employees who worked full time
Number of contract workers for whom you did not issue a T4
Notification of intent to extract web data
1. Does this business have a website?
Yes
Specify the business website address 1
Specify the business website address 2
Specify the business website address 3
No
Notification of intent to extract web data
Statistics Canada engages in web-data extraction, also known as web scraping, which is a process by which information is gathered and copied from the Web using automated scripts or robots, for retrieval and analysis. As a result, we may visit the website for this business or organization to search for and compile additional information. The use of web scraping is part of a broader effort to reduce the response burden on businesses or organizations, as well as produce additional statistical indicators to ensure that our data remain accurate and relevant.
We will strive to ensure that the data collection does not interfere with the functionality of the website. Any data collected will be used by Statistics Canada for statistical and research purposes only, in accordance with the agency's privacy and confidentiality mandate. All information collected by Statistics Canada is strictly protected.
If you have any questions or concerns, please contact Statistics Canada Client Services, toll-free at 1-877-949-9492 (TTY: 1-800-363-7629) or by email at infostats@statcan.gc.ca- this link will open in a new window. Additional information about this survey can be found by selecting the following link: Information for survey participants (ISP).
Changes or events
1. Indicate any changes or events that affected the reported values for this business or organization, compared with the last reporting period.
Select all that apply.
Strike or lock-out
Exchange rate impact
Price changes in goods or services sold
Contracting out
Organizational change
Price changes in labour or raw materials
Natural disaster
Recession
Change in product line
Sold business or business units
Expansion
New or lost contract
Plant closures
Acquisition of business or business units
Other
Specify the other changes or events:
No changes or events
Contact person
2. Statistics Canada may need to contact the person who completed this questionnaire for further information.
Is the provided given names and the provided family name the best person to contact?
Yes
No
Who is the best person to contact about this questionnaire?
First name:
Last name:
Title:
Email address:
Telephone number (including area code):
Extension number (if applicable):
The maximum number of characters is 5.
Fax number (including area code):
Feedback
3. How long did it take to complete this questionnaire?
Include the time spent gathering the necessary information.
Hours:
Minutes:
4. Do you have any comments about this questionnaire?
This survey is conducted by Statistics Canada in order to collect the necessary information to support the Integrated Business Statistics Program (IBSP). This program combines various survey and administrative data to develop comprehensive measures of the Canadian economy.
The statistical information from the IBSP serves many purposes, including:
calculating each province and territory's fair share of federal-provincial transfer payments for health, education and social programs
establishing government programs to assist businesses
assisting the business community in negotiating contracts and collective agreements
supporting the government in making informed decisions about fiscal, monetary and foreign exchange policies
indexing social benefit programs and determining tax brackets
enabling academics and economists to analyze the economic performance of Canadian industries and to better understand rapidly evolving business environments.
Your information may also be used by Statistics Canada for other statistical and research purposes.
Your participation in this survey is required under the authority of the Statistics Act.
Other important information
Authorization to collect this information
Data are collected under the authority of the Statistics Act, Revised Statutes of Canada, 1985, Chapter S-19.
Confidentiality
By law, Statistics Canada is prohibited from releasing any information it collects that could identify any person, business, or organization, unless consent has been given by the respondent, or as permitted by the Statistics Act. Statistics Canada will use the information from this survey for statistical purposes only.
Record linkages
To enhance the data from this survey and to reduce the reporting burden, Statistics Canada may combine the acquired data with information from other surveys or from administrative sources.
Data-sharing agreements
To reduce respondent burden, Statistics Canada has entered into data-sharing agreements with provincial and territorial statistical agencies and other government organizations, which have agreed to keep the data confidential and use them only for statistical purposes. Statistics Canada will only share data from this survey with those organizations that have demonstrated a requirement to use the data.
Section 11 of the Statistics Act provides for the sharing of information with provincial and territorial statistical agencies that meet certain conditions. These agencies must have the legislative authority to collect the same information, on a mandatory basis, and the legislation must provide substantially the same provisions for confidentiality and penalties for disclosure of confidential information as the Statistics Act. Because these agencies have the legal authority to compel businesses to provide the same information, consent is not requested and businesses may not object to the sharing of the data.
For this survey, there are Section 11 agreements with the provincial and territorial statistical agencies of Newfoundland and Labrador, Nova Scotia, New Brunswick, Québec, Ontario, Manitoba, Saskatchewan, Alberta, British Columbia and the Yukon. The shared data will be limited to information pertaining to business establishments located within the jurisdiction of the respective province or territory.
Section 12 of the Statistics Act provides for the sharing of information with federal, provincial or territorial government organizations.
Under Section 12, you may refuse to share your information with any of these organizations by writing a letter of objection to the Chief Statistician, specifying the organizations with which you do not want Statistics Canada to share your data and mailing it to the following address:
Chief Statistician of Canada
Statistics Canada
Attention of Director, Enterprise Statistics Division
150 Tunney's Pasture Driveway
Ottawa, Ontario
K1A 0T6
For this survey, there are Section 12 agreements with the statistical agencies of Prince Edward Island, the Northwest Territories and Nunavut.
For agreements with provincial and territorial government organizations, the shared data will be limited to information pertaining to business establishments located within the jurisdiction of the respective province or territory.
Business or organization and contact information
1. Verify or provide the business or organization's legal and operating name and correct where needed.
Note: Legal name modifications should only be done to correct a spelling error or typo.
Legal Name
The legal name is one recognized by law, thus it is the name liable for pursuit or for debts incurred by the business or organization. In the case of a corporation, it is the legal name as fixed by its charter or the statute by which the corporation was created.
Modifications to the legal name should only be done to correct a spelling error or typo.
To indicate a legal name of another legal entity you should instead indicate it in question 3 by selecting 'Not currently operational' and then choosing the applicable reason and providing the legal name of this other entity along with any other requested information.
Operating Name
The operating name is a name the business or organization is commonly known as if different from its legal name. The operating name is synonymous with trade name.
Legal name
Operating name (if applicable)
2. Verify or provide the contact information of the designated business or organization contact person for this questionnaire and correct where needed.
Note: The designated contact person is the person who should receive this questionnaire. The designated contact person may not always be the one who actually completes the questionnaire.
First name
Last name
Title
Preferred language of communication
English
French
Mailing address (number and street)
City
Province, territory or state
Postal code or ZIP code
Country
Canada
United States
Email address
Telephone number (including area code)
Extension number (if applicable)
The maximum number of characters is 10.
Fax number (including area code)
3. Please verify or provide the current operational status of the business or organization identified by the legal and operating name above.
Operational
Not currently operational
Why is this business or organization not currently operational?
Seasonal operations
When did this business or organization close for the season?
Date
When does this business or organization expect to resume operations?
Date
Ceased operations
When did this business or organization cease operations?
Date
Why did this business or organization cease operations?
Bankruptcy
Liquidation
Dissolution
Other - Specify the other reasons for ceased operations
Sold operations
When was this business or organization sold?
Date
What is the legal name of the buyer?
Amalgamated with other businesses or organizations
When did this business or organization amalgamate?
Date
What is the legal name of the resulting or continuing business or organization?
What are the legal names of the other amalgamated businesses or organizations?
Temporarily inactive but will re-open
When did this business or organization become temporarily inactive?
Date
When does this business or organization expect to resume operations?
Date
Why is this business or organization temporarily inactive?
No longer operating due to other reasons
When did this business or organization cease operations?
Date
Why did this business or organization cease operations?
4. Verify or provide the current main activity of the business or organization identified by the legal and operating name above.
Note: The described activity was assigned using the North American Industry Classification System (NAICS).
This question verifies the business or organization's current main activity as classified by the North American Industry Classification System (NAICS). The North American Industry Classification System (NAICS) is an industry classification system developed by the statistical agencies of Canada, Mexico and the United States. Created against the background of the North American Free Trade Agreement, it is designed to provide common definitions of the industrial structure of the three countries and a common statistical framework to facilitate the analysis of the three economies. NAICS is based on supply-side or production-oriented principles, to ensure that industrial data, classified to NAICS, are suitable for the analysis of production-related issues such as industrial performance.
The target entity for which NAICS is designed are businesses and other organizations engaged in the production of goods and services. They include farms, incorporated and unincorporated businesses and government business enterprises. They also include government institutions and agencies engaged in the production of marketed and non-marketed services, as well as organizations such as professional associations and unions and charitable or non-profit organizations and the employees of households.
The associated NAICS should reflect those activities conducted by the business or organizational units targeted by this questionnaire only, as identified in the 'Answering this questionnaire' section and which can be identified by the specified legal and operating name. The main activity is the activity which most defines the targeted business or organization's main purpose or reason for existence. For a business or organization that is for-profit, it is normally the activity that generates the majority of the revenue for the entity.
The NAICS classification contains a limited number of activity classifications; the associated classification might be applicable for this business or organization even if it is not exactly how you would describe this business or organization's main activity.
Please note that any modifications to the main activity through your response to this question might not necessarily be reflected prior to the transmitting of subsequent questionnaires and as a result they may not contain this updated information.
The following is the detailed description including any applicable examples or exclusions for the classification currently associated with this business or organization.
Description and examples
This is the current main activity
Provide a brief but precise description of this business or organization's main activity
e.g., breakfast cereal manufacturing, shoe store, software development
This is not the current main activity
Main activity
5. You indicated that is not the current main activity. Was this business or organization's main activity ever classified as: ?
Yes
When did the main activity change?
Date
No
6. Search and select the industry classification code that best corresponds to this business or organization's main activity.
Select this business or organization's activity sector (optional)
Farming or logging operation
Construction company or general contractor
Manufacturer
Wholesaler
Retailer
Provider of passenger or freight transportation
Provider of investment, savings or insurance products
Real estate agency, real estate brokerage or leasing company
Provider of professional, scientific or technical services
Provider of health care or social services
Restaurant, bar, hotel, motel or other lodging establishment
Other sector
7. You have indicated that the current main activity of this business or organization is: Main activity. Are there any other activities that contribute significantly (at least 10%) to this business or organization's revenue?
Yes, there are other activities
Provide a brief but precise description of this business or organization's secondary activity
e.g., breakfast cereal manufacturing, shoe store, software development
No, that is the only significant activity
8. Approximately what percentage of this business or organization's revenue is generated by each of the following activities?
When precise figures are not available, provide your best estimates.
Approximately what percentage of this business or organization's revenue is generated by each of the following activities?
Table summary
This table contains no data. It is an example of an empty data table used by respondents to provide data to Statistics Canada.
Percentage of revenue
Main activity
Secondary activity
All other activities
Total percentage
Reporting period information
1. What are the start and end dates of this business's or organization's most recently completed fiscal year?
For this survey, the end date should fall between April 1, 2023 and March 31, 2024.
Here are twelve common fiscal periods that fall within the targeted dates:
May 1, 2022 to April 30, 2023
June 1, 2022 to May 31, 2023
July 1, 2022 to June 30, 2023
August 1, 2022 to July 31, 2023
September 1, 2022 to August 31, 2023
October 1, 2022 to September 30, 2023
November 1, 2022 to October 31, 2023
December 1, 2022 to November 30, 2023
January 1, 2023 to December 31, 2023
February 1, 2023 to January 31, 2024
March 1, 2023 to February 28, 2024
April 1, 2023 to March 31, 2024.
Here are other examples of fiscal periods that fall within the required dates:
September 18, 2022 to September 15, 2023 (e.g., floating year-end)
June 1, 2023 to December 31, 2023 (e.g., a newly opened business).
Fiscal year start date
Fiscal year-end date
2. What is the reason the reporting period does not cover a full year?
Select all that apply.
Seasonal operations
New business
Change of ownership
Temporarily inactive
Change of fiscal year
Ceased operations
Other
Specify reason the reporting period does not cover a full year
Additional reporting instructions
1. Throughout this questionnaire, please report financial information in thousands of Canadian dollars.
For example, an amount of $763,880.25 should be reported as:
CAN$ '000 : $764,000.
I will report in the format above
Revenue
1. For the reporting period of YYYY-MM-DD to YYYY-MM-DD, what was this business's revenue from each of the following sources?
Notes:
a detailed breakdown may be requested in other sections
these questions are asked of many different industries. Some questions may not apply to this business
Report dollar amounts in thousands of Canadian dollars.
Revenue
a. Sales of goods and services (e.g., fees, commissions, services revenue)
Report net of returns and allowances.
Sales of goods and services are defined as amounts derived from the sale of goods and services (cash or credit), falling within a business's ordinary activities. Sales should be reported net of trade discount, value added tax and other taxes based on sales.
Include:
sales from Canadian locations (domestic and export sales)
transfers to other business units or a head office of your firm.
Exclude:
transfers into inventory and consignment sales
federal, provincial and territorial sales taxes and excise duties and taxes
intercompany sales in consolidated financial statements.
b. Rental and leasing
Include rental or leasing of apartments, commercial buildings, land, office space, residential housing, investments in co-tenancies and co-ownerships, hotel or motel rooms, long and short term vehicle leasing, machinery or equipment, storage lockers, etc.
c. Commissions
Include commissions earned on the sale of products or services by businesses such as advertising agencies, brokers, insurance agents, lottery ticket sales, sales representatives and travel agencies - compensation could also be reported under this item (for example, compensation for collecting sales tax).
d. Subsidies (including grants, donations, fundraising and sponsorships)
Include:
non-repayable grants, contributions and subsidies from all levels of government
revenue from private sector (corporate and individual) sponsorships, donations and fundraising.
e. Royalties, rights, licensing and franchise fees
A royalty is defined as a payment received by the holder of a copyright, trademark or patent.
Include revenue received from the sale or use of all intellectual property rights of copyrighted materials such as musical, literary, artistic or dramatic works, sound recordings or the broadcasting of communication signals.
f. Dividends
Include:
dividend income
dividends from Canadian sources
dividends from foreign sources
patronage dividends.
Exclude equity income from investments in subsidiaries or affiliates.
g. Interest
Include:
investment revenue
interest from foreign sources
interest from Canadian bonds and debentures
interest from Canadian mortgage loans
interest from other Canadian sources.
Exclude equity income from investments in subsidiaries or affiliates.
h. All other revenue (Include intracompany transfers)
Include amounts not included in questions a. to g.
Total revenue
The sum of sub-questions a. to h.
For the reporting period of YYYY-MM-DD to YYYY-MM-DD, what was this business's revenue from each of the following sources?
Table summary
This table contains no data. It is an example of an empty data table used by respondents to provide data to Statistics Canada.
CAN$ '000
a. Sales of goods and services
Include sales, commissions, rental and leasing revenue if they are this business's primary revenue source.
b. Rental and leasing
Report only if this is a secondary revenue source. If rental and leasing are your primary revenue source, report at question a.
c. Commissions
Report only if this is a secondary revenue source. If commissions are your primary revenue source, report at question a.
d. Subsidies
Include grants, donations, fundraising and sponsorships
e. Royalties, rights, licensing and franchise fees
f. Dividends
g. Interest
h. Other
Include intracompany transfers. Specify all other revenue:
Total revenue
Expenses
1. For the reporting period of YYYY-MM-DD to YYYY-MM-DD, what were this business's expenses for the following items?
Notes:
a detailed breakdown may be requested in other sections
these questions are asked of many different industries. Some questions may not apply to this business
Report dollar amounts in thousands of Canadian dollars.
Expenses
a. Cost of goods sold
Many business units distinguish their costs of materials from their other business expenses (selling, general and administrative). This item is included to allow you to easily record your costs/expenses according to your normal accounting practices.
Include:
cost of raw materials and/or goods purchased for resale - net of discounts earned on purchases
freight in and duty.
Exclude all costs associated with salaries, wages, benefits, commissions and subcontracts (report at Employment costs and expenses, and Subcontracts).
b. Employment costs and expenses
b1. Salaries, wages and commissions
Please report all salaries and wages (including taxable allowances and employment commissions as defined on the T4 - Statement of Remuneration Paid) before deductions for this reporting period.
Include:
vacation pay
bonuses (including profit sharing)
employee commissions
taxable allowances (e.g., room and board, vehicle allowances, gifts such as airline tickets for holidays)
severance pay.
Exclude all payments and expenses associated with casual labour and outside contract workers (report at Subcontracts).
b2. Employee benefits
Include contributions to:
health plans
insurance plans
employment insurance
pension plans
workers' compensation
association dues
contributions to any other employee benefits such as child care and supplementary unemployment benefit (SUB) plans
contributions to provincial and territorial health and education payroll taxes.
c. Subcontracts
Subcontract expense refers to the purchasing of services from outside of the company rather than providing them in-house.
Include:
hired casual labour and outside contract workers
custom work and contract work
subcontract and outside labour
hired labour.
d. Research and development fees
Expenses from activities conducted with the intention of making a discovery that could either lead to the development of new products or procedures, or to the improvement of existing products or procedures.
e. Professional and business fees
Include:
legal services
accounting and auditing fees
consulting fees
education and training fees
appraisal fees
management and administration fees
property management fees
information technology (IT) consulting and service fees (purchased)
architectural fees
engineering fees
scientific and technical service fees
other consulting fees (management, technical and scientific)
veterinary fees
fees for human health services
payroll preparation fees
all other professional and business service fees.
Exclude service fees paid to Head Office (report at All other costs and expenses).
f. Utilities
Utility expenses related to operating your business unit such as water, electricity, gas and heating.
Include:
diesel, fuel wood, natural gas, oil and propane
sewage.
Exclude:
energy expenses covered in your rental and leasing contracts
telephone, Internet and other telecommunications
vehicle fuel (report at All other costs and expenses).
g. Office and computer related expenses
Include:
office stationery and supplies, paper and other supplies for photocopiers, printers and fax machines
postage and courier (used in the day to day office business activity)
computer and peripherals upgrade expenses
data processing.
Exclude telephone, Internet and other telecommunication expenses (report at Telephone, Internet and other telecommunication).
h. Telephone, Internet and other telecommunication
Include:
internet
telephone and telecommunications
cellular telephone
fax machine
pager.
i. Business taxes, licenses and permits
Include:
property taxes paid directly and property transfer taxes
vehicle license fees
beverage taxes and business taxes
trade license fees
membership fees and professional license fees
provincial capital tax.
j. Royalties, franchise fees and memberships
Include:
amounts paid to holders of patents, copyrights, performing rights and trademarks
gross overriding royalty expenses and direct royalty costs
resident and non-resident royalty expenses
franchise fees.
Exclude Crown royalties
k. Crown charges
Federal or Provincial royalty, tax, lease or rental payments made in relation to the acquisition, development or ownership of Canadian resource properties.
Include:
Crown royalties
Crown leases and rentals
oil sand leases
stumpage fees.
l. Rental and leasing
Include:
lease rental expenses, real estate rental expenses, condominium fees and equipment rental expenses
motor vehicle rental and leasing expenses
studio lighting and scaffolding
machinery and equipment rental expenses
storage expenses
road and construction equipment rental
fuel and other utility costs covered in your rental and leasing contracts.
m. Repair and maintenance
Include:
buildings and structures
machinery and equipment
security equipment
vehicles
costs related to materials, parts and external labour associated with these expenses
janitorial and cleaning services and garbage removal.
n. Amortization and depreciation
Include:
direct cost depreciation of tangible assets and amortization of leasehold improvements
amortization of intangible assets (e.g., amortization of goodwill, patents, franchises, copyrights, trademarks, deferred charges, organizational costs).
o. Insurance
Insurance recovery income should be deducted from insurance expenses.
Include:
professional and other liability insurance
motor vehicle and property insurance
executive life insurance
bonding, business interruption insurance and fire insurance.
p. Advertising, marketing, promotion, meals and entertainment
Include:
newspaper advertising and media expenses
catalogues, presentations and displays
tickets for theatre, concerts and sporting events for business promotion
fundraising expenses
meals, entertainment and hospitality purchases for clients.
exploration and development (including prospect/geological, well abandonment and dry holes, exploration expenses, development expenses)
amounts not included in sub-questions a. to t. above.
Total expenses
The sum of sub-questions a. to u.
For the reporting period of YYYY-MM-DD to YYYY-MM-DD, what were this business's expenses for the following items?
Table summary
This table contains no data. It is an example of an empty data table used by respondents to provide data to Statistics Canada.
CAN$ '000
a. Cost of goods sold
a1. Opening inventories
a2. Purchases
Include raw materials, goods purchased for resale and non-returnable containers. Exclude change in inventories.
a3. Closing inventories
a4. Cost of goods sold
Opening inventories plus purchases minus closing inventories.
b. Employment costs and expenses
Include all employees who were issued a T4. Exclude commissions to be paid to non-employees, report at sub-question c.
b1. Salaries, wages and commissions
b2. Employee benefits
c. Subcontracts
Include commissions to non-employees. Exclude research and development.
d. Research and development fees
Exclude in-house research and development.
e. Professional and business fees
e.g., legal, accounting, consulting, scientific and property management fees
f. Utilities
e.g., electricity, water, gas
g. Office and computer related expenses e.g., office supplies, postage, computer upgrades
h. Telephone, Internet and other telecommunication
i. Business taxes, licenses and permits
e.g., beverage tax, business tax, license fees, property taxes
j. Royalties, franchise fees and memberships
Exclude Crown royalties.
k. Crown charges (for logging, mining and energy industries only)
l. Rental and leasing
Include land buildings, equipment, vehicles.
m. Repair and maintenance
Include buildings, equipment, vehicles.
n. Amortization and depreciation
o. Insurance
p. Advertising, marketing, promotion, meals and entertainment
q. Travel, meetings and conventions
r. Financial services
e.g., bank charges, transaction fees
s. Interest expense
t. Other non-production-related costs and expenses
Include bad debts, loan losses, donations, political contributions and inventory write-down.
u. All other costs and expenses
Include intracompany expenses. Specify all other costs and expenses:
Total expenses
Industry characteristics
1. What were this business's sales for each of the following goods and services?
Exclude royalties and license fees.
Report in thousands of Canadian dollars.
What were this business's sales for each of the following goods and services?
Table summary
This table contains no data. It is an example of an empty data table used by respondents to provide data to Statistics Canada.
CAN$ '000
a. Motion picture film laboratory services
b. Editing services for audiovisual works
c. Transfer services
d. Colour correction and digital restoration services
e. Virtual Reality and augmented reality services
f. 3D visual effects and animation services for audiovisual works
g. Visual effects and animation services for audiovisual works
h. Subtitling, titling and captioning services
i. DVD and Blu-ray authoring services
j. Format conversion services, digital encoding and conversion
k. Duplication and copying services, except large run, for audiovisual works, digital and video
l. Sound editing and design services for sound elements of audiovisual works
Total post-production sales
m. Contract production of audiovisual works
n. All other sales
Total sales of goods and services
Industry characteristics
2. Of the total sales of goods and services reported in question 1, provide a breakdown for the domestic and foreign total sales.
Exclude royalties and license fees.
Report in thousands of Canadian dollars.
Of the total sales of goods and services reported in question 1, provide a breakdown for the domestic and foreign total sales.
Table summary
This table contains no data. It is an example of an empty data table used by respondents to provide data to Statistics Canada.
CAN$ '000
Total sales domestic
Total sales foreign
Total sales domestic and foreign
3. Of the total post-production sales reported in question 1, provide a breakdown of the total post-production sales by type of client (first point of sale).
Exclude royalties and license fees
Report in thousands of Canadian dollars.
Of the total post-production sales reported in question 1, provide a breakdown of the total post-production sales by type of client (first point of sale).
Table summary
This table contains no data. It is an example of an empty data table used by respondents to provide data to Statistics Canada.
CAN$ '000
a. Advertising agencies and public relations firms
b. Production companies
c. Broadcasters
d. Distributors and wholesalers
e. All other post-production sales
Total post-production sales
Sales by type of client
1. What was this business's breakdown of sales by the following types of client?
Sales by type of client
This section is designed to measure which sector of the economy purchases your services.
Please provide a percentage breakdown of your sales by type of client.
Please ensure that the sum of percentages reported in this section equals 100%.
a. to c. Clients in Canada
a. Individuals and households
Please report the percentage of sales to individuals and households who do not represent the business or government sector.
b. Businesses
Percentage of sales sold to the business sector should be reported here.
Include sales to Crown corporations.
c. Governments, not-for-profit organizations and public institutions (e.g., hospitals, schools)
Percentage of sales to federal, provincial, territorial and municipal governments should be reported here.
Include: sales to hospitals, schools, universities and public utilities.
d. Clients outside Canada
Please report the percentage of total sales to customers or clients located outside Canada including foreign businesses, foreign individuals, foreign institutions and/or governments.
Include sales to foreign subsidiaries and affiliates.
What was this business's breakdown of sales by the following types of client?
Table summary
This table contains no data. It is an example of an empty data table used by respondents to provide data to Statistics Canada.
Percentage
a. Clients in Canada - individuals and households
b. Clients in Canada - businesses
c. Clients in Canada - governments, not-for-profit organizations and public institutions e.g., hospitals and schools
d. Clients outside Canada
Total percentage
Sales by consumer location
1. What was the percentage breakdown of this business's sales by consumer location?
Consumer location is the location where the goods or services will ultimately be used.
If ultimate consumer location is not known, the following are acceptable substitutes:
shipping destination
client's billing address
location of this business's retail customers
location of this business's warehouse/distribution centres.
What was the percentage breakdown of this business's sales by consumer location?
Table summary
This table contains no data. It is an example of an empty data table used by respondents to provide data to Statistics Canada.
Percentage
Newfoundland and Labrador
Prince Edward Island
Nova Scotia
New Brunswick
Quebec
Ontario
Manitoba
Saskatchewan
Alberta
British Columbia
Yukon
Northwest Territories
Nunavut
United States
All other countries
Total percentage
Sales by consumer location
International transactions - revenue received from exports
1. During the reporting period of YYYY-MM-DD to YYYY-MM-DD, did this business receive revenue from clients outside Canada for the sale of products, services, royalties, rights, licensing or franchise fees?
This section is intended to measure the value of international transactions on goods, services, royalties and licensing fees. It covers imported services and goods purchased outside Canada as well as the value of exported services and goods to clients/customers outside Canada. Please report also royalties, rights, licensing and franchise fees paid to and/or received from outside Canada. Services cover a variety of industrial, professional, trade and business services.
Yes
No
2. What was the revenue received from clients outside Canada?
This section is intended to measure the value of international transactions on goods, services, royalties and licensing fees. It covers imported services and goods purchased outside Canada as well as the value of exported services and goods to clients/customers outside Canada. Please report also royalties, rights, licensing and franchise fees paid to and/or received from outside Canada. Services cover a variety of industrial, professional, trade and business services.
Revenue received (CAN$ '000)
3. What was the percentage breakdown of revenue received from clients outside Canada by goods, services and royalties?
This section is intended to measure the value of international transactions on goods, services, royalties and licensing fees. It covers imported services and goods purchased outside Canada as well as the value of exported services and goods to clients/customers outside Canada. Please report also royalties, rights, licensing and franchise fees paid to and/or received from outside Canada. Services cover a variety of industrial, professional, trade and business services.
What was the percentage breakdown of revenue received from clients outside Canada by goods, services and royalties?
Table summary
This table contains no data. It is an example of an empty data table used by respondents to provide data to Statistics Canada.
Percentage
Goods
Services
Royalties, rights, licensing and franchise fees
Total percentage
4. What was the percentage breakdown of revenue received from clients outside Canada by country?
This section is intended to measure the value of international transactions on goods, services, royalties and licensing fees. It covers imported services and goods purchased outside Canada as well as the value of exported services and goods to clients/customers outside Canada. Please report also royalties, rights, licensing and franchise fees paid to and/or received from outside Canada. Services cover a variety of industrial, professional, trade and business services.
What was the percentage breakdown of revenue received from clients outside Canada by country?
Table summary
This table contains no data. It is an example of an empty data table used by respondents to provide data to Statistics Canada.
Percentage
United States
Mexico
Provide the percentage of revenue received from any other countries - top 4 clients only
Other country 1
Other country 2
Other country 3
Other country 4
Total percentage
International transactions - purchases from outside Canada (imports)
5. During the reporting period of YYYY-MM-DD to YYYY-MM-DD, did this business make payments to suppliers outside Canada for the purchase of products, services, royalties, rights, licensing or franchise fees?
This section is intended to measure the value of international transactions on goods, services, royalties and licensing fees. It covers imported services and goods purchased outside Canada as well as the value of exported services and goods to clients/customers outside Canada. Please report also royalties, rights, licensing and franchise fees paid to and/or received from outside Canada. Services cover a variety of industrial, professional, trade and business services.
Yes
No
6. What were the payments made to suppliers outside Canada?
This section is intended to measure the value of international transactions on goods, services, royalties and licensing fees. It covers imported services and goods purchased outside Canada as well as the value of exported services and goods to clients/customers outside Canada. Please report also royalties, rights, licensing and franchise fees paid to and/or received from outside Canada. Services cover a variety of industrial, professional, trade and business services.
Payments made (CAN$ '000)
7. What was the percentage breakdown of payments made to suppliers outside Canada by goods, services and royalties?
This section is intended to measure the value of international transactions on goods, services, royalties and licensing fees. It covers imported services and goods purchased outside Canada as well as the value of exported services and goods to clients/customers outside Canada. Please report also royalties, rights, licensing and franchise fees paid to and/or received from outside Canada. Services cover a variety of industrial, professional, trade and business services.
What was the percentage breakdown of payments made to suppliers outside Canada by goods, services and royalties?
Table summary
This table contains no data. It is an example of an empty data table used by respondents to provide data to Statistics Canada.
Percentage
Goods
Services
Royalties, rights, licensing and franchise fees
Total percentage
8. What was the percentage breakdown of payments made to suppliers outside Canada by country?
This section is intended to measure the value of international transactions on goods, services, royalties and licensing fees. It covers imported services and goods purchased outside Canada as well as the value of exported services and goods to clients/customers outside Canada. Please report also royalties, rights, licensing and franchise fees paid to and/or received from outside Canada. Services cover a variety of industrial, professional, trade and business services.
What was the percentage breakdown of payments made to suppliers outside Canada by country?
Table summary
This table contains no data. It is an example of an empty data table used by respondents to provide data to Statistics Canada.
Percentage
United States
Mexico
Provide the percentage of payments made to any other countries - top 4 suppliers only
Other 1 - specify
Other 2 - specify
Other 3 - specify
Other 4 - specify
Total percentage
Notification of intent to extract web data
1. Does this business have a website?
Yes
Specify the business website address 1
Specify the business website address 2
Specify the business website address 3
No
Notification of intent to extract web data
Statistics Canada engages in web-data extraction, also known as web scraping, which is a process by which information is gathered and copied from the Web using automated scripts or robots, for retrieval and analysis. As a result, we may visit the website for this business or organization to search for and compile additional information. The use of web scraping is part of a broader effort to reduce the response burden on businesses or organizations, as well as produce additional statistical indicators to ensure that our data remain accurate and relevant.
We will strive to ensure that the data collection does not interfere with the functionality of the website. Any data collected will be used by Statistics Canada for statistical and research purposes only, in accordance with the agency's privacy and confidentiality mandate. All information collected by Statistics Canada is strictly protected.
If you have any questions or concerns, please contact Statistics Canada Client Services, toll-free at 1-877-949-9492 (TTY: 1-800-363-7629) or by email at infostats@statcan.gc.ca- this link will open in a new window. Additional information about this survey can be found by selecting the following link: Information for survey participants (ISP).
Changes or events
1. Indicate any changes or events that affected the reported values for this business or organization, compared with the last reporting period.
Select all that apply.
Strike or lock-out
Exchange rate impact
Price changes in goods or services sold
Contracting out
Organizational change
Price changes in labour or raw materials
Natural disaster
Recession
Change in product line
Sold business or business units
Expansion
New or lost contract
Plant closures
Acquisition of business or business units
Other
Specify the other changes or events:
No changes or events
Contact person
2. Statistics Canada may need to contact the person who completed this questionnaire for further information. Is the provided given names and the provided family name the best person to contact?
Yes
No
Who is the best person to contact about this questionnaire?
First name:
Last name:
Title:
Email address:
Telephone number (including area code):
Extension number (if applicable):
The maximum number of characters is 5.
Fax number (including area code):
Feedback
3. How long did it take to complete this questionnaire?
Include the time spent gathering the necessary information.
Hours:
Minutes:
4. Do you have any comments about this questionnaire?
This survey is conducted by Statistics Canada in order to collect the necessary information to support the Integrated Business Statistics Program (IBSP). This program combines various survey and administrative data to develop comprehensive measures of the Canadian economy.
The statistical information from the IBSP serves many purposes, including:
calculating each province and territory's fair share of federal-provincial transfer payments for health, education and social programs
establishing government programs to assist businesses
assisting the business community in negotiating contracts and collective agreements
supporting the government in making informed decisions about fiscal, monetary and foreign exchange policies
indexing social benefit programs and determining tax brackets
enabling academics and economists to analyze the economic performance of Canadian industries and to better understand rapidly evolving business environments.
Your information may also be used by Statistics Canada for other statistical and research purposes.
Your participation in this survey is required under the authority of the Statistics Act.
Other important information
Authorization to collect this information
Data are collected under the authority of the Statistics Act, Revised Statutes of Canada, 1985, Chapter S-19.
Confidentiality
By law, Statistics Canada is prohibited from releasing any information it collects that could identify any person, business, or organization, unless consent has been given by the respondent, or as permitted by the Statistics Act. Statistics Canada will use the information from this survey for statistical purposes only.
Record linkages
To enhance the data from this survey and to reduce the reporting burden, Statistics Canada may combine the acquired data with information from other surveys or from administrative sources.
Data-sharing agreements
To reduce respondent burden, Statistics Canada has entered into data-sharing agreements with provincial and territorial statistical agencies and other government organizations, which have agreed to keep the data confidential and use them only for statistical purposes. Statistics Canada will only share data from this survey with those organizations that have demonstrated a requirement to use the data.
Section 11 of the Statistics Act provides for the sharing of information with provincial and territorial statistical agencies that meet certain conditions. These agencies must have the legislative authority to collect the same information, on a mandatory basis, and the legislation must provide substantially the same provisions for confidentiality and penalties for disclosure of confidential information as the Statistics Act. Because these agencies have the legal authority to compel businesses to provide the same information, consent is not requested and businesses may not object to the sharing of the data.
For this survey, there are Section 11 agreements with the provincial and territorial statistical agencies of Newfoundland and Labrador, Nova Scotia, New Brunswick, Québec, Ontario, Manitoba, Saskatchewan, Alberta, British Columbia and the Yukon. The shared data will be limited to information pertaining to business establishments located within the jurisdiction of the respective province or territory.
Section 12 of the Statistics Act provides for the sharing of information with federal, provincial or territorial government organizations. Under Section 12, you may refuse to share your information with any of these organizations by writing a letter of objection to the Chief Statistician, specifying the organizations with which you do not want Statistics Canada to share your data and mailing it to the following address:
Chief Statistician of Canada
Statistics Canada
Attention of Director, Enterprise Statistics Division
150 Tunney's Pasture Driveway
Ottawa, Ontario
K1A 0T6
For this survey, there are Section 12 agreements with the statistical agencies of Prince Edward Island, the Northwest Territories and Nunavut.
For agreements with provincial and territorial government organizations, the shared data will be limited to information pertaining to business establishments located within the jurisdiction of the respective province or territory.
Business or organization and contact information
1. Verify or provide the business or organization's legal and operating name and correct where needed.
Note: Legal name modifications should only be done to correct a spelling error or typo.
Legal Name
The legal name is one recognized by law, thus it is the name liable for pursuit or for debts incurred by the business or organization. In the case of a corporation, it is the legal name as fixed by its charter or the statute by which the corporation was created.
Modifications to the legal name should only be done to correct a spelling error or typo.
To indicate a legal name of another legal entity you should instead indicate it in question 3 by selecting 'Not currently operational' and then choosing the applicable reason and providing the legal name of this other entity along with any other requested information.
Operating Name
The operating name is a name the business or organization is commonly known as if different from its legal name. The operating name is synonymous with trade name.
Legal name
Operating name (if applicable)
2. Verify or provide the contact information of the designated business or organization contact person for this questionnaire and correct where needed.
Note: The designated contact person is the person who should receive this questionnaire. The designated contact person may not always be the one who actually completes the questionnaire.
First name
Last name
Title
Preferred language of communication
English
French
Mailing address (number and street)
City
Province, territory or state
Postal code or ZIP code
Country
Canada
United States
Email address
Telephone number (including area code)
Extension number (if applicable)
The maximum number of characters is 10.
Fax number (including area code)
3. Verify or provide the current operational status of the business or organization identified by the legal and operating name above.
Operational
Not currently operational
Why is this business or organization not currently operational?
Seasonal operations
When did this business or organization close for the season?
Date
When does this business or organization expect to resume operations?
Date
Ceased operations
When did this business or organization cease operations?
Date
Why did this business or organization cease operations?
Bankruptcy
Liquidation
Dissolution
Other - Specify the other reasons for ceased operations
Sold operations
When was this business or organization sold?
Date
What is the legal name of the buyer?
Amalgamated with other businesses or organizations
When did this business or organization amalgamate?
Date
What is the legal name of the resulting or continuing business or organization?
What are the legal names of the other amalgamated businesses or organizations?
Temporarily inactive but will re-open
When did this business or organization become temporarily inactive?
Date
When does this business or organization expect to resume operations?
Date
Why is this business or organization temporarily inactive?
No longer operating due to other reasons
When did this business or organization cease operations?
Date
Why did this business or organization cease operations?
4. Verify or provide the current main activity of the business or organization identified by the legal and operating name above.
Note: The described activity was assigned using the North American Industry Classification System (NAICS).
This question verifies the business or organization's current main activity as classified by the North American Industry Classification System (NAICS). The North American Industry Classification System (NAICS) is an industry classification system developed by the statistical agencies of Canada, Mexico and the United States. Created against the background of the North American Free Trade Agreement, it is designed to provide common definitions of the industrial structure of the three countries and a common statistical framework to facilitate the analysis of the three economies. NAICS is based on supply-side or production-oriented principles, to ensure that industrial data, classified to NAICS, are suitable for the analysis of production-related issues such as industrial performance.
The target entity for which NAICS is designed are businesses and other organizations engaged in the production of goods and services. They include farms, incorporated and unincorporated businesses and government business enterprises. They also include government institutions and agencies engaged in the production of marketed and non-marketed services, as well as organizations such as professional associations and unions and charitable or non-profit organizations and the employees of households.
The associated NAICS should reflect those activities conducted by the business or organizational units targeted by this questionnaire only, as identified in the 'Answering this questionnaire' section and which can be identified by the specified legal and operating name. The main activity is the activity which most defines the targeted business or organization's main purpose or reason for existence. For a business or organization that is for-profit, it is normally the activity that generates the majority of the revenue for the entity.
The NAICS classification contains a limited number of activity classifications; the associated classification might be applicable for this business or organization even if it is not exactly how you would describe this business or organization's main activity.
Please note that any modifications to the main activity through your response to this question might not necessarily be reflected prior to the transmitting of subsequent questionnaires and as a result they may not contain this updated information.
The following is the detailed description including any applicable examples or exclusions for the classification currently associated with this business or organization.
Description and examples
This is the current main activity
This is not the current main activity
Provide a brief but precise description of this business or organization's main activity
e.g., breakfast cereal manufacturing, shoe store, software development
Main activity
5. You indicated that is not the current main activity.
Was this business or organization's main activity ever classified as: ?
Yes
When did the main activity change?
Date
No
6. Search and select the industry classification code that best corresponds to this business or organization's main activity.
Select this business or organization's activity sector (optional)
Farming or logging operation
Construction company or general contractor
Manufacturer
Wholesaler
Retailer
Provider of passenger or freight transportation
Provider of investment, savings or insurance products
Real estate agency, real estate brokerage or leasing company
Provider of professional, scientific or technical services
Provider of health care or social services
Restaurant, bar, hotel, motel or other lodging establishment
Other sector
7. You have indicated that the current main activity of this business or organization is:
Main activity
Are there any other activities that contribute significantly (at least 10%) to this business or organization's revenue?
Yes, there are other activities
No, that is the only significant activity
Provide a brief but precise description of this business or organization's secondary activity
e.g., breakfast cereal manufacturing, shoe store, software development
8. Approximately what percentage of this business or organization's revenue is generated by each of the following activities?
When precise figures are not available, provide your best estimates.
Approximately what percentage of this business or organization's revenue is generated by each of the following activities?
Table summary
This table contains no data. It is an example of an empty data table used by respondents to provide data to Statistics Canada.
Percentage of revenue
Main activity
Secondary activity
All other activities
Total percentage
Reporting period information
1. What are the start and end dates of this business's or organization's most recently completed fiscal year?
For this survey, the end date should fall between April 1, 2023 and March 31, 2024.
Here are twelve common fiscal periods that fall within the targeted dates:
May 1, 2022 to April 30, 2023
June 1, 2022 to May 31, 2023
July 1, 2022 to June 30, 2023
August 1, 2022 to July 31, 2023
September 1, 2022 to August 31, 2023
October 1, 2022 to September 30, 2023
November 1, 2022 to October 31, 2023
December 1, 2022 to November 30, 2023
January 1, 2023 to December 31, 2023
February 1, 2023 to January 31, 2024
March 1, 2023 to February 28, 2024
April 1, 2023 to March 31, 2024.
Here are other examples of fiscal periods that fall within the required dates:
September 18, 2022 to September 15, 2023 (e.g., floating year-end)
June 1, 2023 to December 31, 2023 (e.g., a newly opened business).
Fiscal year start date
Fiscal year-end date
2. What is the reason the reporting period does not cover a full year?
Select all that apply.
Seasonal operations
New business
Change of ownership
Temporarily inactive
Change of fiscal year
Ceased operations
Other
Specify reason the reporting period does not cover a full year
Additional reporting instructions
1. Throughout this questionnaire, please report financial information in thousands of Canadian dollars.
For example, an amount of $763,880.25 should be reported as:
CAN$ '000: $764,000
I will report in the format above
Revenue
1. For the reporting period of YYYY-MM-DD to YYYY-MM-DD, what was this business's revenue from each of the following sources?
Notes:
a detailed breakdown may be requested in other sections
these questions are asked of many different industries. Some questions may not apply to this business
Report dollar amounts in thousands of Canadian dollars.
Revenue
a. Sales of goods and services (e.g., fees, commissions, services revenue)
Report net of returns and allowances.
Sales of goods and services are defined as amounts derived from the sale of goods and services (cash or credit), falling within a business's ordinary activities. Sales should be reported net of trade discount, value added tax and other taxes based on sales.
Include:
sales from Canadian locations (domestic and export sales)
transfers to other business units or a head office of your firm.
Exclude:
transfers into inventory and consignment sales
federal, provincial and territorial sales taxes and excise duties and taxes
intercompany sales in consolidated financial statements.
b. Rental and leasing
Include rental or leasing of apartments, commercial buildings, land, office space, residential housing, investments in co-tenancies and co-ownerships, hotel or motel rooms, long and short term vehicle leasing, machinery or equipment, storage lockers, etc.
c. Commissions
Include commissions earned on the sale of products or services by businesses such as advertising agencies, brokers, insurance agents, lottery ticket sales, sales representatives and travel agencies - compensation could also be reported under this item (for example, compensation for collecting sales tax).
d. Subsidies (including grants, donations, fundraising and sponsorships)
Include:
non-repayable grants, contributions and subsidies from all levels of government
revenue from private sector (corporate and individual) sponsorships, donations and fundraising.
e. Royalties, rights, licensing and franchise fees
A royalty is defined as a payment received by the holder of a copyright, trademark or patent.
Include revenue received from the sale or use of all intellectual property rights of copyrighted materials such as musical, literary, artistic or dramatic works, sound recordings or the broadcasting of communication signals.
f. Dividends
Include:
dividend income
dividends from Canadian sources
dividends from foreign sources
patronage dividends.
Exclude equity income from investments in subsidiaries or affiliates.
g. Interest
Include:
investment revenue
interest from foreign sources
interest from Canadian bonds and debentures
interest from Canadian mortgage loans
interest from other Canadian sources.
Exclude equity income from investments in subsidiaries or affiliates.
h. All other revenue (Include intracompany transfers)
Include amounts not included in questions a. to g.
Total revenue
The sum of sub-questions a. to h.
For the reporting period of YYYY-MM-DD to YYYY-MM-DD, what was this business's revenue from each of the following sources?
Table summary
This table contains no data. It is an example of an empty data table used by respondents to provide data to Statistics Canada.
CAN$ '000
a. Sales of goods and services
Include sales, commissions, rental and leasing revenue if they are this business's primary revenue source.
b. Rental and leasing
Report only if this is a secondary revenue source. If rental and leasing are your primary revenue source, report at question a.
c. Commissions
Report only if this is a secondary revenue source. If commissions are your primary revenue source, report at question a.
d. Subsidies
Include grants, donations, fundraising and sponsorships.
e. Royalties, rights, licensing and franchise fees
f. Dividends
g. Interest
h. Other
Include intracompany transfers.
Specify all other revenue:
Total revenue
Expenses
1. For the reporting period of YYYY-MM-DD to YYYY-MM-DD, what were this business's expenses for the following items?
Notes:
a detailed breakdown may be requested in other sections
these questions are asked of many different industries. Some questions may not apply to this business
Report dollar amounts in thousands of Canadian dollars.
Expenses
a. Cost of goods sold
Many business units distinguish their costs of materials from their other business expenses (selling, general and administrative). This item is included to allow you to easily record your costs/expenses according to your normal accounting practices.
Include:
cost of raw materials and/or goods purchased for resale - net of discounts earned on purchases
freight in and duty.
Exclude all costs associated with salaries, wages, benefits, commissions and subcontracts (report at Employment costs and expenses, and Subcontracts).
b. Employment costs and expenses
b1. Salaries, wages and commissions
Please report all salaries and wages (including taxable allowances and employment commissions as defined on the T4 - Statement of Remuneration Paid) before deductions for this reporting period.
Include:
vacation pay
bonuses (including profit sharing)
employee commissions
taxable allowances (e.g., room and board, vehicle allowances, gifts such as airline tickets for holidays)
severance pay.
Exclude all payments and expenses associated with casual labour and outside contract workers (report at Subcontracts).
b2. Employee benefits
Include contributions to:
health plans
insurance plans
employment insurance
pension plans
workers' compensation
association dues
contributions to any other employee benefits such as child care and supplementary unemployment benefit (SUB) plans
contributions to provincial and territorial health and education payroll taxes.
c. Subcontracts
Subcontract expense refers to the purchasing of services from outside of the company rather than providing them in-house.
Include:
hired casual labour and outside contract workers
custom work and contract work
subcontract and outside labour
hired labour.
d. Research and development fees
Expenses from activities conducted with the intention of making a discovery that could either lead to the development of new products or procedures, or to the improvement of existing products or procedures.
e. Professional and business fees
Include:
legal services
accounting and auditing fees
consulting fees
education and training fees
appraisal fees
management and administration fees
property management fees
information technology (IT) consulting and service fees (purchased)
architectural fees
engineering fees
scientific and technical service fees
other consulting fees (management, technical and scientific)
veterinary fees
fees for human health services
payroll preparation fees
all other professional and business service fees.
Exclude service fees paid to Head Office (report at All other costs and expenses).
f. Utilities
Utility expenses related to operating your business unit such as water, electricity, gas, heating and hydro.
Include:
diesel, fuel wood, natural gas, oil and propane
sewage.
Exclude:
energy expenses covered in your rental and leasing contracts
telephone, Internet and other telecommunications
vehicle fuel (report at All other costs and expenses).
g. Office and computer related expenses
Include:
office stationery and supplies, paper and other supplies for photocopiers, printers and fax machines
postage and courier (used in the day to day office business activity)
computer and peripherals upgrade expenses
data processing.
Exclude telephone, Internet and other telecommunication expenses (report at Telephone, Internet and other telecommunication).
h. Telephone, Internet and other telecommunication
Include:
internet
telephone and telecommunications
cellular telephone
fax machine
pager.
i. Business taxes, licenses and permits
Include:
property taxes paid directly and property transfer taxes
vehicle license fees
beverage taxes and business taxes
trade license fees
membership fees and professional license fees
provincial capital tax.
j. Royalties, franchise fees and memberships
Include:
amounts paid to holders of patents, copyrights, performing rights and trademarks
gross overriding royalty expenses and direct royalty costs
resident and non-resident royalty expenses
franchise fees.
Exclude Crown royalties
k. Crown charges
Federal or Provincial royalty, tax, lease or rental payments made in relation to the acquisition, development or ownership of Canadian resource properties.
Include:
Crown royalties
Crown leases and rentals
oil sand leases
stumpage fees.
l. Rental and leasing
Include:
lease rental expenses, real estate rental expenses, condominium fees and equipment rental expenses
motor vehicle rental and leasing expenses
studio lighting and scaffolding
machinery and equipment rental expenses
storage expenses
road and construction equipment rental
fuel and other utility costs covered in your rental and leasing contracts.
m. Repair and maintenance
Include:
buildings and structures
machinery and equipment
security equipment
vehicles
costs related to materials, parts and external labour associated with these expenses
janitorial and cleaning services and garbage removal.
n. Amortization and depreciation
Include:
direct cost depreciation of tangible assets and amortization of leasehold improvements
amortization of intangible assets (e.g., amortization of goodwill, patents, franchises, copyrights, trademarks, deferred charges, organizational costs).
o. Insurance
Insurance recovery income should be deducted from insurance expenses.
Include:
professional and other liability insurance
motor vehicle and property insurance
executive life insurance
bonding, business interruption insurance and fire insurance.
p. Advertising, marketing, promotion, meals and entertainment
Include:
newspaper advertising and media expenses
catalogues, presentations and displays
tickets for theatre, concerts and sporting events for business promotion
fundraising expenses
meals, entertainment and hospitality purchases for clients.
exploration and development (including prospect/geological, well abandonment and dry holes, exploration expenses, development expenses)
amounts not included in sub-questions a. to t. above.
Total expenses
The sum of sub-questions a. to u.
For the reporting period of YYYY-MM-DD to YYYY-MM-DD, what were this business's expenses for the following items?
Table summary
This table contains no data. It is an example of an empty data table used by respondents to provide data to Statistics Canada.
CAN$ '000
a. Cost of goods sold
a1. Opening inventories
a2. Purchases
Include raw materials, goods purchased for resale and non-returnable containers.
Exclude change in inventories.
a3. Closing inventories
a4. Cost of goods sold
Opening inventories plus purchases minus closing inventories.
b. Employment costs and expenses
Include all employees who were issued a T4.
Exclude commissions to be paid to non-employees, report at sub-question c.
b1. Salaries, wages and commissions
b2. Employee benefits
c. Subcontracts
Include commissions to non-employees.
Exclude research and development.
d. Research and development fees.
Exclude in-house research and development.
e. Professional and business fees
e.g., legal, accounting, consulting, scientific and property management fees
f. Utilities
e.g., electricity, water, gas
g. Office and computer related expenses
e.g., office supplies, postage, computer upgrades
h. Telephone, Internet and other telecommunication
i. Business taxes, licenses and permits
e.g., beverage tax, business tax, license fees, property taxes
j. Royalties, franchise fees and memberships
Exclude Crown royalties.
k. Crown charges
(for logging, mining and energy industries only)
l. Rental and leasing
Include land buildings, equipment, vehicles.
m. Repair and maintenance
Include buildings, equipment, vehicles.
n. Amortization and depreciation
o. Insurance
p. Advertising, marketing, promotion, meals and entertainment
q. Travel, meetings and conventions
r. Financial services
e.g., bank charges, transaction fees
s. Interest expense
t. Other non-production-related costs and expenses
Include bad debts, loan losses, donations, political contributions and inventory write-down.
u. All other costs and expenses
Include intracompany expenses.
Specify all other costs and expenses:
Total expenses
Industry characteristics
1. What were this business's sales for each of the following goods and services?
Please report all amounts in thousands of Canadian dollars.
Engineering services
a. Residential building engineering projects
All engineering services related to new and existing homes, row housing, apartments, etc., and mixed-use buildings that are predominantly used for residential housing.
Include:
The provision of designs, plans and studies related to residential building projects
Engineering advisory services that are related to a specific residential building project
Engineering design services for residential building design-build projects that are provided on a subcontract basis.
Exclude:
Engineering advisory services that are not related to a specific project (report at question 1l)
Design-build contracts, in which the contracts cover both the engineering design and construction elements (report at question 1o).
b. Commercial, public and institutional building engineering projects
All engineering services related to new and existing commercial, public, and institutional buildings, including mixed-use buildings that are predominantly used for commercial, public, or institutional purposes.
Include:
Office buildings, shopping centers, hotels, restaurants, service stations, warehouses, bus and truck terminals, hospitals, schools, churches, prisons, stadiums and arenas, libraries and museums
The provision of designs, plans and studies related to commercial, public and institutional building projects
Engineering advisory services that are related to a specific commercial, public or institutional building project
Engineering design services for commercial, public or institutional building design-build projects that are provided on a subcontract basis.
Exclude:
Engineering advisory services that are not related to a specific project (report at question 1l)
Design-build contracts, in which the contracts cover both the engineering design and construction elements (report at question 1o).
Industrial and manufacturing engineering projects
c. Mining and metallurgical plant and process engineering projects
All engineering services related to mining and metallurgical facilities and processes.
Include:
Integrated facility and process engineering projects
All engineering services related to mining and metallurgical processes, such as mineral extraction, smelting, refining and metal forming.
d. Petroleum and petrochemical plant and process engineering projects
All engineering services related to petroleum and petrochemical facilities and processes, such as oil and gas platforms, refineries, pipelines and petrochemical plants
Include:
Integrated facility and process engineering projects
All engineering services related to processes for the production of petroleum and petrochemicals, such as extraction, refining, formulation and mixing.
e. Industrial machinery engineering design projects
All engineering services related to the design of industrial machinery.
Include machinery design for industries such as:
agriculture
construction
mining
metalworking
commercial and service industries
heating, ventilating and air-conditioning
power transmission machinery.
f. Other industrial and manufacturing engineering projects
All engineering services related to the design of industrial and manufactured products not elsewhere classified.
Other engineering services
g. Transportation engineering projects (e.g., road, rail, air, marine)
All engineering services related to highways, roads, streets, bridges, tunnels, railways, subways, airports, harbours, canals and locks and other transportation infrastructure.
Include:
The provision of designs, plans and studies related to transportation projects
Engineering advisory services that are related to a specific transportation project
Engineering design services for a transportation design-build project that are provided on a subcontract basis.
Exclude:
Engineering advisory services not related to a specific project (report at question 1l)
Design-build contracts in which the contracts cover both the engineering design and construction elements (report at question 1o).
h. Municipal utility engineering projects
All engineering services related to municipal utilities.
Include:
The provision of designs, plans and studies related to municipal utility projects
Engineering advisory services that are related to a specific municipal utility project
Engineering design services for a municipal utility design-build project that are provided on a subcontract basis.
Exclude:
Engineering advisory services that are not related to a specific project (report at question 1l)
Design-build contracts, in which the contracts cover both the engineering design and construction elements (report at question 1o).
i. Power generation, transmission and distribution engineering projects
All engineering services related to power generating units, power transmission, distribution lines and related infrastructure.
Include:
The provision of designs, plans and studies related to power projects
Engineering advisory services that are related to a specific power project
Engineering design services for a power design-build project that are provided on a subcontract basis.
Exclude:
Engineering advisory services that are not related to a specific project (report at question 1l)
Design-build contracts, in which the contracts cover both the engineering design and construction elements (report at question 1o)
j. Telecommunications and broadcasting engineering projects
All engineering services related to systems for the transmission or distribution of voice, data and programming.
Include:
The provision of designs, plans and studies related to telecommunications and broadcasting projects
Engineering advisory services that are related to a specific telecommunications or broadcasting project
Engineering design services for a telecommunications or broadcasting design-build project that are provided on a subcontract basis.
Exclude:
Engineering advisory services that are not related to a specific project (report at question 1l)
Design-build contracts, in which the contracts cover both the engineering design and construction elements (report at question 1o).
k. Hazardous and industrial waste engineering projects
All engineering services related to systems for the collection, treatment and disposal of hazardous and industrial waste and the control of pollution.
Include:
The provision of designs, plans and studies related to hazardous and industrial waste projects
Engineering advisory services that are related to a specific hazardous or industrial waste project
Engineering design services for a hazardous or industrial waste design-build project that are provided on a subcontract basis.
Exclude:
Engineering advisory services that are not related to a specific project (report at question 1l)
Design-build contracts, in which the contracts cover both the engineering design and construction elements (report at question 1o).
l. Engineering advisory services (e.g., expert witness, forensic investigation, etc.)
The provision of advice, studies and reports on engineering matters, except when the advice relates to a specific project. Advice, studies and reports provided in conjunction with a project are classified based on the project type.
Include:
policy analysis
regulatory studies
audits
forensic investigations
expert witness services.
m. Other engineering projects or services
Other projects or services provided by engineering firms that are not classified elsewhere.
Secondary activities
n. Project management services
Planning, supervising and co-ordinating the activities involved in carrying out a project, with regard to time, cost, performance requirements and other constraints. May also include the arrangement of finances for a project, procurement of equipment and subcontractors. Project management services refer only to situations in which project management is offered as a stand-alone service.
o. Construction services (include design-build contracts)
Constructing, repairing, renovating buildings and engineering works, as well as subdividing and developing land, through prime contracts or sub contracts.
Include:
construction of buildings
heavy and civil engineering construction
specialty trade contractors.
Exclude:
manufacturing and installing building equipment such as power boilers and manufacturing pre-fabricated buildings
operating highways, streets and bridges
house moving (transportation only)
project management services, when it is a primary activity
maintenance of rights of way for power, communication and pipe lines
cleaning building exteriors after construction.
p. Environmental consulting services
The provision of objective information, advice and guidance to clients concerning the preservation of air, water and soil quality, natural resource development, waste management, pollution control and other environmental issues.
Include the sale or transfer of technology to a client, which often extends to assisting the client with the organization and monitoring of solution implementation.
Exclude services that involve stand-alone implementation.
q. Other sales of goods and services
All other engineering services not defined above.
Total sales of goods and services
The sum of questions 1a. to 1q. above.
What were this business's sales for each of the following goods and services?
Table summary
This table contains no data. It is an example of an empty data table used by respondents to provide data to Statistics Canada.
CAN$ '000
Engineering services
a. Residential building engineering projects
b. Commercial, public and institutional building engineering projects
Industrial and manufacturing engineering projects
c. Mining and metallurgical plant and process engineering projects
d. Petroleum and petrochemical plant and process engineering projects
e. Industrial machinery engineering design projects
f. Other industrial and manufacturing engineering projects
Other engineering services
g. Transportation engineering projects
e.g., road, rail, air, marine
h. Municipal utility engineering projects
i. Power generation, transmission and distribution engineering projects
j. Telecommunications and broadcasting engineering projects
k. Hazardous and industrial waste engineering projects
l. Engineering advisory services
e.g., expert witness, forensic investigation
m. Other engineering projects or services
Secondary activities
n. Project management services
o. Construction services
Include design-build contracts.
p. Environmental consulting services
q. Other
Specify all other sales of goods and services:
Total sales of goods and services
2. What were this business's sales by each of the following types of revenue?
Sales by type of revenue
a. Fee income
Revenues collected by the company for professional service fees rendered.
Exclude:
reimbursable expenses
subcontract fees awarded to other companies.
b. Subcontracts
Please report the value of subcontracts awarded by you to other firms or consultants.
c. Reimbursables
Include the cost of all contract-related materials used in a project that are billed to the client.
Exclude subcontract fees.
d. Other income
Revenues not elsewhere classified.
Total sales
The sum of questions a. to d. above.
What were this business's sales by each of the following types of revenue?
Table summary
This table contains no data. It is an example of an empty data table used by respondents to provide data to Statistics Canada.
CAN$ '000
a. Fee income
Exclude reimbursable expenses, subcontract fees awarded to other companies.
b. Subcontracts
Report the value of jobs you subcontracted out to other companies.
b1. Engineering consulting
b2. Other consulting
e.g., architects and contractors
c. Reimbursables
i.e., revenue received from clients to cover the cost of contract related materials
d. Other
Specify other income:
Total sales
3. Please report sales of engineering services related to:
Environment-related projects
This section collects data on sales of selected environmental engineering services.
Include sales of related machinery, equipment and products sold as part of a service delivered.
a. Facilities that generate electrical power from the following renewable energy sources: sun, wind, water, biomass or the earth's heat
All engineering services related to facilities that generate electrical power from the following sources of renewable energy: sun, wind, water, biomass or earth's heat.
b. Municipal waste water treatment
All engineering services related to systems for the treatment of municipal waste water.
c. Municipal garbage collection and disposal
All engineering services related to municipal garbage collection and disposal systems, including recycling facilities, composting facilities, transfer stations, resource recovery facilities and landfill sites.
d. Site remediation
All engineering services related to remediation of contaminated site, including remediation of the air, soil, ground and/or surface water (fresh or salt).
e. Industrial air, water and solid waste collection, treatment and disposal projects
All engineering services related to programs for the collection, treatment, recycling and disposal of industrial air, water and solid wastes, generally to a level such that the remaining waste stream can be safely released to the natural environment or ordinary municipal systems.
Please report sales of engineering services related to:
Table summary
This table contains no data. It is an example of an empty data table used by respondents to provide data to Statistics Canada.
CAN$ '000
a. Facilities that generate electrical power from the following renewable energy sources: sun, wind, water, biomass or the earth's heat
b. Municipal waste water treatment
c. Municipal garbage collection and disposal
d. Site remediation
e. Industrial air, water and solid waste collection, treatment and disposal projects
4. During the reporting period of YYYY-MM-DD to YYYY-MM-DD, how many non-salaried partners and proprietors did this business have?
For unincorporated businesses, please report the number of partners and proprietors for whom earnings will be the net income of the partnership or proprietorship.
Number
Sales by type of client
1. What was this business's breakdown of sales by the following types of client?
Sales by type of client
This section is designed to measure which sector of the economy purchases your services.
Please provide a percentage breakdown of your sales by type of client.
Please ensure that the sum of percentages reported in this section equals 100%.
a. to c. Clients in Canada
a. Individuals and households
Please report the percentage of sales to individuals and households who do not represent the business or government sector.
b. Businesses
Percentage of sales sold to the business sector should be reported here.
Include sales to Crown corporations.
c. Governments, not-for-profit organizations and public institutions (e.g., hospitals, schools)
Percentage of sales to federal, provincial, territorial and municipal governments should be reported here.
Include: sales to hospitals, schools, universities and public utilities.
d. Clients outside Canada
Please report the percentage of total sales to customers or clients located outside Canada including foreign businesses, foreign individuals, foreign institutions and/or governments.
Include sales to foreign subsidiaries and affiliates.
What was this business's breakdown of sales by the following types of client?
Table summary
This table contains no data. It is an example of an empty data table used by respondents to provide data to Statistics Canada.
Percentage
a. Clients in Canada - individuals and households
b. Clients in Canada - businesses
c. Clients in Canada - governments, not-for-profit organizations and public institutions
e.g., hospitals and schools
d. Clients outside Canada
Total percentage
Sales by consumer location
1. What was the percentage breakdown of this business's sales by consumer location?
Consumer location is the location where the goods or services will ultimately be used.
If ultimate consumer location is not known, the following are acceptable substitutes:
shipping destination
client's billing address
location of this business's retail customers
location of this business's warehouses/distribution centres.
What was the percentage breakdown of this business's sales by consumer location?
Table summary
This table contains no data. It is an example of an empty data table used by respondents to provide data to Statistics Canada.
Percentage
Newfoundland and Labrador
Prince Edward Island
Nova Scotia
New Brunswick
Quebec
Ontario
Manitoba
Saskatchewan
Alberta
British Columbia
Yukon
Northwest Territories
Nunavut
United States
All other countries
Total percentage
International transactions - revenue received from exports
1. During the reporting period of YYYY-MM-DD to YYYY-MM-DD, did this business receive revenue from clients outside Canada for the sale of products, services, royalties, rights, licensing or franchise fees?
This section is intended to measure the value of international transactions on goods, services, royalties and licenses fees. It covers imported services and goods purchased outside Canada as well as the value of exported services and goods to clients/customers outside Canada. Please report also royalties, rights, licensing and franchise fees paid to and/or received from outside Canada. Services cover a variety of industrial, professional, trade and business services.
Yes
No
2. What was the revenue received from clients outside Canada?
This section is intended to measure the value of international transactions on goods, services, royalties and licenses fees. It covers imported services and goods purchased outside Canada as well as the value of exported services and goods to clients/customers outside Canada. Please report also royalties, rights, licensing and franchise fees paid to and/or received from outside Canada. Services cover a variety of industrial, professional, trade and business services.
Revenue received (CAN$ '000)
3. What was the percentage breakdown of revenue received from clients outside Canada by goods, services and royalties?
This section is intended to measure the value of international transactions on goods, services, royalties and licenses fees. It covers imported services and goods purchased outside Canada as well as the value of exported services and goods to clients/customers outside Canada. Please report also royalties, rights, licensing and franchise fees paid to and/or received from outside Canada. Services cover a variety of industrial, professional, trade and business services.
What was the percentage breakdown of revenue received from clients outside Canada by goods, services and royalties?
Table summary
This table contains no data. It is an example of an empty data table used by respondents to provide data to Statistics Canada.
Percentage
Goods
Services
Royalties, rights, licensing and franchise fees
Total percentage
4. What was the percentage breakdown of revenue received from clients outside Canada by country?
This section is intended to measure the value of international transactions on goods, services, royalties and licenses fees. It covers imported services and goods purchased outside Canada as well as the value of exported services and goods to clients/customers outside Canada. Please report also royalties, rights, licensing and franchise fees paid to and/or received from outside Canada. Services cover a variety of industrial, professional, trade and business services.
What was the percentage breakdown of revenue received from clients outside Canada by country?
Table summary
This table contains no data. It is an example of an empty data table used by respondents to provide data to Statistics Canada.
Percentage
a. United States
b. Mexico
c. Provide the percentage of revenue received from any other countries - top 4 clients only
c1. Other country 1
Begin entering the name of the other country by typing the first few letters to narrow down
the choices or enter your own answer
Specify other country 1:
c2. Other country 2
Begin entering the name of the other country by typing the first few letters to narrow down
the choices or enter your own answer
Specify other country 2:
c3. Other country 3
Begin entering the name of the other country by typing the first few letters to narrow down
the choices or enter your own answer
Specify other country 3:
c4. Other country 4
Begin entering the name of the other country by typing the first few letters to narrow down
the choices or enter your own answer
Specify other country 4:
Total percentage
5. During the reporting period of YYYY-MM-DD to YYYY-MM-DD, did this business make payments to suppliers outside Canada for the purchase of products, services, royalties, rights, licensing or franchise fees?
This section is intended to measure the value of international transactions on goods, services, royalties and licenses fees. It covers imported services and goods purchased outside Canada as well as the value of exported services and goods to clients/customers outside Canada. Please report also royalties, rights, licensing and franchise fees paid to and/or received from outside Canada. Services cover a variety of industrial, professional, trade and business services.
Yes
No
6. What were the payments made to suppliers outside Canada?
This section is intended to measure the value of international transactions on goods, services, royalties and licenses fees. It covers imported services and goods purchased outside Canada as well as the value of exported services and goods to clients/customers outside Canada. Please report also royalties, rights, licensing and franchise fees paid to and/or received from outside Canada. Services cover a variety of industrial, professional, trade and business services.
Payments made (CAN$ '000)
7. What was the percentage breakdown of payments made to suppliers outside Canada by goods, services and royalties?
This section is intended to measure the value of international transactions on goods, services, royalties and licenses fees. It covers imported services and goods purchased outside Canada as well as the value of exported services and goods to clients/customers outside Canada. Please report also royalties, rights, licensing and franchise fees paid to and/or received from outside Canada. Services cover a variety of industrial, professional, trade and business services.
What was the percentage breakdown of payments made to suppliers outside Canada by goods, services and royalties?
Table summary
This table contains no data. It is an example of an empty data table used by respondents to provide data to Statistics Canada.
Percentage
Goods
Services
Royalties, rights, licensing and franchise fees
Total percentage
8. What was the percentage breakdown of payments made to suppliers outside Canada by country?
This section is intended to measure the value of international transactions on goods, services, royalties and licenses fees. It covers imported services and goods purchased outside Canada as well as the value of exported services and goods to clients/customers outside Canada. Please report also royalties, rights, licensing and franchise fees paid to and/or received from outside Canada. Services cover a variety of industrial, professional, trade and business services.
What was the percentage breakdown of revenue received from clients outside Canada by country?
Table summary
This table contains no data. It is an example of an empty data table used by respondents to provide data to Statistics Canada.
Percentage
a. United States
b. Mexico
c. Provide the percentage of revenue received from any other countries - top 4 clients only
c1. Other country 1
Begin entering the name of the other country by typing the first few letters to narrow down
the choices or enter your own answer
Specify other country 1:
c2. Other country 2
Begin entering the name of the other country by typing the first few letters to narrow down
the choices or enter your own answer
Specify other country 2:
c3. Other country 3
Begin entering the name of the other country by typing the first few letters to narrow down
the choices or enter your own answer
Specify other country 3:
c4. Other country 4
Begin entering the name of the other country by typing the first few letters to narrow down
the choices or enter your own answer
Specify other country 4:
Statistics Canada engages in web-data extraction, also known as web scraping, which is a process by which information is gathered and copied from the Web using automated scripts or robots, for retrieval and analysis. As a result, we may visit the website for this business or organization to search for and compile additional information. The use of web scraping is part of a broader effort to reduce the response burden on businesses or organizations, as well as produce additional statistical indicators to ensure that our data remain accurate and relevant. We will strive to ensure that the data collection does not interfere with the functionality of the website. Any data collected will be used by Statistics Canada for statistical and research purposes only, in accordance with the agency's privacy and confidentiality mandate. All information collected by Statistics Canada is strictly protected.
If you have any questions or concerns, please contact Statistics Canada Client Services, toll-free at 1-877-949-9492 (TTY: 1-800-363-7629) or by email at infostats@statcan.gc.ca - this link will open in a new window. Additional information about this survey can be found by selecting the following link: Information for survey participants (ISP).
Changes or events
1. Indicate any changes or events that affected the reported values for this business or organization, compared with the last reporting period.
Select all that apply.
Strike or lock-out
Exchange rate impact
Price changes in goods or services sold
Contracting out
Organizational change
Price changes in labour or raw materials
Natural disaster
Recession
Change in product line
Sold business or business units
Expansion
New or lost contract
Plant closures
Acquisition of business or business units
Other
Specify the other changes or events:
No changes or events
Contact person
2. Statistics Canada may need to contact the person who completed this questionnaire for further information.
Is Provided Given Names, Provided Family Name the best person to contact?
Yes
No
Who is the best person to contact about this questionnaire?
First name:
Last name:
Title:
Email address:
Telephone number (including area code):
Extension number (if applicable):
The maximum number of characters is 5.
Fax number (including area code):
Feedback
3. How long did it take to complete this questionnaire?
Include the time spent gathering the necessary information.
Hours:
Minutes:
4. Do you have any comments about this questionnaire?
The Strategic Engagement Field (Field 4) was created in 2019 as part of Statistics Canada's modernization agenda to help foster synergies and horizontal collaboration across the agency and to ensure integration of cross-cutting activities pertaining to the way statistical data and information were conveyed to Canadians. In this field, communications, dissemination and microdata access activities were organized into two branches: the Communications Branch and the Data Access and Dissemination Branch. Following the agency's recent organizational realignment exercise, which aimed at streamlining operations and better aligning resources, a decision was made to move the functions of Field 4 to other areas to enable greater synergies throughout the agency, as part of its evolving modernization journey.
The evaluation was conducted in accordance with the Treasury Board Policy on Results and Statistics Canada's Integrated Risk-based Audit and Evaluation Plan 2022/2023 to 2026/2027. The objective of the evaluation was to provide a neutral assessment of the design, delivery and relevance of the communications and dissemination activities of the Strategic Engagement Field (Field 4). The evaluation also identified some of the key risks, opportunities and lessons learned to consider moving forward during the restructuring. Data access and internal communications activities were excluded from the evaluation scope.
The evaluation methodology consisted of a document review and interviews, which were conducted with Statistics Canada employees, i.e., Field 4, subject-matter areas (SMAs) and regional offices (ROs). The findings outlined in this report are based on the triangulation of these data collection methods.
Given that the decision to restructure Field 4 was announced during the conduct phase of the evaluation, the recommendations are focused on addressing the foundational elements of the reorganization, leveraging the lessons learned from Field 4 to help support the transition of communications and dissemination activities to the new structure. The report also provides areas of consideration to improve the effectiveness and efficiency of both the communications and dissemination functions.
Key findings and recommendations
Since the creation of Field 4, communications and dissemination activities have shifted to a greater focus on engagement and user-centric service delivery. The field's structure enabled operational effectiveness within each of the units in the divisions, but in some instances, the lack of integration across divisions hindered overall efficiency. Despite some initial growth in capacity, Field 4 has experienced a substantial rise in workload burden since 2019, which has impacted both the well-being of its employees and the effectiveness of its service delivery.
Communications and dissemination activities were a shared responsibility between Field 4, SMAs and ROs. However, the lack of understanding around the roles of the Stakeholder Relations and Engagement Division and the Strategic Communications and Planning Division hindered the effectiveness and efficiency of some communications activities. Opportunities remain to improve integration between Field 4, SMAs and ROs through early involvement; better coordination tools; and a mutual understanding of and agreement on roles and responsibilities, including the role of the Communications Branch as the agency's functional authority for all communications activities.
Performance indicators have been developed for all Field 4 divisions. Metrics for access indicators were used by Field 4 to assess the effectiveness of its activities. While media monitoring reports were also used, the lack of awareness of some SMAs around metrics and limitations in demographic data lessens their usefulness for decision making. Performance metrics were not always updated or monitored consistently, and gaps were also noted in the use of certain operational and availability metrics. While service standards were established for each division, not all divisions monitored whether their service standards were met.
Communications and dissemination services supported the priorities of the agency and the initiatives of SMAs. While the Engagement Playbook provided guidance to SMAs in undertaking engagement activities, some wanted further support from Field 4. Overall, most internal users interviewed were satisfied with the communications and dissemination services provided by Field 4; however, some opportunities for improvement were identified.
Given that capacity, integration and coordination will remain key challenges, the restructuring of communications and dissemination presents an opportunity to reassess their core functions, redefine their roles and explore new ways to generate efficiencies. Change management, including ongoing communication, will be essential during the transition period. Performance measurement is also another area that could be strengthened in the future.
Recommendation 1
The Assistant Chief Statistician (ACS) of the Corporate Strategy and Management Field (Field 3) should ensure that the core functions of the Strategic Communications Branch, including the extent of its role going forward, are clearly determined by
defining communications activities that each core function will, fully or in part, undertake itself, while
engaging key internal partners, including all SMAs with Information Services (IS) positions, for input
considering factors such as (but not limited to) value added, risk exposure and capacity of internal partners that could be leveraged
developing a formal framework (e.g., directives, guidelines, gating process, roles and responsibilities of internal partners) to guide communications activities, and sharing it with internal partners.
Recommendation 2
The ACS of Field 3, in collaboration with the ACS of the Census, Regional Services and Operations Field (Field 7), should ensure that
regular updates on the progress of the transition are provided to all employees
employees directly impacted by the change are informed of the new direction of communications and dissemination and engaged for input during the transition period through various channels (e.g., townhalls)
communications and dissemination services, including key contact information, processes for service requests and related service standards, are updated periodically and promoted through various channels.
Recommendation 3
The ACS of Field 3, in collaboration with the ACS of Field 7, should strengthen the performance measurement of their respective communications and dissemination activities by
reviewing their respective performance measurement framework (e.g., performance information profiles, dashboards, strategic roadmaps) to ensure it aligns with the new structure
leveraging existing data to enhance business intelligence and decision making, including providing guidance to internal partners (e.g., SMAs) to effectively use available information
incorporating more operational efficiency metrics
implementing a process to monitor service standards and satisfaction of internal users.
Acronyms and abbreviations
ACS
Assistant Chief Statistician
CRMS
Client Relationship Management System
GBA Plus
Gender-based Analysis Plus
ICN
Internal Communications Network
IS
Information Services
ORCSD
Official Release and Communication Services Division
PSES
Public Service Employee Survey
ROs
Regional offices
SCPD
Strategic Communications and Planning Division
SIS
Statistical Information Service
SMA
Subject-matter area
SRM
Service Request Management
SRED
Stakeholder Relations and Engagement Division
SOPs
Standard operating procedures
What is covered
The evaluation was conducted in accordance with the Treasury Board Policy on Results and Statistics Canada's Integrated Risk-based Audit and Evaluation Plan 2022/2023 to 2026/2027. The objective of the evaluation was to provide a neutral assessment of the design, delivery and relevance of the communications and dissemination activities of the Strategic Engagement Field (Field 4), and to identify key risks, opportunities and lessons learned to consider during the restructuring.
Strategic Engagement Field (Field 4)
Statistics Canada plays a critical role in providing leadership, stewardship and expertise to help Canadians navigate a data-fuelled world. Since 2010, Statistics Canada has increasingly adapted its communications and dissemination activities to meet the evolving expectations of data users in a rapidly changing digital landscape by leveraging social media (e.g., X [formerly known as Twitter], LinkedIn), modernizing its web technologies to enhance accessibility (e.g., New Dissemination Model initiative), and introducing new access points and visualization tools.
Figure 1. Evolution of communications and dissemination activitiesDescription - Figure 1. Evolution of communications and dissemination activities
Figure 1 depicts the evolution of communications and dissemination activities in Statistics Canada, with a timeline that includes the following milestones:
2010-2011: Creation of a Twitter account followed by a Facebook page and a YouTube account
2012: Launch of the New Dissemination Model Initiative, which aims to enhance the functionality and accessibility of Statistics Canada website and the scalability of The Daily to mobile, laptop, and desktop
2012-2013: Launch of the Smart Daily, a new application for assembling and visualizing an entire release
2017: Introduction of infographics, visualization tools, and portals through the 2016 Census of Population releases
2018: Addition of other social media platforms: LinkedIn, Reddit, and Instagram. Replacement of CANSIM by CODR tables
2019: Creation of Field 4
While Statistics Canada continued to respond to the evolving needs of data users, three factors impacting the agency between 2018 and 2019 catalyzed the creation of Field 4 in 2019:
Statistics Canada, through the pursuit of its modernization agenda, was seeking to establish itself as a trusted, leading source of information for Canadians through a broad-based approach, founded on strengthening stakeholder engagement and user-centric service delivery.
Following news stories that reported that Statistics Canada had requested that several banks provide the personal financial transaction information of hundreds of thousands of Canadians in 2018, the agency faced public backlash. This incident sparked a need for the agency to have better crisis and issue management in place.
The technology systems that supported engagement and publishing information, such as the legacy Client Relationship Management System (CRMS) and the Smart Daily system, were at their end-of-life stage.
In light of these factors, Field 4 was created with the mandate to transform how Statistics Canada engages and communicates with Canadians to maintain and promote public trust. To foster synergies and horizontal collaboration across the agency and to ensure integration of cross-cutting activities pertaining to the way data and information were conveyed to Canadians, Field 4 was formed by integrating multiple sections together under the same field and by creating new divisions to focus on specific priorities. Under the new structure, communications, dissemination and microdata access activities were organized into two branches: the Communications Branch and the Data Access and Dissemination Branch (refer to Figure 2).
Figure 2. Communications and dissemination before and after the creation of Field 4Description - Figure 2. Communications and dissemination before and after the creation of Field 4
Figure 2 depicts two organizational charts showing the structure of communications and dissemination before and after the creation of Field 4 in 2019.
Before 2019, Microdata Access was under the Census Subject Matter, Social and Demographic Statistics Branch within the Social, Health and Labour Statistics (Field 8). Strategic Communications and Stakeholder Relations, Official Release Language Services and Respondent Communications, and Dissemination were under the Communications and Dissemination Branch within the Corporate Services (Field 3).
After the creation of Field 4 in 2019, two new branches were created under the field: the Data Access and Dissemination Branch and the Communications Branch. Microdata Access (changed to Data Access) and Dissemination moved under the Data Access and Dissemination Branch. Under the Communications Branch, there were four divisions: Strategic Communications and Planning, Stakeholder Relations and Engagement, Official Release and Communication Services, and Census Communications.
Since its inception, the Field 4 transformation has been impacted by the COVID-19 pandemic and subsequent budget constraints. These factors have had a notable impact on the agency's ability to operate optimally. Following the agency's organizational realignment exercise, which aimed at streamlining operations and better aligning resources, the decision to move the functions of Field 4 to other areas was announced by the Chief Statistician on April 27, 2023. The move of the Dissemination Division to Field 7 and the Data Access Division to the Strategic Data Management, Methods and Analysis Field (Field 6) took effect in May 2023. The Communications Branch will reorganize its structure and join Field 3 in October 2023. The Statistical Information Service (SIS) from Field 7 will also join the branch (refer to Figure 3). The restructuring is seen as an opportunity to enable greater synergies throughout the agency as part of its evolving modernization journey.
Figure 3. Communications and dissemination after the restructuring of Field 4 in 2023Description - Figure 3. Communications and dissemination after the restructuring of Field 4 in 2023
Figure 3 depicts Communications and Dissemination after the restructuring of Field 4 in 2023.
Before 2023, Strategic Engagement Field (Field 4) had two branches: Data Access and Dissemination Branch and the Communications Branch. Two divisions fell under the Data Access and Dissemination Branch: Dissemination and Data Access. Four divisions fell under the Communications Branch: Strategic Communications and Planning, Stakeholder Relations and Engagement, Official Release and Communication Services, and Census Communications.
After the restructuring of Field 4 in 2023, Dissemination moved under Census, Regional Services and Operations (Field 7) and Data Access moved under Strategic Data Management, Methods, and Analysis (Field 6).
The Communications Branch (changed to Strategic Communications Branch), going from four to three divisions, which are Official Release, Publishing and Creative Services; Engagement and Data Services; and Communications and Promotion, will join Corporate Strategy and Management (Field 3). Statistical Information Services will also join the branch.
The evaluation
The scope of this evaluation, determined in collaboration with Field 4 management, covered communications and dissemination activities since the creation of the Strategic Engagement Field (Field 4) in 2019. The evaluation considered the context of Field 4 since its inception, as well as its evolving role as a strategic enabler. Data accessFootnote 1 and internal communications activities were not examined as part of the scope, given the distinct nature of their processes. The evaluation was conducted from October 2022 to May 2023 and covered the services listed in Appendix A.
Given that the decision to restructure Field 4 was announced during the conduct phase of the evaluation, the recommendations are focused on addressing the foundational elements of the reorganization, leveraging the lessons learned from Field 4 to help support the transition of communications and dissemination activities to the new structure. The report also provides areas of consideration to improve the effectiveness and efficiency of both the communications and dissemination functions.
As outlined in Table 1, three evaluation issues were identified.
Table 1. Evaluation issues and questions
Evaluation issues
Evaluation questions
1. Design and delivery
1.1. To what extent do the structure and capacity of Field 4 support the effective and efficient delivery of communications and dissemination services?
1.2. To what extent are key communications and dissemination activities coordinated and managed effectively and efficiently at the agency-level?
1.3. To what extent is performance measurement in place and being used to inform decision making?
2. Relevance
2.1. To what extent do communications and dissemination services meet the needs of internal users?
3. Moving forward
3.1. What are the key risks, opportunities, and lessons learned moving forward?
Guided by a utilization-focused evaluation approach, the data collection methods outlined in Figure 3 were used.
Figure 4. Data collection methodsDescription - Figure 4. Data collection methods
Figure 4 depicts the three data collection methods used for the evaluation: internal users interviews, Field 4 interviews, and document review.
The internal users interviews included semi-structured interviews with representatives from subject matter areas and regional offices. There were 20 interviews conducted with 62 people.
The Field 4 interviews included semi-structured interviews with representatives from the Communications Branch and the Dissemination Division. There were 20 interviews conducted with 28 people.
The document review included a review of Statistics Canada's files, documents, and web trends information.
Four main limitations were identified, and mitigation strategies were employed, as shown in Table 2.
Table 2. Limitations and mitigation strategies
Limitations
Mitigation strategies
Interviews have the possibility of self-reported bias, which occurs when individuals who are reporting on their own activities and experience portray themselves in a more positive light.
The large number of interviewees enabled us to identify patterns within these groups and gave us the opportunity to get a comprehensive view and gain valuable insights from a broad spectrum of perspectives.
Some interviewees had not been in their roles for very long, hindering their ability to provide the full context for some interview questions.
The large number of interviewees enabled us to identify patterns, and additional information and context were provided in interviews, when needed.
During the interviews, it was noted that some internal users had limited knowledge of the communications and dissemination services offered by Field 4. Consequently, the evaluation did not proceed with the satisfaction survey of internal users; conducting a survey under these circumstances would have introduced biases and gaps in the data collected.
To ensure representation across all subject-matter areas, the number of interviews with internal users was increased and the interviews included the perspective of directors. This approach enabled the evaluation to gather more comprehensive information, compared with a survey.
Because not all internal users were involved with the Census Communications Division, information collected regarding the level of satisfaction for this division is limited.
The evaluation included information on Census Communications activities and the views of internal users only when relevant.
What we learned
1. Design and delivery
Evaluation question 1.1
To what extent do the structure and capacity of Field 4 support the effective and efficient delivery of communications and dissemination services?
Summary
Since the creation of Field 4, communications and dissemination activities have shifted to a greater focus on engagement and user-centric service delivery. The field's structure enabled operational effectiveness within each of the units in the divisions, but in some instances, the lack of integration across divisions hindered overall efficiency. Despite some initial growth in capacity, Field 4 has experienced a substantial rise in workload since 2019, without a corresponding budget increase, which has impacted both the well-being of its employees and the effectiveness of its service delivery.
For most Field 4 interviewees, the structure of their own unit and division enabled them to deliver effectively. However, enhancing integration between divisions would have yielded greater overall efficiency.
Most Field 4 interviewees expressed that the structure of their own division was conducive to effective service delivery, as each unit was able to specialize in specific activities. From a field-wide perspective, however, almost all Field 4 interviewees noted that greater integration between divisions would have yielded greater efficiency. Given the interdependencies of some communications and dissemination services, their delivery often relies on cross-divisional collaboration. However, some instances of duplication and inefficiency were noted by Field 4 interviewees, especially for urgent requests or large projects involving multiple teams from different divisions (for example, a team working on a task while unaware that it has already been completed by another team, or a division being assigned tasks that do not fall within its regular operations, leading to time wasted in reassigning the work to the right group). Some interviewees also reported challenges and delays in obtaining information from other divisions necessary for the execution of their tasks.
Since the inception of Field 4, communications and dissemination activities have shifted to a greater focus on engagement and user-centric service delivery. Considerable effort was also made by the field to strengthen the capacity of the infrastructure that supports communications and dissemination services through technological upgrades and developments.
In line with its mandate, Field 4 was called upon to play a greater strategic role in positioning the agency as a trusted data steward and leading source of statistical information, as opposed to the more transactional role of communications and dissemination in the past. This new orientation presented a culture shift across the field and the agency.
Progressively over the first few years, communications and dissemination activities shifted toward a greater focus on engagement and user-centric service delivery. Some of the key activities carried out by Field 4 in 2020 included the re-energization of the Trust Centre, originally created to address the concerns of Canadians regarding the privacy and security of their personal information, and the launch of the Purpose-based Engagement Strategy, along with its Engagement Playbook, to guide engagement and outreach activities across the agency. Recognizing that storytelling has become an essential component of effective communication in today's digital era, Field 4 also promoted the use of innovative narrative techniques to turn data into compelling stories. New communication channels, such as podcasts (the Eh Sayers podcast), and new dissemination platforms (StatsCAN Plus and the StatsCAN app) were leveraged to reach a wider audience and facilitate storytelling.
Although some Field 4 and subject-matter area (SMA) interviewees noted limitations and inefficiencies in some of the agency's technological tools for communications and dissemination, considerable efforts were made by Field 4 to build and improve the capacity of the infrastructure supporting communications and dissemination activities. Examples of technological upgrades and new developments led by Field 4 included the following:
In collaboration with multiple partners within the agency, CRMS was developed to improve and unify the agency's client service delivery. Using a phased approach, the development of the system included different modules and a Client Experience Index. However, there was a scaling back of the original scope, and the updated CRMS was not fully implemented or available to everyone.
The Smart Daily system, based on aging technology, is extremely vulnerable. Its redesign began in 2018 but has encountered delays. However, the early work enabled the quick implementation of StatsCAN Plus in the Official Release Publishing System and the StatsCAN mobile application. This upgrade improved the system's capacity to support storytelling and visual elements. A plan is also in place to decommission the current Smart Daily in 2024/2025.
StatsCAN Plus is a new communications vehicle that complements The Daily. Averaging approximately 19,000 views in November 2022, it supports content publishing at different times of the day, as well as storytelling and visual elements. The StatsCAN app is a new platform to visualize The Daily and StatsCAN Plus articles.
The Language Services Portal was launched internally by Field 4 to better manage translation and editing requests from internal users.
Despite an initial increase in capacity, Field 4 has continued to experience a substantial rise in workload since 2019 related to intrinsic and external factors, including the ongoing pandemic, the introduction of new initiatives and products, an escalation in the number of incoming requests, and the lack of a corresponding budget increase. These challenges impacted the well-being of employees, as well as the effectiveness of the field's service delivery.
Since its inception in 2019, there has been an increase in the number of Field 4 employees, mainly because of the addition of its two new divisions, the Stakeholder Relations and Engagement Division (SRED) and the Strategic Communications and Planning Division (SCPD), and census projects in 2021 and 2022, which required more temporary employees. In parallel, demands for communications and dissemination services continued to increase rapidly over the period.
While there had already been steady growth in demand for communications and dissemination services since 2019, the COVID-19 pandemic intensified that growth in both volume and breadth of services. For example, before the pandemic, the maximum word count for The Daily was around 2,000 words, but it was increased to 7,000 words for major releases during the pandemic. The increase in the number and length of publications was later fuelled by the prominence of the 2021 Census of Population releases. During that period, the number of social media posts almost doubled, and there was an increased demand for portals and Common Output Data Repository tables. Moreover, the introduction of additional release vehicles (StatsCAN Plus, StatsCAN app) and changes to the agency's Policy on Official Release also led to additional writing and editing work, which put a strain on the resource capacity of the Official Release and Communication Services Division (ORCSD). Throughout this period, Field 4 capacity was overstretched.
The combination of all these factors, including difficulties in retaining and hiring talent with the right skills, as well as the hiring process itself, led to capacity challenges within some sections of Field 4, particularly the Social Media Section and ORCSD, since their services were among the most solicited across the agency. Field 4 interviewees reported that the high volume of work increased stress among staff, which led to high levels of turnover, sick leave and overtime. Many also recognized that the workload distribution among units was not well balanced; some even questioned the resource allocation within the field and its sustainability. Based on the results of the 2020 Public Service Employee Survey (PSES),Footnote 2, which was conducted from November 2020 to January 2021, the main factors causing stress at work for Field 4 employees also reflected matters related to capacity (see Chart 1).
Chart 1. Key factors causing stress at work for Field 4 employeesFootnote 3Description - Chart 1. Key factors causing stress at work for Field 4 employees
Chart 1 depicts a bar chart showing key factors causing stress at work for Field 4 employees in comparison to the agency and the public service.
Based on the chart, Field 4 employees experience these stressors to a greater extent than those from the agency and the public service.
The 5 key factors causing stress at work for Field 4 include:
Heavy workload (36%), which is higher than Statistics Canada (27%) and the public service (26%)
Not enough employees to do the work (34%), which is higher than Statistics Canada (26%) and the public service (26%)
Unreasonable deadlines (30%) which is higher than Statistics Canada (20%) and the public service (18%)
Competing or constantly changing priorities (23%) which is higher than Statistics Canada (17%) and the public service (19%)
Overtime or long work hours (21%) which is higher than Statistics Canada (15%) and the public service (13%)
For many interviewees, despite the rising number of publications, the limited capacity within Field 4 impeded its ability to fulfill growing demands. Field 4 introduced various strategies to provide data, alleviate pressure and streamline the agency's publishing approach. Following the agency's organizational realignment exercise, a decision was made to move the functions of Field 4 to other areas of the agency.
Since 2020, certain units have had to make difficult decisions, such as limiting certain communications and dissemination activities to alleviate pressure on their employees. The pressure further intensified in July 2022, compelling Field 4 to reinforce a word-count limit for The Daily articles, reintroduce a limit on the number of The Daily releases (seven per day), and impose a cap on services and reduce investment in areas like CRMS and the Official Release Publishing System. The impact of these measures on service delivery was noted by internal users. To help address this situation, Field 4 introduced the Connecting with Canadians strategy, which focused on user centricity (i.e., increasing reach, relevance, timeliness and access by providing data in multiple formats, at different times of day) and streamlining the agency's publishing approach. From 2022 to 2023, the agency entered a period of austerity, which led to a series of spending reduction measures, further increasing the pressure on the resource capacity of Field 4. Following the agency's organizational realignment exercise, which aimed at streamlining operations and better aligning resources, a decision was made to move the functions of Field 4 to other areas to enable greater synergies throughout the agency as part of its evolving modernization journey.
Evaluation question 1.2
To what extent are key communications and dissemination activities coordinated and managed effectively and efficiently at the agency-level?
Summary
Communications and dissemination activities were a shared responsibility between Field 4, SMAs and regional offices (ROs). However, the lack of understanding around the roles of SRED and SCPD hindered the effectiveness and efficiency of some communications activities. Opportunities remain to improve integration between Field 4, SMAs and ROs through early involvement; better coordination tools; and a mutual understanding of and agreement on roles and responsibilities, including the role of the Communications Branch as the agency's functional authority for all communications activities.
From an agency-wide perspective, communications and dissemination activities were a shared responsibility between Field 4, SMAs and ROs.
Field 4 assumes a large range of responsibilities, all aimed toward delivering user-centric services, maximizing reach to target audiences, fostering trust, and ensuring that the agency's communications and dissemination practices remain consistent and effective. To do so, Field 4 brings a variety of specialized skills and expertise in messaging, engagement, branding, dissemination and strategic communications, as well as its knowledge of best practices and public sector standards and policies.
SMAs are responsible for the quality and relevance of the data they disseminate. Some SMAs have dedicated employees assigned to communications and dissemination activities, while others rely heavily on the expertise of Field 4; the size of the division, the standing of their surveys (i.e., mission-critical programs) and the number of releases tend to be determining factors. SMAs with dedicated communications and dissemination resources tend to coordinate more effectively within their own divisions, have better follow-up on critical matters and be more knowledgeable of Field 4 services.
ROs serve as the liaison between headquarters and external stakeholders (e.g., data users) within their regions. When working with Field 4, ROs bridge the gap between national strategies and regional nuances because they understand the specific needs of their local stakeholders. When working with SMAs, they connect them with local stakeholders. ROs also provide support in planning local events and training, developing data products, and addressing user inquiries.
Roles, responsibilities and accountabilities within Field 4 were clearly defined and understood for legacy services; however, those of SRED and SCPD were not clearly understood for some internal users, which added work burden and created friction.
Familiarity with available communications and dissemination services and understanding of the roles and responsibilities of each Field 4 division are predominantly influenced by internal users' experience with those specific services and divisions. Hence, for legacy services, such as those provided by ORCSD and the Census Communications Division, internal users understood the roles, responsibilities and accountabilities between their divisions and Field 4 regarding communications and dissemination activities.
However, there was a lack of clarity and understanding around the roles, responsibilities and accountabilities of SCPD and SRED for some interviewees. For example, interviewees from SMAs and Field 4 noted a lack of awareness regarding the role of SCPD as the primary point of contact or front door for accessing services offered by Field 4, despite the SCPD's mandate being outlined on the Internal Communications Network (ICN). That said, SCPD did not have the capacity to fully take on this role because of a staff shortage.
While one of the key roles of SRED was to foster relationships with a vast array of stakeholders, SMAs and ROs also had a part to play in stakeholder engagement. However, because there was a lack of understanding regarding the responsibilities of SRED for engagement and outreach, the boundaries of its role and those of ROs and of a few SMAs sometimes got blurred. This occasionally led to contact burden on external stakeholders. For example, a few interviewees noted that some external data users were contacted by representatives from Field 4, ROs and SMAs on the same topic, separately. For these interviewees, not having the CRMS module fully implemented also exacerbated this issue.
Another example highlighted as an area of challenge by some interviewees from both Field 4 and SMAs pertained to the engagement process with media stakeholders. While SRED plays a key advisory role in media relationship management, there were instances where SMAs engaged directly with the media without notifying SRED in advance. For these few SMAs, engaging directly with the media enabled them to be more responsive to inquiries and build long-term relationships. From the perspective of Field 4, however, the trade-off for expediency in not engaging SRED earlier on increases the risk to the agency's reputation.
While the roles and responsibilities of SRED and SCPD were articulated on the ICN and internal documents, there were grey areas in activities within the Communications Branch that were never agreed upon or operationally clarified, creating some friction and additional burden. For instance, some groups felt that they had to provide support on various communications products that did not belong to them (e.g., writing emails on behalf of SMA senior management) because of a lack of capacity within the Communications Branch. A few SMA interviewees also mentioned that the lack of clarity regarding roles and responsibilities led to confusion concerning the required level of approval and the authority responsible for granting approval in certain projects.
While there were mixed views, some SMA interviewees reported seeing the value added of SCPD and SRED and noted positive experiences working with them, such as adding a strategic component to their work and responding to requests efficiently. For a few Field 4 interviewees, working in a virtual environment at the time did not facilitate the understanding of roles and responsibilities, even within the same group.
Planning and decision-making processes are in place for communications and dissemination activities. While prioritization at the operational level for frontline communications activities was identified as a challenge, a tier system was being explored by the Communications Branch to manage production and workflow.
Many Field 4 interviewees reported that input from SMAs and, to some extent, ROs was solicited and considered during their planning and priority-setting processes, through the Data Out: Services, Access, Dissemination and Communication Committee; the Editorial Board; scrum meetings; working groups; and client meetings. The Data Out: Services, Access, Dissemination and Communication Committee, composed of representatives from the Communications Branch, Dissemination Division and SMAs, supports the agency in optimizing access to and use of the information it produces. Led by Field 4, the Editorial Board is a monthly meeting of directors from all fields to discuss, strategize and provide guidance on how to communicate the agency's data and strategic narrative in a consistent and thoughtful manner, while considering current events, public policy needs and other trends. It provided an opportunity for SMAs and Field 4 to collaborate, identify priorities and share information.
Planning and decision-making processes vary based on the nature of the activities involved. Project-based communications and dissemination activities allow for more time to establish plans and charters (e.g., census communications), while frontline communications and dissemination activities (e.g., publishing, official release) tend to focus on mission-critical programs (e.g., Labour Force Survey, census cycle) and hot topics (e.g., media relations). A few Field 4 interviewees also reported prioritizing requests from the Chief Statistician, as well as those related to funding initiatives (e.g., Treasury Board submissions) or agency-wide priorities (e.g., Disaggregated Data Action Plan).
Some of the Field 4 interviewees who engaged in frontline communications and dissemination activities raised concerns regarding their limited ability to push back or negotiate timelines when they receive requests, many of which are labelled as high priority. This string of continuous competing demands highlights the necessity to clarify priorities at the operational level. However, the Communications Branch was working to minimize overproduction by developing a tier system for service offerings by ranking them as gold, silver or bronze to help internal users learn what to expect at each level and to help manage their workflow. A guideline was also developed by SCPD to redirect efforts around access to information and privacy requests.
For Field 4 interviewees involved in other communications and dissemination activities, some mentioned that they generally defer to their management or committees to decide which request should be prioritized, while others said that they negotiate timelines with SMAs. Another group mentioned that it had a team dedicated to reviewing requests, triaging them and establishing priorities.
Collaboration and information-sharing mechanisms are in place to support communications and dissemination activities. However, opportunities remain to improve integration between Field 4, SMAs and ROs through early involvement; better coordination tools; and a mutual understanding of and agreement on roles and responsibilities, including the role of the Communications Branch as the agency's functional authority for all communications activities.
Collaboration and information sharing are fostered through the different aforementioned forums (i.e., the Data Out: Services, Access, Dissemination and Communication Committee; the Editorial Board; scrum meetings; working groups; and client meetings); most interviewees reported overall good cooperation between the representatives of Field 4, SMAs and ROs who attended these forums. That said, ensuring broad representation from all relevant fields and securing their attendance were not always easy. Moreover, ensuring the alignment of topics and exchanges with the diverse interests of all participants, especially for the Editorial Board, also proved to be a challenge. Nevertheless, interviewees still considered the Editorial Board as the right mechanism to foster collaboration and information sharing between Field 4, SMAs and ROs. Following a succession of recalibrations and periods when its activities were put on hold, the Editorial Board was reinstated in 2022. During the period in which its activities were paused, interviewees noted that there were no similar avenues for Field 4, SMAs and ROs to collaborate and share information. To reinforce coordination and information sharing between communications and dissemination and their internal partners, these existing mechanisms could be further examined to determine whether they could be better leveraged after the restructuring.
Despite having these collaboration and information-sharing mechanisms, several interviewees identified that the siloed culture within each group (i.e., Field 4, SMAs and ROs) still persisted even when they were engaged in collaborative work. Many interviewees felt that being involved earlier in the process would enhance collaboration, group synergy and common knowledge. For instance, when Field 4 launched communications initiatives to commemorate awareness months or other important occasions (e.g., Black History Month, Asian Heritage Month), some SMAs felt that if they had been involved earlier in the process, these initiatives would have been more impactful, because it would have given them time to extract specific data and synchronize their publication with the launch of the communication initiative. Another example is involving the Dissemination Division earlier, rather than in the final stages of the release, given its knowledge of tools, the behaviours of target audiences and potential releases involving similar topics.
When responding to external requests (e.g., Canadians requesting information or data through social media, the Media Hotline and the Contact Us service), ROs and some groups within the Communications Branch had difficulty at times in distinguishing nuances between products and identifying the appropriate SMA contact, often resulting in unnecessary hand-offs between functions. In this regard, it was suggested that information sessions led by SMAs on their products would help fill this gap. Some SMA interviewees also suggested the implementation of a tracking tool within the Communications Branch to capture inquiries because they have observed recurring requests from different areas within the agency.
Some SMAs have positions (i.e., Information Services [IS] positions) within their division or branch that are dedicated to communications activities. In some cases, these positions also include other responsibilities (e.g., client services), but most play an active role in planning and coordinating the communications and dissemination activities for their division or branchFootnote 4. There were mixed views on the legitimacy of these positions; for SMAs that have them, incumbents in these roles have a greater understanding of the business lines of the SMAs and can better convey specialized requirements to Field 4. In their view, this facilitates collaboration between the two groups and expedites delivery of communications and dissemination services. Moreover, SMAs also believe that these positions contributed to filling some of the capacity gaps encountered in Field 4 and to serving as the liaison between the different units within Field 4 (noting the lack of communication between units within Field 4). From the perspective of Field 4, however, some interviewees perceive these positions as redundant, and consider whether it would best to centralize all IS positions within Field 4. For these Field 4 interviewees, incumbents are often unaware of established guidelines and fail to adhere to them because these IS positions reside outside Field 4. Consequently, addressing these instances added burden to the workload of Field 4. Because this practice has both positive and negative implications, it should be further explored during the restructuring of the field, while recognizing at the same time that the Communications Branch remains the agency's functional authority for all communications activities.
ROs play a unique role in engagement by enabling communications and dissemination activities to be more targeted to the specific needs of data users across Canada. With the SIS being integrated into the Communications Branch, there is an opportunity to enhance cohesion between these groups.
ROs play a key role in engagement, as they serve as entry points to the agency across Canada. They are responsible for data collection, respondent relations, advisory services and data user support, and promotion of Statistics Canada products and services either through national campaigns or regional activities and newsletters. One of their key elements for engagement is the SIS, a central hub for general inquiries located in Montréal. The SIS is dedicated to responding to general questions and data requests regarding pre-existing published statistical information from across Canada. For more complex inquiries, it helps connect the client with the appropriate RO or SMA representative.
Given their familiarity with the particularities of their region and the solid network of local contacts they have developed over the years, ROs enable communications and dissemination activities to be more targeted to the specific needs of data users across Canada. For instance, they are recognized as key players in supporting local event planning and connecting SMAs with regional stakeholders. Their role in the development of CRMS was also instrumental, as they are one of the main users. To ensure effective collaboration and information sharing, ROs participate in the Editorial Board and have other communications exchanges with SMAs to promote their products in the regions. A cross-regional committee is also implemented to ensure consistency.
Most of the interviewees indicated that ROs are not systematically integrated in the communications and dissemination processes; most of the time, they are engaged at a later stage, often after the national strategy has been formulated. Because of this lack of early involvement, the ROs perceived that Statistics Canada's messaging was inadequately regionalized, primarily because of the absence of disaggregated data at the regional levels. Moreover, like SMAs, ROs do not fully understand the role of some sections of Field 4, and they feel that headquarters somewhat understands the potential role of ROs to support communications and dissemination activities. For ROs, having employees from different regions involved in communications and dissemination activities is crucial because of their profound understanding of the local context and challenges. For them, this will enable the agency to better communicate with regional users and bridge the gap between headquarters and ROs.
Evaluation question 1.3
To what extent are performance measurements in place and being used to inform decision-making?
Summary
Performance indicators have been developed for all Field 4 divisions. Metrics for access indicators were used by Field 4 to assess the effectiveness of its activities. While media monitoring reports were also used, the lack of awareness of some SMAs around metrics and limitations in demographic data lessens their usefulness for decision making. Performance metrics were not always updated or monitored consistently, and gaps were also noted in the use of certain operational and availability metrics. While service standards were established for each division, not all divisions monitored whether their service standards were met.
Performance indicators have been developed for all Field 4 divisions and comprise access, operational and availability indicators. Some of these access and availability indicators are also reported in Statistics Canada's expenditure plans.
Field 4 has developed a set of performance indicators for each of its divisions. They consisted of a combination of access, operational and availability indicators, tailored according to the nature of the work of each division.
Access indicators, which are focused on the effectiveness of communications and dissemination activities, primarily aim to measure reach (e.g., number of visits to the Statistics Canada website, number of StatsCAN app downloads).
Operational indicators are more focused on the effectiveness and efficiency of the communications or dissemination service delivery itself (e.g., number of words translated, number of client consultations conducted).
Availability indicators apply only to the Dissemination Division and ORCSD and pertain to the number of data products created and published (e.g., infographics, data tables, videos).
Some of the access and availability indicators of Field 4 are also reported in Statistics Canada's departmental reports (i.e., departmental plans and departmental results reports), such as the number of statistical products available on the website, the number of visits to the Statistics Canada website and the number of interactions on social media.
Metrics for access indicators, complemented by media monitoring reports, are used by Field 4 to assess the effectiveness of its communications and dissemination activities and to adjust its strategy as needed. While internal users also have access to media monitoring reports, many noted that the lack of demographic data lessens their usefulness to inform decision making.
Metrics for these performance indicators are tracked by Field 4 using monthly dashboards and the editorial calendar. Metrics for the access indicators in particular are used by Field 4 to assess the effectiveness of its communications and dissemination activities and to subsequently adjust its strategy if needed (for example, determining whether the recent promotion of a hub through social media was effective in increasing the number of visits to that hub in the following months).
Some interviewees from Field 4 and SMAs also used media monitoring reports (e.g., reports from Meltwater, a media intelligence and social monitoring tool to assess engagement) and analytics (e.g., Urchin Tracking Module codes and Google Analytics) to look at the number of clicks or views of their data products. Only a few internal users knew about Meltwater reports or acknowledged their usefulness, although they were highly used by the Census Communications Division for its marketing campaign. While internal users also have access to these reports, many noted that there is a lack of narrative supporting the number of clicks and views. For example, they are unable to discern who is viewing their products, and that is not conducive to decision making. While having some demographic data (i.e., data about viewer groups according to certain attributes) would be more useful for them to tailor their products according to their audience, there are limitations related to privacy considerations.
Performance metrics were not always updated or monitored consistently. Gaps were also noted in the use of certain operational and availability metrics.
While there are monthly dashboards, it was noted that not all performance metrics were updated or monitored consistently. For some Field 4 interviewees, this was caused by a lack of resources or time to update, maintain and monitor these metrics, or to look at performance retrospectively.
Gaps were also noted in the use of certain operational and availability metrics. For some Field 4 interviewees, there was too much focus on volume, which did not always capture the level of effort required to develop certain labour-intensive products. For example, because it takes much more time to create an interactive data visualization than a table, solely measuring how many are created would not give a complete picture. Given that operational and availability indicators are highly dependent on the capacity of the field, there can be challenges in setting adequate targets for departmental indicators. The development of more comprehensive and SMARTFootnote 5 indicators could help assess and improve efficiency.
Field 4 has established service standards and processes for its communications and dissemination services, which are published on the ICN. Some divisions also have tools to track service requests submitted by internal users. However, not all divisions have established a monitoring process to determine whether their service standards are met.
Field 4 has established processes and service standards to help internal users in their planning and to ensure a seamless experience for those involved. These service standards and processes are also published on the ICN to manage the expectations of internal users (e.g., turnaround time to complete a service request). The Dissemination Division, SRED and, to some extent, SCPD have established a process to monitor their performance against service standards; however, some Field 4 interviewees mentioned that further work is needed to have a comprehensive picture. This is because some standards are hard to establish, primarily because of the complexity of certain tasks, leading to important variations.
The Dissemination Division uses the Service Request Management (SRM) Portal to track the service requests submitted by internal users, enabling the division to track and monitor the metrics against its service standards (e.g., average time to complete a service request). The web-based functionality of the SRM Portal also allows the division to gauge the satisfaction of internal users through automated post-completion surveys. This enables the division to monitor the effectiveness and efficiency of its service delivery over time. Except for ORCSD, which uses the Language Services Portal to track the translation and editing requests submitted by internal users, other divisions within the Communications Branch do not use such systems, given the nature of their broad range of services; however, it was mentioned that a centralized tool like the SRM Portal or JIRA, project management software used by the agency, may help organize and monitor the work. There is also no tool to track internal user satisfaction within the Communications Branch.
2. Relevance
Evaluation question 2.1
To what extent do communications and dissemination services meet the needs of internal users?
Summary
Communications and dissemination services supported the priorities of the agency and the initiatives of SMAs. While the Engagement Playbook provided guidance to SMAs in undertaking engagement activities, some wanted further support from Field 4. Overall, most internal users interviewed were satisfied with the communications and dissemination services provided by Field 4; however, some opportunities for improvement were identified.
Communications and dissemination services support agency-wide and subject-matter initiatives and are aligned with the priorities of the agency.
Field 4 was created during a period when Statistics Canada undertook agency-wide modernization initiatives, which included the realignment of strategic directions and governance restructuring. Building on this, Field 4 established a logic model, a comprehensive set of plans, strategic roadmaps and a monitoring framework to ensure the achievement of its expected outcomes and alignment with the agency's priorities. The strategic roadmaps developed by Field 4 clearly outline activities and expected outcomes for both branches, as well as their alignment with agency-wide priorities.
To further ensure continuous alignment with the agency's priorities, Field 4 has also been an active participant in various committees and working groups dedicated to advancing corporate endeavours, such as the Disaggregated Data Action Plan, the Quality of Life Framework and open data. Recognizing the growing demand to have statistical information centralized in one location, Field 4 also supported SMAs in the development of various hubs and portals (e.g., the Centre for Gender, Diversity and Inclusion Statistics).
For horizontal priorities, such as Gender-based Analysis Plus (GBA Plus), responsibility rests primarily with SMAs in terms of data and content; they are responsible for integrating a GBA Plus lens into the material they submit. From a communications and dissemination standpoint, GBA Plus considerations are typically built in as part of a program's consultation or corporate requirement process. For example, Field 4 and SMAs must consult with the Centre for Indigenous Statistics and Partnerships ahead of disseminating information involving Indigenous statistics to ensure that releases are reflective of and sensitive to Indigenous groups. Field 4 also ensures that communications and dissemination services adhere to the Government of Canada's accessibility and official language guidelines.
While the Engagement Playbook provides guidance and resources to support SMAs in undertaking engagement activities, not many were aware of it. Some also wanted further engagement support from Field 4.
The Purpose-based Engagement Strategy and its playbook provide practical, hands-on tips and tools to guide SMAs when undertaking engagement activities. The playbook also includes an engagement continuum model for Statistics Canada and alludes to a centre of excellence dedicated to providing expert advice on strategic engagement to support SMAs. Despite the advertising done by Field 4, only a few interviewees were aware of it—mainly the groups that were consulted during its development.
The engagement continuum model for Statistics Canada includes four incremental levels of engagement: (1) inform, (2) listen, (3) discuss and (4) dialogue. For each level, there are different tactics and methods to consider for effective engagement. According to the playbook, most of the agency's engagement activities are in the bottom three levels of the spectrum. According to SMA interviewees, many engagement activities they undertake typically fall under the "inform" and "dialogue" levels. Because of limited capacity and expertise, some interviewees would like Field 4 to further support them in carrying out their engagement activities. For example, it was suggested that Field 4 provide insight on what engagement tools are available for SMAs to use or feedback on material written by SMAs, or that perhaps Field 4 employees even write the material themselves, based on content and data provided by SMAs.
Table 3. Statistics Canada engagement continuum
1. Inform
(Provide information)
2. Listen
(Ask for feedback)
3. Discuss
(Invite into the process)
4. Dialogue
(Work in partnership)
Tactics and methods
Reports and analyses
Targeted emails and letters
Webinars, presentations, displays and exhibits
Newsfeed and blog
Videos
Social media posts
Fact sheets
Newsletters
Media releases
Podcasts
Interactive tools
Training
Facilitated small group discussions
Interviews
Heuristic reviews
User experience testing
Public opinion research and focus groups
Apps
Surveys, questionnaires and social media polls
Crowdsourcing
One-on-one discussions
Web panels
Advisory committees
Interdepartmental and external stakeholder meetings
Hackathons
Moderated smart forums
Polls
Hands-on collaboration (projects)
Co-creation
Multi-stakeholder roundtables, and steering committees
Innovative solution developments (sprints, etc.)
For SMAs, expanding the variety of channels beyond the ICN to promote communications and dissemination services could further increase awareness among internal users.
Field 4 relied heavily on the ICN and senior management as the primary channels for informing internal users of their services, although some roadshows were organized when it was newly created. However, some SMA interviewees reported that many internal users were unaware that Field 4 posted their services on the ICN, while the rest did not intuitively consult the ICN; some reported that the information on the ICN was either hard to access or outdated at times. SMAs also believe that staff turnover contributed to information breakdowns. For example, some SMA groups may have developed internal guidelines or established a workflow with Field 4, but the departure of key employees may have disrupted their continuity. Similarly, employees who were present during those Field 4 roadshows may have already left the agency. For SMA interviewees, the use of diverse channels to promote communications and dissemination services may be worth exploring to increase awareness.
Overall, most internal users interviewed were satisfied with the communications and dissemination services provided by Field 4, although they found the processes around HTML and PDF productions cumbersome. Some suggestions for improvement were provided.
Nearly all the internal users interviewed reported using the following Field 4 services frequently:
translation services (ORCSD)
official release (ORCSD)
publishing services (Dissemination Division)
output database services (Dissemination Division)
web development (Dissemination Division).
Many also reported using the following services:
editorial services (ORCSD)
creative communications (ORCSD)
social media and media relations (SRED)
web analytics (Dissemination Division).
Overall, most internal users were satisfied with these services and their access to them. For most, these services met their needs, as well as those of their external audience. Results from the SRM client satisfaction surveys also show a high level of satisfaction for dissemination services. For communications services, some challenges were noted by internal users in the areas of translation and editorial services (e.g., translation not aligned with SMA terminology). Consequently, some internal users indicated that they often prefer performing the translation for non-official releases themselves, rather than sending them to translation services (i.e., ORCSD).
When asked about specific quality aspects (e.g., relevance, usefulness, perceived quality, timeliness and accessibility) of the services they received, most of the internal users were unaware of Field 4 service standards and requested that processes be published on the ICN. Because of their lack of awareness of these standards and processes, a few internal users indicated that it was hard for them to plan. Consequently, some of the services they requested did not meet their timelines or needs, especially services from the Communications Branch. For example, a few internal users who requested communications services noted that while the process was clear in the beginning, it became increasingly complicated as additional tasks were introduced and more people got involved. Consequently, this led to extensions beyond the original timelines of their request.
Others also pointed out the limited capacity in some areas of the Dissemination Division and the Communications Branch, which, coupled with the unexpected announcement of the reduction in the maximum number of Daily releases in early 2023, resulted in delays for certain publications. Several SMAs raised issues around the archaic and cumbersome processes for HTML and PDF document production. Quality control, communication between various internal partners (e.g., Field 4, SMAs) and tracking were the most challenging elements, as the tools were not user-friendly and drained SMA resources.
Despite these challenges, most internal users still felt that Field 4 has proactively supported them. For some, enhancing the system capacity of some of the agency's aging technology, such as the Smart Daily, could help improve the efficiency of some communications and dissemination services (e.g., by developing visual elements or publishing releases more rapidly). Some internal users also suggested the use of an automated tracking system, one that would provide them with real-time updates on the progress of their service request, as well as the estimated completion time. This would greatly help the planning process of internal users and enhance client relations.
3. Moving forward
Evaluation question 3.1
What are the key risks, opportunities, and lessons learned moving forward?
Summary
Given that capacity, integration, and coordination will remain key challenges, the restructuring of communications and dissemination presents an opportunity to reassess their core functions, redefine their roles, and explore new ways to generate efficiencies. Change management will be essential during the transition period, as well as ongoing communication through various channels. Performance measurement is also another area that could be strengthened in the future.
Capacity, integration and coordination will continue to remain key challenges for communications and dissemination.
Some key positions within communications and dissemination groups require specific expertise and skill sets, which are in high demand. Considering the current financial constraints, opportunities for staffing or career advancement may be limited, hindering the agency's ability to compete for resources with other departments. Consequently, recruitment and retention challenges will likely continue to persist after the restructuring of communications and dissemination, further impeding the delivery of services. For instance, the loss of skilled teams may lead to a productivity decrease and delays in some services caused by fatigue (e.g., overtime, heavier workload, low morale and stress) and the additional time and effort required to train replacements and onboard new employees. Field 4 interviewees suggested that partnerships with universities across the country and the flexibility of remote work may help mitigate some of these risks, albeit only to some extent.
One objective in forming Field 4 was to centralize all communications and dissemination activities under a unified umbrella to generate efficiencies and reinforce collaboration across the agency. However, the lack of clarity around some roles and responsibilities, the longstanding silo culture within the agency, and the absence of a common platform to track and monitor services and projects impede the achievement of this objective. With the restructuring of Field 4, coordination and integration will remain challenges that need to be addressed.
The restructuring of Field 4 presents an opportunity for the Communications Branch to reassess its core functions and determine the extent of its role, going forward. New ways to generate further efficiencies could also be explored.
The restructuring of Field 4 presents a unique opportunity for the Communications Branch to reassess its core functions and determine the extent of its role and responsibilities, going forward. A few interviewees also saw the coming changes as a chance to assess whether the work is being performed in the right place and by the right group. This includes, for instance, determining which communications activities under each function the branch should fully undertake, as opposed to those it could pass fully or in part to its internal partners (i.e., SMAs and ROs), while assuming functional authority (e.g., providing guidelines). In light of the branch's capacity, this exercise could help alleviate some of its workload challenges, while offering an opportunity to clarify its role within its own groups and with its internal partners. This could help strengthen integration and coordination of communications activities within groups and across fields. Considerations such as value added (e.g., efficiency gains), risk factors (e.g., reputation of Statistics Canada), areas requiring more support (e.g., engagement with external stakeholders) and the capacity of internal partners that could be leveraged (e.g., SMAs that have IS positions) will need to be taken into account. As part of this exercise, roles, responsibilities and accountabilities of all those involved in communications activities should be clearly defined and communicated.
The restructuring of communications and dissemination also provides an opportunity to reassess some of their processes and explore new ways to generate further efficiencies, when possible. For example, for certain communications or dissemination activities, this could involve assigning an employee or a team dedicated to a portfolio of SMAs; over time, this approach will enable the employee or team to better understand the specific requirements of these SMAs and deliver more efficiently (e.g., faster tracking and monitoring of service requests). Based on the core principle of Lean to reduce and eliminate non-value-adding activities and waste, the evaluation has also identified areas of inefficiencies that could be further explored during the restructuring of communications and dissemination. They are categorized using the Eight Wastes of Lean in Appendix B.
Other areas to consider in the future include ensuring change management during the transition, providing ongoing communication through various channels and improving performance measurement.
The dissolution and restructuring of an entire field present a significant change, not only for Field 4 but across fields; like any other change endeavour, this creates uncertainty among employees. For this reason, change management will be essential during the transition period; it will be crucial to keep employees, especially those directly impacted by the change, informed on the progress of the transition to help assuage anxiety and increase buy-in. Once the key elements of the new structure have been defined (e.g., roles, responsibilities and accountabilities; services offered; processes for service requests; and related guidelines), they should be communicated to all employees using multiple channels to increase awareness at all levels.
Performance measurement of communications and dissemination activities is another area that could be strengthened, moving forward. The performance indicators for communications and dissemination activities were captured in disparate sources (e.g., dashboards, decks) and sometimes not aligned. For example, the Performance Information Profile was never updated to reflect the communications activities that were added with the creation of Field 4. Other opportunities for improvement include ensuring that monthly dashboards are kept up to date; incorporating more operational efficiency metrics; leveraging existing data to enhance business intelligence and decision making, including providing guidance to internal partners (e.g., SMAs) to effectively use available information; and implementing a monitoring process to determine whether service standards are met and to gauge satisfaction of internal users.
How to improve communications and dissemination
Recommendation 1
The Assistant Chief Statistician (ACS) of the Corporate Strategy and Management Field (Field 3) should ensure that the core functions of the Strategic Communications Branch, including the extent of its role going forward, are clearly determined by
defining communications activities that each core function will, fully or in part, undertake itself, while
engaging key internal partners, including all SMAs with IS positions, for input
considering factors such as (but not limited to) value added, risk exposure and capacity of internal partners that could be leveraged
developing a formal framework (e.g., directives, guidelines, gating process, roles and responsibilities of internal partners) to guide communications activities, and sharing it with internal partners.
Recommendation 2
The ACS of Field 3, in collaboration with the ACS of the Census, Regional Services and Operations Field (Field 7), should ensure that
regular updates on the progress of the transition are provided to all employees
employees directly impacted by the change are informed of the new direction of communications and dissemination and engaged for input during the transition period through various channels (e.g., townhalls)
communications and dissemination services, including key contact information, processes for service requests and related service standards, are updated periodically and promoted through various channels.
Recommendation 3
The ACS of Field 3, in collaboration with the ACS of Field 7, should strengthen the performance measurement of their respective communications and dissemination activities by
reviewing their respective performance measurement framework (e.g., performance information profiles, dashboards, strategic roadmaps) to ensure it aligns with the new structure
leveraging existing data to enhance business intelligence and decision making, including providing guidance to internal partners (e.g., SMAs) to effectively use available information
incorporating more operational efficiency metrics
implementing a process to monitor service standards and satisfaction of internal users.
Management response and action plan
Recommendation 1
The ACS of Field 3 should ensure that the core functions of the Strategic Communications Branch, including the extent of its role going forward, are clearly determined by
defining communications activities that each core function will, fully or in part, undertake itself, while
engaging key internal partners, including all SMAs with IS positions, for input
considering factors such as (but not limited to) value added, risk exposure and capacity of internal partners that could be leveraged
developing a formal framework (e.g., directives, guidelines, gating process, roles and responsibilities of internal partners) to guide communications activities, and sharing it with internal partners.
Management response
Management agrees with the recommendation.
An internal working group will be established to review the core functions of the new Communications and Engagement Branch in collaboration with internal partners, including a review of any IS positions outside the branch.
The branch will leverage the results and recommendations from the review, along with the existing mandate, vision and service standards, to develop a new strategic communications framework that will clearly outline the roles and responsibilities of the new Communications and Engagement Branch.
The branch will develop guidelines on how it works with internal partners (and what is expected of them in the process), including tiered levels of service. Once finalized and approved by senior management, the framework will be shared with internal partners and made available on the ICN.
Deliverables and timelines
The results and recommendations of the internal working group's review will be presented to senior management by April 2024.
The comprehensive strategic communications framework for Statistics Canada, which will provide guidelines on communications activities, including roles and responsibilities of all parties and tiered levels of service, will be approved by senior management, shared with internal partners and made available on the ICN by May 2024.
Recommendation 2
The ACS of Field 3, in collaboration with the ACS of Field 7, should ensure that
regular updates on the progress of the transition are provided to all employees
employees directly impacted by the change are informed of the new direction of communications and dissemination and engaged for input during the transition period through various channels (e.g., townhalls)
communications and dissemination services, including key contact information, processes for service requests and related service standards, are updated periodically and promoted through various channels.
Management response
Management agrees with the recommendation.
Updates on the progress of the transition will be communicated to all employees.
To ensure that all impacted employees are aware of the transition to the new structure and the impact of the change,
Field 7 held a townhall with a question and answer session, as well as a presentation to management, followed by a welcome message from the ACS of Field 7 in April and May 2023.
Field 3 will use a change management approach.
This approach will include messaging for Communications and Engagement Branch employees and internal partners, with guidance provided on the new structure and new contacts where required.
Once well established, the Communications and Engagement Branch will organize a "roadshow" to meet with other divisions and fields to introduce itself and help build awareness and understanding of how it will be operationalizing the new vision of Connecting with Canadians.
All Field 3 employees will continue to be engaged and kept up to date through a variety of channels, including townhalls and meetings, newsletters, and the ICN.
Standard operating procedures (SOPs) and service standards for key communications and dissemination services will be updated or developed as needed.
The SOPs will clearly outline the process for requesting various communications and dissemination services (i.e., whom to contact, how, when, why, what to expect).
They will be reviewed annually, updated as needed and promoted via various channels in addition to the ICN (e.g., field debriefs, the Editorial Board, shared directly with clients).
Deliverables and timelines
The transition to the new structure will be completed by October 2023. However, internal communications will continue until April 2024 to ensure that the transition is smooth and questions are addressed as employees settle into the new structure.
Because the integration of the Dissemination Division in Field 7 started in May 2023, a townhall with a question and answer session was already held by Field 7 in May 2023.
Townhalls and meetings and internal messages for employees of the new Communications and Engagement Branch will be completed by April 2024.
The roadshow for the new Communications and Engagement Branch will be done by July 2024.
SOPs and service standards, including an annual review process to ensure they are kept up to date, will be completed and communicated through the ICN and various channels (e.g., field debriefs, the Editorial Board, shared directly with clients) by June 2024.
Recommendation 3
The ACS of Field 3, in collaboration with the ACS of Field 7, should strengthen the performance measurement of their respective communications and dissemination activities by
reviewing their respective performance measurement framework (e.g., performance information profiles, dashboards, strategic roadmaps) to ensure it aligns with the new structure
leveraging existing data to enhance business intelligence and decision making, including providing guidance to internal partners (e.g., SMAs) to effectively use available information
incorporating more operational efficiency metrics
implementing a process to monitor service standards and satisfaction of internal users.
Management response
Management agrees with the recommendation.
The Communications and Engagement Branch and the Dissemination Division will review their respective performance measurement frameworks to ensure alignment with the new structure for communications and dissemination.
Existing communications and dissemination divisional dashboards will be reviewed to ensure that operational efficiency indicators are included, as applicable.
The Communications and Engagement Branch, working closely with Field 3 and the Dissemination Division, will explore new ways to provide more analytics to target audiences, including tools for internal partners to enhance business intelligence and decision making (e.g., new and revised corporate dashboards to support the One Plan and the Connecting with Canadians strategy).
As part of the aforementioned Communications and Engagement Branch roadshow to internal partners, a presentation and training will be included on communications and engagement services and how clients can be more involved with the evaluation of products (e.g., how they can be more prescriptive in the type of results they are looking for in the evaluation section of a communications plan, or what performance indicators are required).
and d. With respect to the monitoring of service standards and satisfaction of internal users, the following measures will be taken.
The Dissemination Division will continue to leverage the SRM system to monitor adherence to service standards and user satisfaction. Results will be reported to senior management on an annual basis for continuous improvement.
The Communications and Engagement Branch will implement a process to monitor adherence to service standards. Results will be reported to senior management on an annual basis for continuous improvement.
The branch, working closely with Field 3, will explore ways to measure user satisfaction by leveraging existing tools. Options and recommendations will be presented to senior management for implementation approval.
Deliverables and timelines
Updated Communications and Engagement Branch and Dissemination Division performance measurement frameworks (including dashboards and operational efficiency indicators, as applicable) will be implemented by June 2024.
Analytics to target audiences and tools for clients to enhance business intelligence and decision making (e.g., corporate dashboards to support the One Plan and the Connecting with Canadians strategy) will be provided by June 2024.
Training and a presentation on evaluation methods will be provided in July 2024 as part of the Communications and Engagement Branch roadshow.
Service standards and user satisfaction results for dissemination services will be monitored and reported to senior management by April 2024.
Service standards for communications services will be monitored and reported to senior management by September 2024.
Options to measure user satisfaction with communications services and recommendations will be presented to senior management for implementation approval by September 2024.
Appendix A –Field 4 divisions and their services
Communications Branch
1. Official Release and Communication Services Division
Description: Develops and implements the strategic management framework, policies and plans governing the communications advice, standards, tools and services provided by the agency's official release program. Supports the modernization of publishing initiatives and the long-term vision to reach more Canadians through new and modern tools. Also provides high-quality language and creative communications services to the agency's subject-matter experts to improve the public's understanding of official statistics on Canada's economy and society.
Services offered
Official release (The Daily, StatsCAN Plus, Policy on Official Release)
Innovative communications (e.g., Connecting with Canadians strategy, web analytics, StatsCAN app)
Editorial services (e.g., editing, proofreading)
2. Census Communications Division
Description: Develops and implements communications strategies that support all phases of the census cycle: content consultation, testing, recruitment, early enumeration, collection, dissemination and evaluation. Aims to enhance the public's knowledge of the importance of census information and the census's mandatory nature, increase the number of candidates applying for census jobs, support online completion and self-response, and foster the visibility and use of census data.
Services offered
Social marketing and engagement (promoting census awareness)
Respondent communications
Census media relations
3. Stakeholder Relations and Engagement Division
Description: Ensures timely communication and dissemination of Statistics Canada information to Canadians and works to foster a positive image of Statistics Canada as the national statistical agency. Manages the corporate social media accounts, social trends monitoring and reporting, media monitoring and media relations, public consultations, and usability testing. Plays a key role in maintaining relationships with target markets, including key data users, associations, stakeholders (internal and external) and the public. Also oversees the reporting of key performance metrics for the agency, as well as supporting the Office of the Principal Service Officer.
Services offered
Social media
Media relations
External engagement and marketing (e.g., coordination and logistics of events, engagement opportunities)
Internal engagement (e.g., focal points, outreach with federal partners)
4. Strategic Communications and Planning Division
Description: Determines communications priorities and the long-term vision, develops overarching communications plans, and provides advice to clients in various fields across the agency, with the goal of ensuring that Statistics Canada is a trusted steward of data about Canada and Canadians. Serves as the front door and main point of contact for the Communications Branch. Helps clients navigate the services the branch offers by connecting them with relevant communications teams and working closely with all parties to achieve clients' goals, while fulfilling the agency's mandate. Uses knowledge and understanding of the public environment to identify opportunities to advance corporate priorities; improve public understanding of Statistics Canada's mandate and value; increase transparency and strengthen public trust, while identifying and managing emerging issues that could impact the corporate reputation; and strengthen connections and drive meaningful engagement with key stakeholders. Develops and implements communications policies, practices, plans and products to achieve these objectives and support internal and external communications activities.
Services offered
Strategic communications (front door for communications advice, planning and coordination)
Description: Promotes a user centric approach to providing timely access to high-quality statistical information that matters.
Services offered
Centre of Expertise on Accessibility
Client Relations Office
Web modernization
Dissemination special projects
Internal Communications Network (ICN)
Output database services
Publishing services
Web development
Web analytics
Appendix B –The Eight Wastes of Lean
1. Defects –Information, products, and services that are incomplete or inaccurate
Examples
Inaccurate applications
Broken parts
Missed deadlines
Example from the evaluation
A few internal users noted instances where there were errors in the text of their releases after sending them to Field 4. These errors include the meaning of the text changing after it has gone through review, editing and translation with Field 4.
2. Overproduction –Making more of something or making it earlier or faster than it is needed
Examples
Extra copies of reports
Redundant storage (paper and electronic)
"Reply all" on emails
Examples from the evaluation
A few Field 4 interviewees reported that internal users had requested products that may not be as effective in garnering interest for their target audience.
There is redundancy noted among publications. For example, the creation of web-based and PDF versions of the same product can be resource consuming, although it is a federal requirement.
A few Field 4 interviewees reported that there is a tendency in the field to overproduce and focus on production, rather than maintaining or tweaking existing products.
A few Field 4 interviewees also wondered whether the field was putting effort toward the right products that were going to have the greatest reach (e.g., a focus on resource-heavy products, such as podcasts, that are not accessed by many people).
The information regarding the editorial calendar and upcoming releases is currently maintained in disparate formats and within different groups, representing a burden in the process of reconciliation and monitoring.
The Communications Branch relies heavily on emails for interactions with stakeholders and progress tracking, increasing the risk of overlooking important information.
3. Waiting –Waiting for information, equipment, materials, parts or people
Examples
Waiting for approvals
Waiting for equipment
Waiting for large batches
Examples from the evaluation
There is a heavy reliance on IT on the part of Dissemination. If something requires fixing, Dissemination may need to wait for IT to fix it. However, Dissemination may possess the skills to undertake some activities that IT is supposed to do (e.g., work with JavaScript).
A few interviewees from the Communications Branch noted that approval processes can take a long time.
There can be a long lead time to disseminate information, which can result in missed opportunities (e.g., producing videos).
4. Non-utilized talent – Not properly utilizing people's experience, skills, knowledge, or creativity
Examples
Employees unable to make decisions
Skilled employees doing unskilled tasks
Employees not fully trained
Examples from the evaluation
SMAs take on communications and dissemination responsibilities by undertaking them in-house (e.g., translation), taking them away from performing more SMA-related tasks.
Intelligence from ROs is being underutilized. They can tailor messages to their region-based stakeholders and respective audiences.
5. Transportation – Unnecessary movement of materials, information or equipment
Examples
Hand-offs between functions
Multiple reviews
Sending and resending emails
Moving documents, files or equipment between departments or locations unnecessarily
Travelling to meetings or events that could be conducted remotely
Examples from the evaluation
Each time Integrated Metadatabase pages and PDF documents go online, regardless of the changes made (even minor ones), a comprehensive review by SMAs is required.
A need was identified for greater centralization of documents (for example, a centralized location that would enable SMAs to access the documents and information they need).
6. Inventory –Accumulation of parts, information, applications, etc. beyond what is required by the client
Examples
Stockpiling supplies
Information piling up for data entry
Keeping data longer than necessary
Example from the evaluation
Interviewees indicated that there is limited capacity within Field 4 to meet all demands, and subsequently there are delays (or pile-up), which led to a backlog of tasks.
7. Motion –Any movement by people that is not of value to the client
Examples
Repetitive keystrokes
Walking between equipment
Switching applications
Examples from the evaluation
Some internal users noted that it is unclear who the first point of contact is for accessing communications services.
While information is available on the ICN, a few SMA interviewees noted that this information can sometimes be difficult to access or is outdated.
8. Extra processing – Any steps that do not add value in the eyes of the client
Examples
Extra formatting, extra fields
Extra features, excess detail
Extra report information
Example from the evaluation
A few internal users reported that, upon reaching out to SCPD for assistance with specific needs, SCPD wanted to do a full communications plan instead of just what was requested.
This survey is conducted by Statistics Canada in order to collect the necessary information to support the Integrated Business Statistics Program (IBSP). This program combines various survey and administrative data to develop comprehensive measures of the Canadian economy.
The statistical information from the IBSP serves many purposes, including:
calculating each province and territory's fair share of federal-provincial transfer payments for health, education and social programs
establishing government programs to assist businesses
assisting the business community in negotiating contracts and collective agreements
supporting the government in making informed decisions about fiscal, monetary and foreign exchange policies
indexing social benefit programs and determining tax brackets
enabling academics and economists to analyze the economic performance of Canadian industries and to better understand rapidly evolving business environments.
Your information may also be used by Statistics Canada for other statistical and research purposes.
Your participation in this survey is required under the authority of the Statistics Act.
Other important information
Authorization to collect this information
Data are collected under the authority of the Statistics Act, Revised Statutes of Canada, 1985, Chapter S-19.
Confidentiality
By law, Statistics Canada is prohibited from releasing any information it collects that could identify any person, business, or organization, unless consent has been given by the respondent, or as permitted by the Statistics Act. Statistics Canada will use the information from this survey for statistical purposes only.
Record linkages
To enhance the data from this survey and to reduce the reporting burden, Statistics Canada may combine the acquired data with information from other surveys or from administrative sources.
Data-sharing agreements
To reduce respondent burden, Statistics Canada has entered into data-sharing agreements with provincial and territorial statistical agencies and other government organizations, which have agreed to keep the data confidential and use them only for statistical purposes. Statistics Canada will only share data from this survey with those organizations that have demonstrated a requirement to use the data.
Section 11 of the Statistics Act provides for the sharing of information with provincial and territorial statistical agencies that meet certain conditions. These agencies must have the legislative authority to collect the same information, on a mandatory basis, and the legislation must provide substantially the same provisions for confidentiality and penalties for disclosure of confidential information as the Statistics Act. Because these agencies have the legal authority to compel businesses to provide the same information, consent is not requested and businesses may not object to the sharing of the data.
For this survey, there are Section 11 agreements with the provincial and territorial statistical agencies of Newfoundland and Labrador, Nova Scotia, New Brunswick, Québec, Ontario, Manitoba, Saskatchewan, Alberta, British Columbia and the Yukon. The shared data will be limited to information pertaining to business establishments located within the jurisdiction of the respective province or territory.
Section 12 of the Statistics Act provides for the sharing of information with federal, provincial or territorial government organizations. Under Section 12, you may refuse to share your information with any of these organizations by writing a letter of objection to the Chief Statistician, specifying the organizations with which you do not want Statistics Canada to share your data and mailing it to the following address:
Chief Statistician of Canada
Statistics Canada
Attention of Director, Enterprise Statistics Division
150 Tunney's Pasture Driveway
Ottawa, Ontario
K1A 0T6
For this survey, there are Section 12 agreements with the statistical agencies of Prince Edward Island, the Northwest Territories and Nunavut.
For agreements with provincial and territorial government organizations, the shared data will be limited to information pertaining to business establishments located within the jurisdiction of the respective province or territory.
Business or organization and contact information
1. Verify or provide the business or organization's legal and operating name and correct where needed.
Note: Legal name modifications should only be done to correct a spelling error or typo.
Legal Name
The legal name is one recognized by law, thus it is the name liable for pursuit or for debts incurred by the business or organization. In the case of a corporation, it is the legal name as fixed by its charter or the statute by which the corporation was created.
Modifications to the legal name should only be done to correct a spelling error or typo.
To indicate a legal name of another legal entity you should instead indicate it in question 3 by selecting 'Not currently operational' and then choosing the applicable reason and providing the legal name of this other entity along with any other requested information.
Operating Name
The operating name is a name the business or organization is commonly known as if different from its legal name. The operating name is synonymous with trade name.
Legal name:
Operating name (if applicable):
2. Verify or provide the contact information of the designated business or organization contact person for this questionnaire and correct where needed.
Note: The designated contact person is the person who should receive this questionnaire. The designated contact person may not always be the one who actually completes the questionnaire.
First name:
Last name:
Title:
Preferred language of communication:
English
French
Mailing address (number and street):
City:
Province, territory or state:
Postal code or ZIP code:
Country:
Canada
United States
Email address:
Telephone number (including area code):
Extension number (if applicable):
The maximum number of characters is 10.
Fax number (including area code):
3. Verify or provide the current operational status of the business or organization identified by the legal and operating name above.
Operational
Not currently operational
Why is this business or organization not currently operational?
Seasonal operations
When did this business or organization close for the season?
Date
When does this business or organization expect to resume operations?
Date
Ceased operations
When did this business or organization cease operations?
Date
Why did this business or organization cease operations?
Bankruptcy
Liquidation
Dissolution
Other - specify the other reasons for ceased operations
Sold operations
When was this business or organization sold?
Date
What is the legal name of the buyer?
Amalgamated with other businesses or organizations
When did this business or organization amalgamate?
Date
What is the legal name of the resulting or continuing business or organization?
What are the legal names of the other amalgamated businesses or organizations?
Temporarily inactive but will re-open
When did this business or organization become temporarily inactive?
Date
When does this business or organization expect to resume operations?
Date
Why is this business or organization temporarily inactive?
No longer operating due to other reasons
When did this business or organization cease operations?
Date
Why did this business or organization cease operations?
4. Verify or provide the current main activity of the business or organization identified by the legal and operating name above.
Note: The described activity was assigned using the North American Industry Classification System (NAICS).
This question verifies the business or organization's current main activity as classified by the North American Industry Classification System (NAICS). The North American Industry Classification System (NAICS) is an industry classification system developed by the statistical agencies of Canada, Mexico and the United States. Created against the background of the North American Free Trade Agreement, it is designed to provide common definitions of the industrial structure of the three countries and a common statistical framework to facilitate the analysis of the three economies. NAICS is based on supply-side or production-oriented principles, to ensure that industrial data, classified to NAICS, are suitable for the analysis of production-related issues such as industrial performance.
The target entity for which NAICS is designed are businesses and other organizations engaged in the production of goods and services. They include farms, incorporated and unincorporated businesses and government business enterprises. They also include government institutions and agencies engaged in the production of marketed and non-marketed services, as well as organizations such as professional associations and unions and charitable or non-profit organizations and the employees of households.
The associated NAICS should reflect those activities conducted by the business or organizational units targeted by this questionnaire only, as identified in the 'Answering this questionnaire' section and which can be identified by the specified legal and operating name. The main activity is the activity which most defines the targeted business or organization's main purpose or reason for existence. For a business or organization that is for-profit, it is normally the activity that generates the majority of the revenue for the entity.
The NAICS classification contains a limited number of activity classifications; the associated classification might be applicable for this business or organization even if it is not exactly how you would describe this business or organization's main activity.
Please note that any modifications to the main activity through your response to this question might not necessarily be reflected prior to the transmitting of subsequent questionnaires and as a result they may not contain this updated information.
The following is the detailed description including any applicable examples or exclusions for the classification currently associated with this business or organization.
Description and examples
This is the current main activity
This is not the current main activity
Provide a brief but precise description of this business or organization's main activity:
e.g., breakfast cereal manufacturing, shoe store, software development
Main activity
5. You indicated that is not the current main activity.
Was this business or organization's main activity ever classified as: ?
Yes
When did the main activity change?
Date:
No
6. Search and select the industry classification code that best corresponds to this business or organization's main activity.
Select this business or organization's activity sector (optional)
Farming or logging operation
Construction company or general contractor
Manufacturer
Wholesaler
Retailer
Provider of passenger or freight transportation
Provider of investment, savings or insurance products
Real estate agency, real estate brokerage or leasing company
Provider of professional, scientific or technical services
Provider of health care or social services
Restaurant, bar, hotel, motel or other lodging establishment
Other sector
Reporting period information
1. What are the start and end dates of this business's or organization's most recently completed fiscal year?
For this survey, the end date should fall between April 1, 2023 and March 31, 2024.
Here are twelve common fiscal periods that fall within the targeted dates:
May 1, 2022 to April 30, 2023
June 1, 2022 to May 31, 2023
July 1, 2022 to June 30, 2023
August 1, 2022 to July 31, 2023
September 1, 2022 to August 31, 2023
October 1, 2022 to September 30, 2023
November 1, 2022 to October 31, 2023
December 1, 2022 to November 30, 2023
January 1, 2023 to December 31, 2023
February 1, 2023 to January 31, 2024
March 1, 2023 to February 28, 2024
April 1, 2023 to March 31, 2024.
Here are other examples of fiscal periods that fall within the required dates:
September 18, 2022 to September 15, 2023 (e.g., floating year-end)
June 1, 2023 to December 31, 2023 (e.g., a newly opened business).
Fiscal year start date:
Fiscal year-end date:
2. What is the reason the reporting period does not cover a full year?
Select all that apply:
Seasonal operations
New business
Change of ownership
Temporarily inactive
Change of fiscal year
Ceased operations
Other - Specify reason the reporting period does not cover a full year:
Additional reporting instructions
1. Throughout this questionnaire, please report financial information in thousands of Canadian dollars.
For example, an amount of $763,880.25 should be reported as:
CAN$ '000: $764,000
I will report in the format above
Revenue
1. For the reporting period of YYYY-MM-DD to YYYY-MM-DD, what was this business's revenue from each of the following sources?
Notes:
a detailed breakdown may be requested in other sections
these questions are asked of many different industries. Some questions may not apply to this business.
Report dollar amounts in thousands of Canadian dollars.
a. Sales of goods and services (e.g., fees, commissions, services revenue)
Report net of returns and allowances.
Sales of goods and services are defined as amounts derived from the sale of goods and services (cash or credit), falling within a business's ordinary activities. Sales should be reported net of trade discount, value added tax and other taxes based on sales.
Include:
sales from Canadian locations (domestic and export sales)
transfers to other business units or a head office of your firm.
Exclude:
transfers into inventory and consignment sales
federal, provincial and territorial sales taxes and excise duties and taxes
intercompany sales in consolidated financial statements.
b. Rental and leasing
Include rental or leasing of apartments, commercial buildings, land, office space, residential housing, investments in co-tenancies and co-ownerships, hotel or motel rooms, long and short term vehicle leasing, machinery or equipment, storage lockers, etc.
c. Commissions
Include commissions earned on the sale of products or services by businesses such as advertising agencies, brokers, insurance agents, lottery ticket sales, sales representatives and travel agencies - compensation could also be reported under this item (for example, compensation for collecting sales tax).
d. Subsidies (including grants, donations, fundraising and sponsorships)
Include:
non-repayable grants, contributions and subsidies from all levels of government
revenue from private sector (corporate and individual) sponsorships, donations and fundraising.
e. Royalties, rights, licensing and franchise fees
A royalty is defined as a payment received by the holder of a copyright, trademark or patent.
Include revenue received from the sale or use of all intellectual property rights of copyrighted materials such as musical, literary, artistic or dramatic works, sound recordings or the broadcasting of communication signals.
f. Dividends
Include:
dividend income
dividends from Canadian sources
dividends from foreign sources
patronage dividends.
Exclude equity income from investments in subsidiaries or affiliates.
g. Interest
Include:
investment revenue
interest from foreign sources
interest from Canadian bonds and debentures
interest from Canadian mortgage loans
interest from other Canadian sources.
Exclude equity income from investments in subsidiaries or affiliates.
h. All other revenue (Include intracompany transfers)
Include amounts not included in questions a. to g.
Total revenue
The sum of sub-questions a. to h.
CAN$ '000
a. Sales of goods and services
Include sales, commissions, rental and leasing revenue if they are this business's primary revenue source.
b. Rental and leasing
Report only if this is a secondary revenue source. If rental and leasing are your primary revenue source, report at question a.
c. Commissions
Report only if this is a secondary revenue source. If commissions are your primary revenue source, report at question a.
d. Subsidies
Include grants, donations, fundraising and sponsorships.
e. Royalties, rights, licensing and franchise fees
f. Dividends
g. Interest
h. Other
Include intracompany transfers.
Specify all other revenue:
Total revenue
Expenses
1. For the reporting period of YYYY-MM-DD to YYYY-MM-DD, what were this business's expenses for the following items?
Notes:
a detailed breakdown may be requested in other sections
these questions are asked of many different industries. Some questions may not apply to this business.
Report dollar amounts in thousands of Canadian dollars.
a. Cost of goods sold
Many business units distinguish their costs of materials from their other business expenses (selling, general and administrative). This item is included to allow you to easily record your costs/expenses according to your normal accounting practices.
Include:
cost of raw materials and/or goods purchased for resale - net of discounts earned on purchases
freight in and duty.
Exclude all costs associated with salaries, wages, benefits, commissions and subcontracts (report at Employment costs and expenses, and Subcontracts).
b. Employment costs and expenses
b1. Salaries, wages and commissions
Please report all salaries and wages (including taxable allowances and employment commissions as defined on the T4 - Statement of Remuneration Paid) before deductions for this reporting period.
Include:
vacation pay
bonuses (including profit sharing)
employee commissions
taxable allowances (e.g., room and board, vehicle allowances, gifts such as airline tickets for holidays)
severance pay.
Exclude all payments and expenses associated with casual labour and outside contract workers (report at Subcontracts).
b2. Employee benefits
Include contributions to:
health plans
insurance plans
employment insurance
pension plans
workers' compensation
association dues
contributions to any other employee benefits such as child care and supplementary unemployment benefit (SUB) plans
contributions to provincial and territorial health and education payroll taxes.
c. Subcontracts
Subcontract expense refers to the purchasing of services from outside of the company rather than providing them in-house.
Include:
hired casual labour and outside contract workers
custom work and contract work
subcontract and outside labour
hired labour.
d. Research and development fees
Expenses from activities conducted with the intention of making a discovery that could either lead to the development of new products or procedures, or to the improvement of existing products or procedures.
e. Professional and business fees
Include:
legal services
accounting and auditing fees
consulting fees
education and training fees
appraisal fees
management and administration fees
property management fees
information technology (IT) consulting and service fees (purchased)
architectural fees
engineering fees
scientific and technical service fees
other consulting fees (management, technical and scientific)
veterinary fees
fees for human health services
payroll preparation fees
all other professional and business service fees.
Exclude service fees paid to Head Office (report at All other costs and expenses).
f. Utilities
Utility expenses related to operating your business unit such as water, electricity, gas, heating and hydro.
Include:
diesel, fuel wood, natural gas, oil and propane
sewage.
Exclude:
energy expenses covered in your rental and leasing contracts
telephone, Internet and other telecommunications
vehicle fuel (report at All other costs and expenses).
g. Office and computer related expenses
Include:
office stationery and supplies, paper and other supplies for photocopiers, printers and fax machines
postage and courier (used in the day to day office business activity)
computer and peripherals upgrade expenses
data processing.
Exclude telephone, Internet and other telecommunication expenses (report at Telephone, Internet and other telecommunication).
h. Telephone, Internet and other telecommunication
Include:
internet
telephone and telecommunications
cellular telephone
fax machine
pager.
i. Business taxes, licenses and permits
Include:
property taxes paid directly and property transfer taxes
vehicle license fees
beverage taxes and business taxes
trade license fees
membership fees and professional license fees
provincial capital tax.
j. Royalties, franchise fees and memberships
Include:
amounts paid to holders of patents, copyrights, performing rights and trademarks
gross overriding royalty expenses and direct royalty costs
resident and non-resident royalty expenses
franchise fees.
Exclude Crown royalties
k. Crown charges
Federal or Provincial royalty, tax, lease or rental payments made in relation to the acquisition, development or ownership of Canadian resource properties.
Include:
Crown royalties
Crown leases and rentals
oil sand leases
stumpage fees.
l. Rental and leasing
Include:
lease rental expenses, real estate rental expenses, condominium fees and equipment rental expenses
motor vehicle rental and leasing expenses
studio lighting and scaffolding
machinery and equipment rental expenses
storage expenses
road and construction equipment rental
fuel and other utility costs covered in your rental and leasing contracts.
m. Repair and maintenance
Include:
buildings and structures
machinery and equipment
security equipment
vehicles
costs related to materials, parts and external labour associated with these expenses
janitorial and cleaning services and garbage removal.
n. Amortization and depreciation
Include:
direct cost depreciation of tangible assets and amortization of leasehold improvements
amortization of intangible assets (e.g., amortization of goodwill, patents, franchises, copyrights, trademarks, deferred charges, organizational costs).
o. Insurance
Insurance recovery income should be deducted from insurance expenses.
Include:
professional and other liability insurance
motor vehicle and property insurance
executive life insurance
bonding, business interruption insurance and fire insurance.
p. Advertising, marketing, promotion, meals and entertainment
Include:
newspaper advertising and media expenses
catalogues, presentations and displays
tickets for theatre, concerts and sporting events for business promotion
fundraising expenses
meals, entertainment and hospitality purchases for clients.
exploration and development (including prospect/geological, well abandonment and dry holes, exploration expenses, development expenses)
amounts not included in sub-questions a. to t. above.
Total expenses
The sum of sub-questions a. to u.
CAN$ '000
a. Cost of goods sold
a1. Opening inventories
a2. Purchases
Include raw materials, goods purchased for resale and non-returnable containers.
Exclude change in inventories.
a3. Closing inventories
a4. Cost of goods sold
Opening inventories plus purchases minus closing inventories.
b. Employment costs and expenses
Include all employees who were issued a T4.
Exclude commissions to be paid to non-employees, report at sub-question c.
b1. Salaries, wages and commissions
b2. Employee benefits
c. Subcontracts
Include commissions to non-employees.
Exclude research and development.
d. Research and development fees.
Exclude in-house research and development.
e. Professional and business fees
e.g., legal, accounting, consulting, scientific and property management fees
f. Utilities
e.g., electricity, water, gas
g. Office and computer related expenses
e.g., office supplies, postage, computer upgrades
h. Telephone, Internet and other telecommunication
i. Business taxes, licenses and permits
e.g., beverage tax, business tax, license fees, property taxes
j. Royalties, franchise fees and memberships
Exclude Crown royalties.
k. Crown charges
(for logging, mining and energy industries only)
l. Rental and leasing
Include land buildings, equipment, vehicles.
m. Repair and maintenance
Include buildings, equipment, vehicles.
n. Amortization and depreciation
o. Insurance
p. Advertising, marketing, promotion, meals and entertainment
q. Travel, meetings and conventions
r. Financial services
e.g., bank charges, transaction fees
s. Interest expense
t. Other non-production-related costs and expenses
Include bad debts, loan losses, donations, political contributions and inventory write-down.
u. All other costs and expenses
Include intracompany expenses.
Specify all other costs and expenses:
Total expenses
Industry characteristics
1. What were this business's sales for each of the following goods and services?
Please report all amounts in thousands of Canadian dollars.
CAN$ '000
a. Automotive repair and maintenance services
a1. Automobiles and light trucks
Include body shop, glass replacement, exhaust, washing and cleaning services.
a2. Heavy trucks and buses
a3. Motor homes, travel trailers and campers
b. Electronic and precision equipment repair and maintenance services
c. Commercial and industrial machinery and equipment repair and maintenance services
d. Sale of goods purchased for resale, as is
e.g., wipers, fuses, tires, batteries
Exclude sales reported previously.
e. Other
Specify all other sales of goods and services:
Total sales of goods and services
2. Of this business's total sales [amount], what was the percentage breakdown for parts and labour?
Percentage
a. Parts
b. Labour
3. What were this business's opening inventory, purchases and closing inventory for the following items?
Opening inventory CAN$ '000
Purchases
CAN$ '000
Closing inventory CAN$ '000
a. Parts used in repair work only
b. Other over-the-counter merchandise
Total inventory
Sales by type of client
1. What was this business's breakdown of sales by the following types of client?
Sales by type of client
This section is designed to measure which sector of the economy purchases your services.
Please provide a percentage breakdown of your sales by type of client.
Please ensure that the sum of percentages reported in this section equals 100%.
a. to c. Clients in Canada
a. Individuals and households
Please report the percentage of sales to individuals and households who do not represent the business or government sector.
b. Businesses
Percentage of sales sold to the business sector should be reported here.
Include sales to Crown corporations.
c. Governments, not-for-profit organizations and public institutions (e.g., hospitals, schools)
Percentage of sales to federal, provincial, territorial and municipal governments should be reported here.
Include: sales to hospitals, schools, universities and public utilities.
d. Clients outside Canada
Please report the percentage of total sales to customers or clients located outside Canada including foreign businesses, foreign individuals, foreign institutions and/or governments.
Include sales to foreign subsidiaries and affiliates.
Percentage
a. Clients in Canada — individuals and households
b. Clients in Canada — businesses
c. Clients in Canada — governments, not-for-profit organizations and public institutions
e.g., hospitals and schools
d. Clients outside Canada
Total percentage
Sales by consumer location
1. What was the percentage breakdown of this business's sales by consumer location?
Consumer location is the location where the goods or services will ultimately be used.
This section is designed to measure which sector of the economy purchases your services.
If ultimate consumer location is not known, the following are acceptable substitutes:
shipping destination
client's billing address
location of this business's retail customers
location of this business's warehouses/distribution centres.
What was the percentage breakdown of this business's sales by consumer location?
Percentage
Newfoundland and Labrador
Prince Edward Island
Nova Scotia
New Brunswick
Quebec
Ontario
Manitoba
Saskatchewan
Alberta
British Columbia
Yukon
Northwest Territories
Nunavut
United States
All other countries
Total percentage
International transactions - revenue received from exports
1. During the reporting period of YYYY-MM-DD to YYYY-MM-DD, did this business receive revenue from clients outside Canada for the sale of products, services, royalties, rights, licensing or franchise fees?
This section is intended to measure the value of international transactions on goods, services, royalties and licenses fees. It covers imported services and goods purchased outside Canada as well as the value of exported services and goods to clients/customers outside Canada. Please report also royalties, rights, licensing and franchise fees paid to and/or received from outside Canada. Services cover a variety of industrial, professional, trade and business services.
Yes
No
2. What was the revenue received from clients outside Canada?
This section is intended to measure the value of international transactions on goods, services, royalties and licenses fees. It covers imported services and goods purchased outside Canada as well as the value of exported services and goods to clients/customers outside Canada. Please report also royalties, rights, licensing and franchise fees paid to and/or received from outside Canada. Services cover a variety of industrial, professional, trade and business services.
Revenue received (CAN$ '000):
3. What was the percentage breakdown of revenue received from clients outside Canada by goods, services and royalties?
This section is intended to measure the value of international transactions on goods, services, royalties and licenses fees. It covers imported services and goods purchased outside Canada as well as the value of exported services and goods to clients/customers outside Canada. Please report also royalties, rights, licensing and franchise fees paid to and/or received from outside Canada. Services cover a variety of industrial, professional, trade and business services.
Percentage
a. Goods
b. Services
c. Royalties, rights, licensing and franchise fees
Total percentage
4. What was the percentage breakdown of revenue received from clients outside Canada by country?
This section is intended to measure the value of international transactions on goods, services, royalties and licenses fees. It covers imported services and goods purchased outside Canada as well as the value of exported services and goods to clients/customers outside Canada. Please report also royalties, rights, licensing and franchise fees paid to and/or received from outside Canada. Services cover a variety of industrial, professional, trade and business services.
Percentage of revenue received from clients outside Canada by country
Table summary
This table contains no data. It is an example of an empty data table used by respondents to provide data to Statistics Canada.
Percentage
United States
Mexico
Provide the percentage of revenue received from any other countries - top 4 clients only
Other 1
Other 2
Other 3
Other 4
Total percentage
List of countries
Aruba
Afghanistan
Angola
Anguilla
Åland Islands
Albania
Andorra
United Arab Emirates
Argentina
Armenia
American Samoa
Antarctica
French Southern Territories
Antigua and Barbuda
Australia
Austria
Azerbaijan
Burundi
Belgium
Benin
Bonaire, Saint Eustatius and Saba
Burkina Faso
Bangladesh
Bulgaria
Bahrain
Bahamas
Bosnia and Herzegovina
Saint Barthélemy
Belarus
Belize
Bermuda
Bolivia
Brazil
Barbados
Brunei Darussalam
Bhutan
Bouvet Island
Botswana
Central African Republic
Cocos (Keeling) Islands
Switzerland
Chile
China
Côte d'Ivoire
Cameroon
Congo, The Democratic Republic of the
Congo, Republic of the
Cook Islands
Colombia
Comoros
Cape Verde
Costa Rica
Cuba
Curaçao
Christmas Island
Cayman Islands
Cyprus
Czech Republic
Germany
Djibouti
Dominica
Denmark
Dominican Republic
Algeria
Ecuador
Egypt
Eritrea
Western Sahara
Spain
Estonia
Ethiopia
Finland
Fiji
Falkland Islands (Malvinas)
France
Faroe Islands
Micronesia, Federated States of
Gabon
United Kingdom
Georgia
Guernsey
Ghana
Gibraltar
Guinea
Guadeloupe
Gambia
Guinea-Bissau
Equatorial Guinea
Greece
Grenada
Greenland
Guatemala
French Guiana
Guam
Guyana
Hong Kong Special Administrative Region
Heard Island and McDonald Islands
Honduras
Croatia
Haiti
Hungary
Indonesia
Isle of Man
India
British Indian Ocean Territory
Ireland, Republic of
Iran
Iraq
Iceland
Israel
Italy
Jamaica
Jersey
Jordan
Japan
Kazakhstan
Kenya
Kyrgyzstan
Cambodia
Kiribati
Saint Kitts and Nevis
Korea, South
Kuwait
Laos
Lebanon
Liberia
Libya
Saint Lucia
Liechtenstein
Sri Lanka
Lesotho
Lithuania
Luxembourg
Latvia
Macao Special Administrative Region
Saint Martin (French part)
Morocco
Monaco
Moldova
Madagascar
Maldives
Marshall Islands
Macedonia, Republic of
Mali
Malta
Burma (Myanmar)
Montenegro
Mongolia
Northern Mariana Islands
Mozambique
Mauritania
Montserrat
Martinique
Mauritius
Malawi
Malaysia
Mayotte
Namibia
New Caledonia
Niger
Norfolk Island
Nigeria
Nicaragua
Niue
Netherlands
Norway
Nepal
Nauru
New Zealand
Oman
Pakistan
Panama
Pitcairn
Peru
Philippines
Palau
Papua New Guinea
Poland
Puerto Rico
Korea, North
Portugal
Paraguay
West Bank and Gaza Strip (Palestine)
French Polynesia
Qatar
Réunion
Romania
Russian Federation
Rwanda
Saudi Arabia
Sudan
Senegal
Singapore
South Georgia and the South Sandwich Islands
Saint Helena
Svalbard and Jan Mayen
Solomon Islands
Sierra Leone
El Salvador
San Marino
Somalia
Saint Pierre and Miquelon
Serbia
Sao Tome and Principe
Suriname
Slovakia
Slovenia
Sweden
Swaziland
Sint Maarten (Dutch part)
Seychelles
Syria
Turks and Caicos Islands
Chad
Togo
Thailand
Tajikistan
Tokelau
Turkmenistan
Timor-Leste
Tonga
Trinidad and Tobago
Tunisia
Turkey
Tuvalu
Taiwan
Tanzania
Uganda
Ukraine
United States Minor Outlying Islands
Uruguay
Uzbekistan
Holy See (Vatican City State)
Saint Vincent and the Grenadines
Venezuela
Virgin Islands, British
Virgin Islands, United States
Viet Nam
Vanuatu
Wallis and Futuna
Samoa
Kosovo
Yemen
South Africa, Republic of
Zambia
Zimbabwe
International transactions - purchases from outside Canada (imports)
5. During the reporting period of YYYY-MM-DD to YYYY-MM-DD, did this business make payments to suppliers outside Canada for the purchase of products, services, royalties, rights, licensing or franchise fees?
This section is intended to measure the value of international transactions on goods, services, royalties and licenses fees. It covers imported services and goods purchased outside Canada as well as the value of exported services and goods to clients/customers outside Canada. Please report also royalties, rights, licensing and franchise fees paid to and/or received from outside Canada. Services cover a variety of industrial, professional, trade and business services.
Yes
No
6. What were the payments made to suppliers outside Canada?
This section is intended to measure the value of international transactions on goods, services, royalties and licenses fees. It covers imported services and goods purchased outside Canada as well as the value of exported services and goods to clients/customers outside Canada. Please report also royalties, rights, licensing and franchise fees paid to and/or received from outside Canada. Services cover a variety of industrial, professional, trade and business services.
Payments made (CAN$ '000):
7. What was the percentage breakdown of payments made to suppliers outside Canada by goods, services and royalties?
This section is intended to measure the value of international transactions on goods, services, royalties and licenses fees. It covers imported services and goods purchased outside Canada as well as the value of exported services and goods to clients/customers outside Canada. Please report also royalties, rights, licensing and franchise fees paid to and/or received from outside Canada. Services cover a variety of industrial, professional, trade and business services.
Percentage
a. Goods
b. Services
c. Royalties, rights, licensing and franchise fees
Total percentage
8. What was the percentage breakdown of payments made to suppliers outside Canada by country?
This section is intended to measure the value of international transactions on goods, services, royalties and licenses fees. It covers imported services and goods purchased outside Canada as well as the value of exported services and goods to clients/customers outside Canada. Please report also royalties, rights, licensing and franchise fees paid to and/or received from outside Canada. Services cover a variety of industrial, professional, trade and business services.
Percentage of revenue received from clients outside Canada by country
Table summary
This table contains no data. It is an example of an empty data table used by respondents to provide data to Statistics Canada.
Percentage
United States
Mexico
Provide the percentage of revenue received from any other countries - top 4 clients only
Other 1
Other 2
Other 3
Other 4
Total percentage
List of countries
Aruba
Afghanistan
Angola
Anguilla
Åland Islands
Albania
Andorra
United Arab Emirates
Argentina
Armenia
American Samoa
Antarctica
French Southern Territories
Antigua and Barbuda
Australia
Austria
Azerbaijan
Burundi
Belgium
Benin
Bonaire, Saint Eustatius and Saba
Burkina Faso
Bangladesh
Bulgaria
Bahrain
Bahamas
Bosnia and Herzegovina
Saint Barthélemy
Belarus
Belize
Bermuda
Bolivia
Brazil
Barbados
Brunei Darussalam
Bhutan
Bouvet Island
Botswana
Central African Republic
Cocos (Keeling) Islands
Switzerland
Chile
China
Côte d'Ivoire
Cameroon
Congo, The Democratic Republic of the
Congo, Republic of the
Cook Islands
Colombia
Comoros
Cape Verde
Costa Rica
Cuba
Curaçao
Christmas Island
Cayman Islands
Cyprus
Czech Republic
Germany
Djibouti
Dominica
Denmark
Dominican Republic
Algeria
Ecuador
Egypt
Eritrea
Western Sahara
Spain
Estonia
Ethiopia
Finland
Fiji
Falkland Islands (Malvinas)
France
Faroe Islands
Micronesia, Federated States of
Gabon
United Kingdom
Georgia
Guernsey
Ghana
Gibraltar
Guinea
Guadeloupe
Gambia
Guinea-Bissau
Equatorial Guinea
Greece
Grenada
Greenland
Guatemala
French Guiana
Guam
Guyana
Hong Kong Special Administrative Region
Heard Island and McDonald Islands
Honduras
Croatia
Haiti
Hungary
Indonesia
Isle of Man
India
British Indian Ocean Territory
Ireland, Republic of
Iran
Iraq
Iceland
Israel
Italy
Jamaica
Jersey
Jordan
Japan
Kazakhstan
Kenya
Kyrgyzstan
Cambodia
Kiribati
Saint Kitts and Nevis
Korea, South
Kuwait
Laos
Lebanon
Liberia
Libya
Saint Lucia
Liechtenstein
Sri Lanka
Lesotho
Lithuania
Luxembourg
Latvia
Macao Special Administrative Region
Saint Martin (French part)
Morocco
Monaco
Moldova
Madagascar
Maldives
Marshall Islands
Macedonia, Republic of
Mali
Malta
Burma (Myanmar)
Montenegro
Mongolia
Northern Mariana Islands
Mozambique
Mauritania
Montserrat
Martinique
Mauritius
Malawi
Malaysia
Mayotte
Namibia
New Caledonia
Niger
Norfolk Island
Nigeria
Nicaragua
Niue
Netherlands
Norway
Nepal
Nauru
New Zealand
Oman
Pakistan
Panama
Pitcairn
Peru
Philippines
Palau
Papua New Guinea
Poland
Puerto Rico
Korea, North
Portugal
Paraguay
West Bank and Gaza Strip (Palestine)
French Polynesia
Qatar
Réunion
Romania
Russian Federation
Rwanda
Saudi Arabia
Sudan
Senegal
Singapore
South Georgia and the South Sandwich Islands
Saint Helena
Svalbard and Jan Mayen
Solomon Islands
Sierra Leone
El Salvador
San Marino
Somalia
Saint Pierre and Miquelon
Serbia
Sao Tome and Principe
Suriname
Slovakia
Slovenia
Sweden
Swaziland
Sint Maarten (Dutch part)
Seychelles
Syria
Turks and Caicos Islands
Chad
Togo
Thailand
Tajikistan
Tokelau
Turkmenistan
Timor-Leste
Tonga
Trinidad and Tobago
Tunisia
Turkey
Tuvalu
Taiwan
Tanzania
Uganda
Ukraine
United States Minor Outlying Islands
Uruguay
Uzbekistan
Holy See (Vatican City State)
Saint Vincent and the Grenadines
Venezuela
Virgin Islands, British
Virgin Islands, United States
Viet Nam
Vanuatu
Wallis and Futuna
Samoa
Kosovo
Yemen
South Africa, Republic of
Zambia
Zimbabwe
Notification of intent to extract web data
1. Does this business have a website?
Yes
Specify the business website address 1
Specify the business website address 2
Specify the business website address 3
No
Notification of intent to extract web data
Statistics Canada engages in web-data extraction, also known as web scraping, which is a process by which information is gathered and copied from the Web using automated scripts or robots, for retrieval and analysis. As a result, we may visit the website for this business or organization to search for and compile additional information. The use of web scraping is part of a broader effort to reduce the response burden on businesses or organizations, as well as produce additional statistical indicators to ensure that our data remain accurate and relevant.
We will strive to ensure that the data collection does not interfere with the functionality of the website. Any data collected will be used by Statistics Canada for statistical and research purposes only, in accordance with the agency's privacy and confidentiality mandate. All information collected by Statistics Canada is strictly protected.
If you have any questions or concerns, please contact Statistics Canada Client Services, toll-free at 1-877-949-9492 (TTY: 1-800-363-7629) or by email at infostats@statcan.gc.ca- this link will open in a new window. Additional information about this survey can be found by selecting the following link: Information for survey participants (ISP).
Changes or events
1. Indicate any changes or events that affected the reported values for this business or organization, compared with the last reporting period.
Select all that apply:
Strike or lock-out
Exchange rate impact
Price changes in goods or services sold
Contracting out
Organizational change
Price changes in labour or raw materials
Natural disaster
Recession
Change in product line
Sold business or business units
Expansion
New or lost contract
Plant closures
Acquisition of business or business units
Other - specify the other changes or events:
No changes or events
Contact person
2. Statistics Canada may need to contact the person who completed this questionnaire for further information.
Is Provided Given Names, Provided Family Name the best person to contact?
Yes
No
Who is the best person to contact about this questionnaire?
First name:
Last name:
Title:
Email address:
Telephone number (including area code):
Extension number (if applicable):
The maximum number of characters is 5.
Fax number (including area code):
Feedback
3. How long did it take to complete this questionnaire?
Include the time spent gathering the necessary information.
Hours:
Minutes:
4. Do you have any comments about this questionnaire?
This survey is conducted by Statistics Canada in order to collect the necessary information to support the Integrated Business Statistics Program (IBSP). This program combines various survey and administrative data to develop comprehensive measures of the Canadian economy.
The statistical information from the IBSP serves many purposes, including:
calculating each province and territory's fair share of federal-provincial transfer payments for health, education and social programs
establishing government programs to assist businesses
assisting the business community in negotiating contracts and collective agreements
supporting the government in making informed decisions about fiscal, monetary and foreign exchange policies
indexing social benefit programs and determining tax brackets
enabling academics and economists to analyze the economic performance of Canadian industries and to better understand rapidly evolving business environments.
Your information may also be used by Statistics Canada for other statistical and research purposes.
Your participation in this survey is required under the authority of the Statistics Act.
Other important information
Authorization to collect this information
Data are collected under the authority of the Statistics Act, Revised Statutes of Canada, 1985, Chapter S-19.
Confidentiality
By law, Statistics Canada is prohibited from releasing any information it collects that could identify any person, business, or organization, unless consent has been given by the respondent, or as permitted by the Statistics Act. Statistics Canada will use the information from this survey for statistical purposes only.
Record linkages
To enhance the data from this survey and to reduce the reporting burden, Statistics Canada may combine the acquired data with information from other surveys or from administrative sources.
Data-sharing agreements
To reduce respondent burden, Statistics Canada has entered into data-sharing agreements with provincial and territorial statistical agencies and other government organizations, which have agreed to keep the data confidential and use them only for statistical purposes. Statistics Canada will only share data from this survey with those organizations that have demonstrated a requirement to use the data.
Section 11 of the Statistics Act provides for the sharing of information with provincial and territorial statistical agencies that meet certain conditions. These agencies must have the legislative authority to collect the same information, on a mandatory basis, and the legislation must provide substantially the same provisions for confidentiality and penalties for disclosure of confidential information as the Statistics Act. Because these agencies have the legal authority to compel businesses to provide the same information, consent is not requested and businesses may not object to the sharing of the data.
For this survey, there are Section 11 agreements with the provincial and territorial statistical agencies of Newfoundland and Labrador, Nova Scotia, New Brunswick, Québec, Ontario, Manitoba, Saskatchewan, Alberta, British Columbia and the Yukon. The shared data will be limited to information pertaining to business establishments located within the jurisdiction of the respective province or territory.
Section 12 of the Statistics Act provides for the sharing of information with federal, provincial or territorial government organizations. Under Section 12, you may refuse to share your information with any of these organizations by writing a letter of objection to the Chief Statistician, specifying the organizations with which you do not want Statistics Canada to share your data and mailing it to the following address:
Chief Statistician of Canada
Statistics Canada
Attention of Director, Enterprise Statistics Division
150 Tunney's Pasture Driveway
Ottawa, Ontario
K1A 0T6
For this survey, there are Section 12 agreements with the statistical agencies of Prince Edward Island, the Northwest Territories and Nunavut and with Natural Resources Canada.
For agreements with provincial and territorial government organizations, the shared data will be limited to information pertaining to business establishments located within the jurisdiction of the respective province or territory.
Additional information
In cases where information is reported on an amalgamated basis and relates to operations in more than one province or territory, Statistics Canada may allocate a portion of the reported information to these provincial or territorial operations. The allocated information will be shared in accordance with the Section 11 or 12 agreements of the Statistics Act, as described above.
In cases where there is a separate head office, Statistics Canada may adjust the reported revenues of that head office so that those revenues more fully reflect the value of the services the head office provides. In such cases, there will be a corresponding adjustment to the reported expenses of the units served. The adjusted information will be shared in accordance with the Section 11 or 12 agreements of the Statistics Act, as described above.
Business or organization and contact information
1. Verify or provide the business or organization's legal and operating name and correct where needed.
Note: Legal name modifications should only be done to correct a spelling error or typo.
Legal Name
The legal name is one recognized by law, thus it is the name liable for pursuit or for debts incurred by the business or organization. In the case of a corporation, it is the legal name as fixed by its charter or the statute by which the corporation was created.
Modifications to the legal name should only be done to correct a spelling error or typo.
To indicate a legal name of another legal entity you should instead indicate it in question 3 by selecting 'Not currently operational' and then choosing the applicable reason and providing the legal name of this other entity along with any other requested information.
Operating Name
The operating name is a name the business or organization is commonly known as if different from its legal name. The operating name is synonymous with trade name.
Legal name
Operating name (if applicable)
2. Verify or provide the contact information of the designated business or organization contact person for this questionnaire and correct where needed.
Note: The designated contact person is the person who should receive this questionnaire. The designated contact person may not always be the one who actually completes the questionnaire.
First name
Last name
Title
Preferred language of communication
English
French
Mailing address (number and street)
City
Province, territory or state
Postal code or ZIP code
Country
Canada
United States
Email address
Telephone number (including area code)
Extension number (if applicable)
The maximum number of characters is 10.
Fax number (including area code)
3. Verify or provide the current operational status of the business or organization identified by the legal and operating name above.
Operational
Not currently operational
Why is this business or organization not currently operational?
Seasonal operations
When did this business or organization close for the season?
Date
When does this business or organization expect to resume operations?
Date
Ceased operations
When did this business or organization cease operations?
Date
Why did this business or organization cease operations?
Bankruptcy
Liquidation
Dissolution
Other - Specify the other reasons why the operations ceased
Sold operations
When was this business or organization sold?
Date
What is the legal name of the buyer?
Amalgamated with other businesses or organizations
When did this business or organization amalgamate?
Date
What is the legal name of the resulting or continuing business or organization?
What are the legal names of the other amalgamated businesses or organizations?
Temporarily inactive but will re-open
When did this business or organization become temporarily inactive?
Date
When does this business or organization expect to resume operations?
Date
Why is this business or organization temporarily inactive?
No longer operating due to other reasons
When did this business or organization cease operations?
Date
Why did this business or organization cease operations?
4. This business unit has been identified as a Head Office. For the purposes of this survey, a Head Office provides support services such as accounting, payroll, management and legal to other entities within the same enterprise.
Which of the following statements most accurately describes this business unit?
This question verifies the business or organization's current main activity as classified by the North American Industry Classification System (NAICS). The North American Industry Classification System (NAICS) is an industry classification system developed by the statistical agencies of Canada, Mexico and the United States. Created against the background of the North American Free Trade Agreement, it is designed to provide common definitions of the industrial structure of the three countries and a common statistical framework to facilitate the analysis of the three economies. NAICS is based on supply-side or production-oriented principles, to ensure that industrial data, classified to NAICS, are suitable for the analysis of production-related issues such as industrial performance.
The target entity for which NAICS is designed are businesses and other organizations engaged in the production of goods and services. They include farms, incorporated and unincorporated businesses and government business enterprises. They also include government institutions and agencies engaged in the production of marketed and non-marketed services, as well as organizations such as professional associations and unions and charitable or non-profit organizations and the employees of households.
The associated NAICS should reflect those activities conducted by the business or organizational units targeted by this questionnaire only, as identified in the 'Answering this questionnaire' section and which can be identified by the specified legal and operating name. The main activity is the activity which most defines the targeted business or organization's main purpose or reason for existence. For a business or organization that is for-profit, it is normally the activity that generates the majority of the revenue for the entity.
The NAICS classification contains a limited number of activity classifications; the associated classification might be applicable for this business or organization even if it is not exactly how you would describe this business or organization's main activity.
Please note that any modifications to the main activity through your response to this question might not necessarily be reflected prior to the transmitting of subsequent questionnaires and as a result they may not contain this updated information.
The following is the detailed description including any applicable examples or exclusions for the classification currently associated with this business or organization.
This Canadian industry comprises establishments primarily engaged in providing general management and/or administrative support services to affiliated establishments. Head offices are engaged in directing or managing the enterprise as a whole.
This business unit is a Head Office
This business unit is not a Head Office
Please describe in detail the main activities performed by this business unit
Main activity
5. You indicated that is not the current main activity.
Was this business or organization's main activity ever classified as: ?
Yes
No
When did the main activity change?
Date
6. Search and select the industry classification code that best corresponds to this business or organization's main activity.
Select this business or organization's activity sector (optional)
Farming or logging operation
Construction company or general contractor
Manufacturer
Wholesaler
Retailer
Provider of passenger or freight transportation
Provider of investment, savings or insurance products
Real estate agency, real estate brokerage or leasing company
Provider of professional, scientific or technical services
Provider of health care or social services
Restaurant, bar, hotel, motel or other lodging establishment
Other sector
Reporting period information
1. What are the start and end dates of this business's or organization's most recently completed fiscal year?
For this survey, the end date should fall between April 1, 2023 and March 31, 2024.
Here are twelve common fiscal periods that fall within the targeted dates:
May 1, 2022 to April 30, 2023
June 1, 2022 to May 31, 2023
July 1, 2022 to June 30, 2023
August 1, 2022 to July 31, 2023
September 1, 2022 to August 31, 2023
October 1, 2022 to September 30, 2023
November 1, 2022 to October 31, 2023
December 1, 2022 to November 30, 2023
January 1, 2023 to December 31, 2023
February 1, 2023 to January 31, 2024
March 1, 2023 to February 28, 2024
April 1, 2023 to March 31, 2024.
Here are other examples of fiscal periods that fall within the required dates:
September 18, 2022 to September 15, 2023 (e.g., floating year-end)
June 1, 2023 to December 31, 2023 (e.g., a newly opened business).
Fiscal year start date
Fiscal year-end date
2. What is the reason the reporting period does not cover a full year?
Select all that apply.
Seasonal operations
New business
Change of ownership
Temporarily inactive
Change of fiscal year
Ceased operations
Other
Specify reason the reporting period does not cover a full year
Additional reporting instructions
1. Throughout this questionnaire, please report financial information in thousands of Canadian dollars.
For example, an amount of $763,880.25 should be reported as:
CAN$ '000: $764,000
I will report in the format above
Revenue
1. For the reporting period of YYYY-MM-DD to YYYY-MM-DD, what was this business's revenue from each of the following sources?
Notes:
a detailed breakdown may be requested in other sections
these questions are asked of many different industries. Some questions may not apply to this business
Report dollar amounts in thousands of Canadian dollars.
Sales of goods and services (e.g., fees, commissions, services revenue)
Report net of returns and allowances.
Sales of goods and services are defined as amounts derived from the sale of goods and services (cash or credit), falling within a business's ordinary activities. Sales should be reported net of trade discount, value added tax and other taxes based on sales.
Include:
sales from Canadian locations (domestic and export sales)
transfers to other business units or a head office of your firm.
Exclude:
transfers into inventory and consignment sales
federal, provincial and territorial sales taxes and excise duties and taxes
intercompany sales in consolidated financial statements.
Rental and leasing
Include rental or leasing of apartments, commercial buildings, land, office space, residential housing, investments in co-tenancies and co-ownerships, hotel or motel rooms, long and short term vehicle leasing, machinery or equipment, storage lockers, etc.
Commissions
Include commissions earned on the sale of products or services by businesses such as advertising agencies, brokers, insurance agents, lottery ticket sales, sales representatives and travel agencies - compensation could also be reported under this item (for example, compensation for collecting sales tax).
Subsidies (including grants, donations, fundraising and sponsorships)
Include:
non-repayable grants, contributions and subsidies from all levels of government
revenue from private sector (corporate and individual) sponsorships, donations and fundraising.
Royalties, rights, licensing and franchise fees
A royalty is defined as a payment received by the holder of a copyright, trademark or patent.
Include revenue received from the sale or use of all intellectual property rights of copyrighted materials such as musical, literary, artistic or dramatic works, sound recordings or the broadcasting of communication signals.
Dividends
Include:
dividend income
dividends from Canadian sources
dividends from foreign sources
patronage dividends.
Exclude equity income from investments in subsidiaries or affiliates.
Interest
Include:
investment revenue
interest from foreign sources
interest from Canadian bonds and debentures
interest from Canadian mortgage loans
interest from other Canadian sources.
Exclude equity income from investments in subsidiaries or affiliates.
All other revenue (Include intracompany transfers)
Include amounts not included in questions a. to g.
Total revenue
The sum of sub-questions a. to h.
CAN$ '000
Sales of goods and services
Rental and leasing
Commissions
Subsidies
Royalties, rights, licensing and franchise fees
Dividends
Interest
Other
Total revenue
Expenses
1. For the reporting period of YYYY-MM-DD to YYYY-MM-DD, what were this business's expenses for the following items?
Notes:
a detailed breakdown may be requested in other sections
these questions are asked of many different industries. Some questions may not apply to this business
Report dollar amounts in thousands of Canadian dollars.
Cost of goods sold
Many business units distinguish their costs of materials from their other business expenses (selling, general and administrative). This item is included to allow you to easily record your costs/expenses according to your normal accounting practices.
Include:
cost of raw materials and/or goods purchased for resale - net of discounts earned on purchases
freight in and duty.
Exclude all costs associated with salaries, wages, benefits, commissions and subcontracts (report at Employment costs and expenses, and Subcontracts).
Employment costs and expenses
b1. Salaries, wages and commissions
Please report all salaries and wages (including taxable allowances and employment commissions as defined on the T4 - Statement of Remuneration Paid) before deductions for this reporting period.
Include:
vacation pay
bonuses (including profit sharing)
employee commissions
taxable allowances (e.g., room and board, vehicle allowances, gifts such as airline tickets for holidays)
severance pay.
Exclude all payments and expenses associated with casual labour and outside contract workers (report at Subcontracts).
b2. Employee benefits
Include contributions to:
health plans
insurance plans
employment insurance
pension plans
workers' compensation
association dues
contributions to any other employee benefits such as child care and supplementary unemployment benefit (SUB) plans
contributions to provincial and territorial health and education payroll taxes.
Subcontracts
Subcontract expense refers to the purchasing of services from outside of the company rather than providing them in-house.
Include:
hired casual labour and outside contract workers
custom work and contract work
subcontract and outside labour
hired labour.
Research and development fees
Expenses from activities conducted with the intention of making a discovery that could either lead to the development of new products or procedures, or to the improvement of existing products or procedures.
Professional and business fees
Include:
legal services
accounting and auditing fees
consulting fees
education and training fees
appraisal fees
management and administration fees
property management fees
information technology (IT) consulting and service fees (purchased)
architectural fees
engineering fees
scientific and technical service fees
other consulting fees (management, technical and scientific)
veterinary fees
fees for human health services
payroll preparation fees
all other professional and business service fees.
Exclude service fees paid to Head Office (report at All other costs and expenses).
Utilities
Utility expenses related to operating your business unit such as water, electricity, gas, heating and hydro.
Include:
diesel, fuel wood, natural gas, oil and propane
sewage.
Exclude:
energy expenses covered in your rental and leasing contracts
telephone, Internet and other telecommunications
vehicle fuel (report at All other costs and expenses).
Office and computer related expenses
Include:
office stationery and supplies, paper and other supplies for photocopiers, printers and fax machines
postage and courier (used in the day to day office business activity)
computer and peripherals upgrade expenses
data processing.
Exclude telephone, Internet and other telecommunication expenses (report at Telephone, Internet and other telecommunication).
Telephone, Internet and other telecommunication
Include:
internet
telephone and telecommunications
cellular telephone
fax machine
pager.
Business taxes, licenses and permits
Include:
property taxes paid directly and property transfer taxes
vehicle license fees
beverage taxes and business taxes
trade license fees
membership fees and professional license fees
provincial capital tax.
Royalties, franchise fees and memberships
Include:
amounts paid to holders of patents, copyrights, performing rights and trademarks
gross overriding royalty expenses and direct royalty costs
resident and non-resident royalty expenses
franchise fees.
Exclude Crown royalties
Crown charges
Federal or Provincial royalty, tax, lease or rental payments made in relation to the acquisition, development or ownership of Canadian resource properties.
Include:
Crown royalties
Crown leases and rentals
oil sand leases
stumpage fees.
Rental and leasing
Include:
lease rental expenses, real estate rental expenses, condominium fees and equipment rental expenses
motor vehicle rental and leasing expenses
studio lighting and scaffolding
machinery and equipment rental expenses
storage expenses
road and construction equipment rental
fuel and other utility costs covered in your rental and leasing contracts.
Repair and maintenance
Include:
buildings and structures
machinery and equipment
security equipment
vehicles
costs related to materials, parts and external labour associated with these expenses
janitorial and cleaning services and garbage removal.
Amortization and depreciation
Include:
direct cost depreciation of tangible assets and amortization of leasehold improvements
amortization of intangible assets (e.g., amortization of goodwill, patents, franchises, copyrights, trademarks, deferred charges, organizational costs).
Insurance
Insurance recovery income should be deducted from insurance expenses.
Include:
professional and other liability insurance
motor vehicle and property insurance
executive life insurance
bonding, business interruption insurance and fire insurance.
Advertising, marketing, promotion, meals and entertainment
Include:
newspaper advertising and media expenses
catalogues, presentations and displays
tickets for theatre, concerts and sporting events for business promotion
fundraising expenses
meals, entertainment and hospitality purchases for clients.
exploration and development (including prospect/geological, well abandonment and dry holes, exploration expenses, development expenses)
amounts not included in sub-questions a. to t. above.
Total expenses
The sum of sub-questions a. to u.
CAN$ '000
Cost of goods sold
Opening inventories
Purchases
Closing inventories
Cost of goods sold
Employment costs and expenses
Salaries, wages and commissions
Employee benefits
Subcontracts
Research and development fees
Professional and business fees
Utilities
Office and computer related expenses
Telephone, Internet and other telecommunication
Business taxes, licenses and permits
Royalties, franchise fees and memberships
Crown charges
Rental and leasing
Repair and maintenance
Amortization and depreciation
Insurance
Advertising, marketing, promotion, meals and entertainment
Travel, meetings and conventions
Financial services
Interest expense
Other non-production-related costs and expenses
All other costs and expenses
Total expenses
Industry characteristics
1. What percentage of the revenue, at this head office only, is generated from:
Revenue is divided into two main categories: revenue from transactions with external clients and revenue from transactions with internal clients. Please report accordingly.
Percentage
External clients
Internal clients
2. For the reporting period of YYYY-MM-DD to YYYY-MM-DD, what is the average number of people employed at this head office only?
Include full-time, part-time and temporary employees and employees absent with pay.
Exclude contract and subcontract workers who are not part of your payroll.
Employment at this head office
To calculate the average number of people employed, add the number of people employed in the last pay period of each month and divide this sum by the number of months in the reporting period (usually 12).
Exclude:
contract and subcontract workers who are not part of your payroll
company pensioners
persons working on a full commission basis for whom you are not making Canada Pension Fund (CPP) or Quebec Pension Fund (le Régime des rentes du Québec) or employment insurance (EI) contributions
outside directors of incorporated companies.
Number
Notification of intent to extract web data
1. Does this business have a website?
Yes
Specify the business website address 1
Specify the business website address 2
Specify the business website address 3
No
Notification of intent to extract web data
Statistics Canada engages in web-data extraction, also known as web scraping, which is a process by which information is gathered and copied from the Web using automated scripts or robots, for retrieval and analysis. As a result, we may visit the website for this business to search for and compile additional information. The use of web scraping is part of a broader effort to reduce the response burden on businesses, as well as produce additional statistical indicators to ensure that our data remain accurate and relevant.
We will strive to ensure that the data collection does not interfere with the functionality of the website. Any data collected will be used by Statistics Canada for statistical and research purposes only, in accordance with the agency’s privacy and confidentiality mandate.
If you have any questions or concerns, please contact Statistics Canada Client Services, toll-free at 1-877-949-9492 [Teletypewriter or Telecommunication device for the deaf/teletype machine (TTY): 1-800-363-7629] or by email at infostats@statcan.gc.ca - this link will open in a new window. Additional information about this survey can be found by selecting the following link: 2023 Annual Head Office Survey.
Changes or events
1. Indicate any changes or events that affected the reported values for this business or organization, compared with the last reporting period.
Select all that apply.
Strike or lock-out
Exchange rate impact
Price changes in goods or services sold
Contracting out
Organizational change
Price changes in labour or raw materials
Natural disaster
Recession
Change in product line
Sold business or business units
Expansion
New or lost contract
Plant closures
Acquisition of business or business units
Other
Specify the other changes or events:
No changes or events
Contact person
2. Statistics Canada may need to contact the person who completed this questionnaire for further information.
Is the provided given names and the provided family name the best person to contact?
Yes
No
Who is the best person to contact about this questionnaire?
First name:
Last name:
Title:
Email address:
Telephone number (including area code):
Extension number (if applicable):
The maximum number of characters is 5.
Fax number (including area code):
Feedback
3. How long did it take to complete this questionnaire?
Include the time spent gathering the necessary information.
Hours:
Minutes:
4. Do you have any comments about this questionnaire?
This survey is conducted by Statistics Canada in order to collect the necessary information to support the Integrated Business Statistics Program (IBSP). This program combines various survey and administrative data to develop comprehensive measures of the Canadian economy.
The statistical information from the IBSP serves many purposes, including:
calculating each province and territory's fair share of federal-provincial transfer payments for health, education and social programs
establishing government programs to assist businesses
assisting the business community in negotiating contracts and collective agreements
supporting the government in making informed decisions about fiscal, monetary and foreign exchange policies
indexing social benefit programs and determining tax brackets
enabling academics and economists to analyze the economic performance of Canadian industries and to better understand rapidly evolving business environments.
Your information may also be used by Statistics Canada for other statistical and research purposes.
Your participation in this survey is required under the authority of the Statistics Act.
Other important information
Authorization to collect this information
Data are collected under the authority of the Statistics Act, Revised Statutes of Canada, 1985, Chapter S-19.
Confidentiality
By law, Statistics Canada is prohibited from releasing any information it collects that could identify any person, business, or organization, unless consent has been given by the respondent, or as permitted by the Statistics Act. Statistics Canada will use the information from this survey for statistical purposes only.
Record linkages
To enhance the data from this survey and to reduce the reporting burden, Statistics Canada may combine the acquired data with information from other surveys or from administrative sources.
Data-sharing agreements
To reduce respondent burden, Statistics Canada has entered into data-sharing agreements with provincial and territorial statistical agencies and other government organizations, which have agreed to keep the data confidential and use them only for statistical purposes. Statistics Canada will only share data from this survey with those organizations that have demonstrated a requirement to use the data.
Section 11 of the Statistics Act provides for the sharing of information with provincial and territorial statistical agencies that meet certain conditions. These agencies must have the legislative authority to collect the same information, on a mandatory basis, and the legislation must provide substantially the same provisions for confidentiality and penalties for disclosure of confidential information as the Statistics Act. Because these agencies have the legal authority to compel businesses to provide the same information, consent is not requested and businesses may not object to the sharing of the data.
For this survey, there are Section 11 agreements with the provincial and territorial statistical agencies of Newfoundland and Labrador, Nova Scotia, New Brunswick, Québec, Ontario, Manitoba, Saskatchewan, Alberta, British Columbia and the Yukon. The shared data will be limited to information pertaining to business establishments located within the jurisdiction of the respective province or territory.
Section 12 of the Statistics Act provides for the sharing of information with federal, provincial or territorial government organizations. Under Section 12, you may refuse to share your information with any of these organizations by writing a letter of objection to the Chief Statistician, specifying the organizations with which you do not want Statistics Canada to share your data and mailing it to the following address:
Chief Statistician of Canada
Statistics Canada
Attention of Director, Enterprise Statistics Division
150 Tunney's Pasture Driveway
Ottawa, Ontario
K1A 0T6
For this survey, there are Section 12 agreements with the statistical agencies of Prince Edward Island, the Northwest Territories and Nunavut.
For agreements with provincial and territorial government organizations, the shared data will be limited to information pertaining to business establishments located within the jurisdiction of the respective province or territory.
Business or organization and contact information
1. Verify or provide the business or organization's legal and operating name and correct where needed.
Note: Legal name modifications should only be done to correct a spelling error or typo.
Legal Name
The legal name is one recognized by law, thus it is the name liable for pursuit or for debts incurred by the business or organization. In the case of a corporation, it is the legal name as fixed by its charter or the statute by which the corporation was created.
Modifications to the legal name should only be done to correct a spelling error or typo.
To indicate a legal name of another legal entity you should instead indicate it in question 3 by selecting 'Not currently operational' and then choosing the applicable reason and providing the legal name of this other entity along with any other requested information.
Operating Name
The operating name is a name the business or organization is commonly known as if different from its legal name. The operating name is synonymous with trade name.
Legal name:
Operating name (if applicable):
2. Verify or provide the contact information of the designated business or organization contact person for this questionnaire and correct where needed.
Note: The designated contact person is the person who should receive this questionnaire. The designated contact person may not always be the one who actually completes the questionnaire.
First name:
Last name:
Title:
Preferred language of communication:
English
French
Mailing address (number and street):
City:
Province, territory or state:
Postal code or ZIP code:
Country:
Canada
United States
Email address:
Telephone number (including area code):
Extension number (if applicable):
The maximum number of characters is 10.
Fax number (including area code):
3. Verify or provide the current operational status of the business or organization identified by the legal and operating name above.
Operational
Not currently operational
Why is this business or organization not currently operational?
Seasonal operations
When did this business or organization close for the season?
Date
When does this business or organization expect to resume operations?
Date
Ceased operations
When did this business or organization cease operations?
Date
Why did this business or organization cease operations?
Bankruptcy
Liquidation
Dissolution
Other - Specify the other reasons for ceased operations
Sold operations
When was this business or organization sold?
Date
What is the legal name of the buyer?
Amalgamated with other businesses or organizations
When did this business or organization amalgamate?
Date
What is the legal name of the resulting or continuing business or organization?
What are the legal names of the other amalgamated businesses or organizations?
Temporarily inactive but will re-open
When did this business or organization become temporarily inactive?
Date
When does this business or organization expect to resume operations?
Date
Why is this business or organization temporarily inactive?
No longer operating due to other reasons
When did this business or organization cease operations?
Date
Why did this business or organization cease operations?
4. Verify or provide the current main activity of the business or organization identified by the legal and operating name above.
Note: The described activity was assigned using the North American Industry Classification System (NAICS).
This question verifies the business or organization's current main activity as classified by the North American Industry Classification System (NAICS). The North American Industry Classification System (NAICS) is an industry classification system developed by the statistical agencies of Canada, Mexico and the United States. Created against the background of the North American Free Trade Agreement, it is designed to provide common definitions of the industrial structure of the three countries and a common statistical framework to facilitate the analysis of the three economies. NAICS is based on supply-side or production-oriented principles, to ensure that industrial data, classified to NAICS, are suitable for the analysis of production-related issues such as industrial performance.
The target entity for which NAICS is designed are businesses and other organizations engaged in the production of goods and services. They include farms, incorporated and unincorporated businesses and government business enterprises. They also include government institutions and agencies engaged in the production of marketed and non-marketed services, as well as organizations such as professional associations and unions and charitable or non-profit organizations and the employees of households.
The associated NAICS should reflect those activities conducted by the business or organizational units targeted by this questionnaire only, as identified in the 'Answering this questionnaire' section and which can be identified by the specified legal and operating name. The main activity is the activity which most defines the targeted business or organization's main purpose or reason for existence. For a business or organization that is for-profit, it is normally the activity that generates the majority of the revenue for the entity.
The NAICS classification contains a limited number of activity classifications; the associated classification might be applicable for this business or organization even if it is not exactly how you would describe this business or organization's main activity.
Please note that any modifications to the main activity through your response to this question might not necessarily be reflected prior to the transmitting of subsequent questionnaires and as a result they may not contain this updated information.
The following is the detailed description including any applicable examples or exclusions for the classification currently associated with this business or organization.
Description and examples
This is the current main activity
This is not the current main activity
Provide a brief but precise description of this business or organization's main activity:
e.g., breakfast cereal manufacturing, shoe store, software development
Main activity
5. You indicated that is not the current main activity.
Was this business or organization's main activity ever classified as: ?
Yes
When did the main activity change?
Date:
No
6. Search and select the industry classification code that best corresponds to this business or organization's main activity.
Select this business or organization's activity sector (optional)
Farming or logging operation
Construction company or general contractor
Manufacturer
Wholesaler
Retailer
Provider of passenger or freight transportation
Provider of investment, savings or insurance products
Real estate agency, real estate brokerage or leasing company
Provider of professional, scientific or technical services
Provider of health care or social services
Restaurant, bar, hotel, motel or other lodging establishment
Other sector
7. You have indicated that the current main activity of this business or organization is:
Main activity
Are there any other activities that contribute significantly (at least 10%) to this business or organization's revenue?
Yes, there are other activities
Provide a brief but precise description of this business or organization's secondary activity:
e.g., breakfast cereal manufacturing, shoe store, software development
No, that is the only significant activity
8. Approximately what percentage of this business or organization's revenue is generated by each of the following activities?
When precise figures are not available, provide your best estimates.
Approximately what percentage of this business or organization's revenue is generated by each of the following activities?
Percentage of revenue
Main activity
Secondary activity
All other activities
Total percentage
Reporting period information
1. What are the start and end dates of this business's or organization's most recently completed fiscal year?
For this survey, the end date should fall between April 1, 2023 and March 31, 2024.
Here are twelve common fiscal periods that fall within the targeted dates:
May 1, 2022 to April 30, 2023
June 1, 2022 to May 31, 2023
July 1, 2022 to June 30, 2023
August 1, 2022 to July 31, 2023
September 1, 2022 to August 31, 2023
October 1, 2022 to September 30, 2023
November 1, 2022 to October 31, 2023
December 1, 2022 to November 30, 2023
January 1, 2023 to December 31, 2023
February 1, 2023 to January 31, 2024
March 1, 2023 to February 28, 2024
April 1, 2023 to March 31, 2024.
Here are other examples of fiscal periods that fall within the required dates:
September 18, 2022 to September 15, 2023 (e.g., floating year-end)
June 1, 2023 to December 31, 2023 (e.g., a newly opened business).
Fiscal year start date:
Fiscal year-end date:
2. What is the reason the reporting period does not cover a full year?
Select all that apply.
Seasonal operations
New business
Change of ownership
Temporarily inactive
Change of fiscal year
Ceased operations
Other
Specify reason the reporting period does not cover a full year:
Additional reporting instructions
1. Throughout this questionnaire, please report financial information in thousands of Canadian dollars.
For example, an amount of $763,880.25 should be reported as:
CAN$ '000: $764,000
I will report in the format above
Revenue
1. For the reporting period of YYYY-MM-DD to YYYY-MM-DD, what was this business's revenue from each of the following sources?
Notes:
a detailed breakdown may be requested in other sections
these questions are asked of many different industries. Some questions may not apply to this business.
Report dollar amounts in thousands of Canadian dollars.
Revenue
a. Sales of goods and services (e.g., fees, commissions, services revenue)
Report net of returns and allowances.
Sales of goods and services are defined as amounts derived from the sale of goods and services (cash or credit), falling within a business's ordinary activities. Sales should be reported net of trade discount, value added tax and other taxes based on sales.
Include:
sales from Canadian locations (domestic and export sales)
transfers to other business units or a head office of your firm.
Exclude:
transfers into inventory and consignment sales
federal, provincial and territorial sales taxes and excise duties and taxes
intercompany sales in consolidated financial statements.
b. Rental and leasing
Include rental or leasing of apartments, commercial buildings, land, office space, residential housing, investments in co-tenancies and co-ownerships, hotel or motel rooms, long and short term vehicle leasing, machinery or equipment, storage lockers, etc.
c. Commissions
Include commissions earned on the sale of products or services by businesses such as advertising agencies, brokers, insurance agents, lottery ticket sales, sales representatives and travel agencies - compensation could also be reported under this item (for example, compensation for collecting sales tax).
d. Subsidies (including grants, donations, fundraising and sponsorships)
Include:
non-repayable grants, contributions and subsidies from all levels of government
revenue from private sector (corporate and individual) sponsorships, donations and fundraising.
e. Royalties, rights, licensing and franchise fees
A royalty is defined as a payment received by the holder of a copyright, trademark or patent.
Include revenue received from the sale or use of all intellectual property rights of copyrighted materials such as musical, literary, artistic or dramatic works, sound recordings or the broadcasting of communication signals.
f. Dividends
Include:
dividend income
dividends from Canadian sources
dividends from foreign sources
patronage dividends.
Exclude equity income from investments in subsidiaries or affiliates.
g. Interest
Include:
investment revenue
interest from foreign sources
interest from Canadian bonds and debentures
interest from Canadian mortgage loans
interest from other Canadian sources.
Exclude equity income from investments in subsidiaries or affiliates.
h. All other revenue (Include intracompany transfers)
Include amounts not included in questions a. to g.
Total revenue
The sum of sub-questions a. to h.
For the reporting period of YYYY-MM-DD to YYYY-MM-DD, what was this business's revenue from each of the following sources?
CAN$ '000
a. Sales of goods and services
Include sales, commissions, rental and leasing revenue if they are this business's primary revenue source.
b. Rental and leasing
Report only if this is a secondary revenue source. If rental and leasing are your primary revenue source, report at question a.
c. Commissions
Report only if this is a secondary revenue source. If commissions are your primary revenue source, report at question a.
d. Subsidies
Include grants, donations, fundraising and sponsorships.
e. Royalties, rights, licensing and franchise fees
f. Dividends
g. Interest
h. Other
Include intracompany transfers.
Specify all other revenue:
Total revenue
E-commerce
1. For the reporting period of YYYY-MM-DD to YYYY-MM-DD, what was this business's total revenue?
Include:
sales of goods and services
rental, leasing and property management
commissions
subsidies, grants, donations, fundraising and sponsorships
royalties
rights
licensing and franchise fees
dividends, interest and other revenue.
Report dollar amounts in thousands of Canadian dollars.
Total revenue in CAN$ '000:
2. For the reporting period of YYYY-MM-DD to YYYY-MM-DD, did this business have any e-commerce revenue?
E-commerce revenue: Sales of goods and services conducted over the Internet with or without online payment.
Include all revenue for which an order is received and commitment to purchase is made via the Internet, although payment can be made by other means, such as orders made on web pages, an extranet, mobile devices or Electronic Data Interchange (EDI).
Exclude orders made by telephone, facsimile or e-mail.
Yes
No
3. Of the [amount] amount reported in total revenue, what was the total e-commerce revenue?
When precise figures are not available, provide your best estimates.
Total e-commerce revenue in CAN$ '000:
Expenses
1. For the reporting period of YYYY-MM-DD to YYYY-MM-DD, what were this business's expenses for the following items?
Notes:
a detailed breakdown may be requested in other sections
these questions are asked of many different industries. Some questions may not apply to this business.
Report dollar amounts in thousands of Canadian dollars.
Expenses
a. Cost of goods sold
Many business units distinguish their costs of materials from their other business expenses (selling, general and administrative). This item is included to allow you to easily record your costs/expenses according to your normal accounting practices.
Include:
cost of raw materials and/or goods purchased for resale - net of discounts earned on purchases
freight in and duty.
Exclude all costs associated with salaries, wages, benefits, commissions and subcontracts (report at Employment costs and expenses, and Subcontracts).
b. Employment costs and expenses
b1. Salaries, wages and commissions
Please report all salaries and wages (including taxable allowances and employment commissions as defined on the T4 - Statement of Remuneration Paid) before deductions for this reporting period.
Include:
vacation pay
bonuses (including profit sharing)
employee commissions
taxable allowances (e.g., room and board, vehicle allowances, gifts such as airline tickets for holidays)
severance pay.
Exclude all payments and expenses associated with casual labour and outside contract workers (report at Subcontracts).
b2. Employee benefits
Include contributions to:
health plans
insurance plans
employment insurance
pension plans
workers' compensation
association dues
contributions to any other employee benefits such as child care and supplementary unemployment benefit (SUB) plans
contributions to provincial and territorial health and education payroll taxes.
c. Subcontracts
Subcontract expense refers to the purchasing of services from outside of the company rather than providing them in-house.
Include:
hired casual labour and outside contract workers
custom work and contract work
subcontract and outside labour
hired labour.
d. Research and development fees
Expenses from activities conducted with the intention of making a discovery that could either lead to the development of new products or procedures, or to the improvement of existing products or procedures.
e. Professional and business fees
Include:
legal services
accounting and auditing fees
consulting fees
education and training fees
appraisal fees
management and administration fees
property management fees
information technology (IT) consulting and service fees (purchased)
architectural fees
engineering fees
scientific and technical service fees
other consulting fees (management, technical and scientific)
veterinary fees
fees for human health services
payroll preparation fees
all other professional and business service fees.
Exclude service fees paid to Head Office (report at All other costs and expenses).
f. Utilities
Utility expenses related to operating your business unit such as water, electricity, gas, heating and hydro.
Include:
diesel, fuel wood, natural gas, oil and propane
sewage.
Exclude:
energy expenses covered in your rental and leasing contracts
telephone, Internet and other telecommunications
vehicle fuel (report at All other costs and expenses).
g. Office and computer related expenses
Include:
office stationery and supplies, paper and other supplies for photocopiers, printers and fax machines
postage and courier (used in the day to day office business activity)
computer and peripherals upgrade expenses
data processing.
Exclude telephone, Internet and other telecommunication expenses (report at Telephone, Internet and other telecommunication).
h. Telephone, Internet and other telecommunication
Include:
internet
telephone and telecommunications
cellular telephone
fax machine
pager.
i. Business taxes, licenses and permits
Include:
property taxes paid directly and property transfer taxes
vehicle license fees
beverage taxes and business taxes
trade license fees
membership fees and professional license fees
provincial capital tax.
j. Royalties, franchise fees and memberships
Include:
amounts paid to holders of patents, copyrights, performing rights and trademarks
gross overriding royalty expenses and direct royalty costs
resident and non-resident royalty expenses
franchise fees.
Exclude Crown royalties
k. Crown charges
Federal or Provincial royalty, tax, lease or rental payments made in relation to the acquisition, development or ownership of Canadian resource properties.
Include:
Crown royalties
Crown leases and rentals
oil sand leases
stumpage fees.
l. Rental and leasing
Include:
lease rental expenses, real estate rental expenses, condominium fees and equipment rental expenses
motor vehicle rental and leasing expenses
studio lighting and scaffolding
machinery and equipment rental expenses
storage expenses
road and construction equipment rental
fuel and other utility costs covered in your rental and leasing contracts.
m. Repair and maintenance
Include:
buildings and structures
machinery and equipment
security equipment
vehicles
costs related to materials, parts and external labour associated with these expenses
janitorial and cleaning services and garbage removal.
n. Amortization and depreciation
Include:
direct cost depreciation of tangible assets and amortization of leasehold improvements
amortization of intangible assets (e.g., amortization of goodwill, patents, franchises, copyrights, trademarks, deferred charges, organizational costs).
o. Insurance
Insurance recovery income should be deducted from insurance expenses.
Include:
professional and other liability insurance
motor vehicle and property insurance
executive life insurance
bonding, business interruption insurance and fire insurance.
p. Advertising, marketing, promotion, meals and entertainment
Include:
newspaper advertising and media expenses
catalogues, presentations and displays
tickets for theatre, concerts and sporting events for business promotion
fundraising expenses
meals, entertainment and hospitality purchases for clients.
exploration and development (including prospect/geological, well abandonment and dry holes, exploration expenses, development expenses)
amounts not included in sub-questions a. to t. above.
Total expenses
The sum of sub-questions a. to u.
For the reporting period of YYYY-MM-DD to YYYY-MM-DD, what were this business's expenses for the following items?
CAN$ '000
a. Cost of goods sold
a1. Opening inventories
a2. Purchases
Include raw materials, goods purchased for resale and non-returnable containers.
Exclude change in inventories.
a3. Closing inventories
a4. Cost of goods sold
Opening inventories plus purchases minus closing inventories.
b. Employment costs and expenses
Include all employees who were issued a T4.
Exclude commissions to be paid to non-employees, report at sub-question c.
b1. Salaries, wages and commissions
b2. Employee benefits
c. Subcontracts
Include commissions to non-employees.
Exclude research and development.
d. Research and development fees.
Exclude in-house research and development.
e. Professional and business fees
e.g., legal, accounting, consulting, scientific and property management fees
f. Utilities
e.g., electricity, water, gas
g. Office and computer related expenses
e.g., office supplies, postage, computer upgrades
h. Telephone, Internet and other telecommunication
i. Business taxes, licenses and permits
e.g., beverage tax, business tax, license fees, property taxes
j. Royalties, franchise fees and memberships
Exclude Crown royalties.
k. Crown charges
(for logging, mining and energy industries only)
l. Rental and leasing
Include land buildings, equipment, vehicles.
m. Repair and maintenance
Include buildings, equipment, vehicles.
n. Amortization and depreciation
o. Insurance
p. Advertising, marketing, promotion, meals and entertainment
q. Travel, meetings and conventions
r. Financial services
e.g., bank charges, transaction fees
s. Interest expense
t. Other non-production-related costs and expenses
Include bad debts, loan losses, donations, political contributions and inventory write-down.
u. All other costs and expenses
Include intracompany expenses.
Specify all other costs and expenses:
Total expenses
Industry Characteristics
1. What were this business's sales for each of the following goods and services?
Please report all amounts in thousands of Canadian dollars.
Sales
Please provide a breakdown of your sales.
a. Room or unit accommodation for travellers
Please report all revenues derived from room rentals.
b. Meals and non-alcoholic beverages, prepared and served or dispensed, for immediate consumption
Include all food sale revenue for restaurants owned by your establishment.
c. Alcoholic beverages, prepared and served or dispensed for immediate consumption
Include all sales from restaurants, bars, owned by the establishment, including in-room bar.
d. Sale of merchandise (e.g., packaged food and beverages, newspapers, magazines, books, tobacco, cigarettes and souvenirs)
Include items sold from vending machines or merchandise from a store owned by the establishment.
e. Telephone and Internet access services
Include all revenues from telephone calls, Internet services
f. Rental of space and equipment
Include revenues derived from renting out conference rooms, banquet rooms, and any concession machines.
g. Amusement and recreational services
Include golf courses, skiing and admissions to live performing arts events.
h. Other services
Include any other revenues derived from services such as parking and laundry services.
i. Other revenue not elsewhere reported - specify:
Include any revenues which do not correspond to any of the above revenue items.
What were this business's sales for each of the following goods and services?
CAN$ '000
a. Room or unit accommodation for travellers
b. Meals and non-alcoholic beverages, prepared and served or dispensed for immediate consumption
c. Alcoholic beverages, prepared and served or dispensed for immediate consumption
d. Sale of merchandise
e.g., packaged food and beverages, newspapers, magazines, books, tobacco, cigarettes and souvenirs
e. Telephone and Internet access services
f. Rental of space and equipment
e.g., meeting room rentals, banquet rentals and concessions
g. Amusement and recreational services
e.g., golf course, skiing and admissions to live performing arts events
h. Other services
e.g., parking, laundry
i. Other
Specify all other revenue not elsewhere reported:
Total sales of goods and services
2. Of the [amount] room accommodation revenue reported in Question 1a., how much was generated by each of the following methods of booking?
For groups, please include them in the original method of the booking.
Please report all amounts in thousands of Canadian dollars.
Of the [amount] room accommodation revenue reported in Question 1a., how much was generated by each of the following methods of booking?
CAN$ '000
a. Own website or mobile app
b. Third party website or mobile app
c. Phone call
d. Global Distribution System (GDS)
e. Other method of booking
e.g. walk-ins, referrals
Specify other method of booking:
Total room and unit accommodation
3. Of the (amount) room accommodation revenue reported in Question 1a., how much was generated by each of the following types of accommodations?
For groups, please include them in the original method of the booking.
Please report all amounts in thousands of Canadian dollars.
Of the (amount) room accommodation revenue reported in Question 1a., how much was generated by each of the following types of accommodations?
CAN$ '000
a. Hotels, motels and motor hotels
b. Resorts
c. Casino hotels
d. Short-term rentals (renting a private furnished residence, or part of residence, for 28 days or less)
e. All other types of traveller accommodations
Total room and unit accommodation
4. For the reporting period of YYYY-MM-DD to YYYY-MM-DD, what were this business's costs for the following goods?
Cost of goods sold
Provide a breakdown in thousands of Canadian dollars.
a. Cost of food products used in meal preparation
Correspond to the costs related to the sales derived from meals and non-alcoholic beverages (purchases).
b. Cost of alcoholic beverages used or sold
Correspond to the costs related to the sales derived from alcoholic beverages (purchases).
c. Cost of all other merchandise sold
Correspond to the costs related to the sales of all other merchandise (purchases).
Total cost of goods sold
The sum of sub-questions a. to c.
For the reporting period of YYYY-MM-DD to YYYY-MM-DD, what were this business's costs for the following goods?
CAN$ '000
a. Cost of food products used in meal preparation
(related to question 1b.)
b. Cost of alcoholic beverages used or sold
(related to question 1c.)
c. Cost of all other merchandise sold
(related to question 1d.)
Total cost of goods sold
5. For the reporting period of YYYY-MM-DD to YYYY-MM-DD, what were the following values relating to the occupancy of this establishment?
Occupancy rate
a. Total number of rooms in this establishment
Refers to the total number of physical rooms in the property.
b. Total number of room-nights available over your 2023 reporting period
Exclude rooms closed due to repair or renovations.
For the reporting period of YYYY-MM-DD to YYYY-MM-DD, what were the following values relating to the occupancy of this establishment?
Number
a. Total number of rooms in this establishment
b. Total number of room-nights available
Exclude rooms closed due to repair or renovations
c. Total number of room-nights sold
6. For the reporting period of YYYY-MM-DD to YYYY-MM-DD, what was the occupancy rate of this establishment?
Sales by type of client
1. What was this business's breakdown of sales by the following types of client?
Sales by type of client
This section is designed to measure which sector of the economy purchases your services.
Please provide a percentage breakdown of your sales by type of client.
Please ensure that the sum of percentages reported in this section equals 100%.
a. to c. Clients in Canada
a. Individuals and households
Please report the percentage of sales to individuals and households who do not represent the business or government sector.
b. Businesses
Percentage of sales sold to the business sector should be reported here.
Include sales to Crown corporations.
c. Governments, not-for-profit organizations and public institutions (e.g., hospitals, schools)
Percentage of sales to federal, provincial, territorial and municipal governments should be reported here.
Include: sales to hospitals, schools, universities and public utilities.
d. Clients outside Canada
Please report the percentage of total sales to customers or clients located outside Canada including foreign businesses, foreign individuals, foreign institutions and/or governments.
Include sales to foreign subsidiaries and affiliates.
What was this business's breakdown of sales by the following types of client?
Percentage
a. Clients in Canada - individuals and households
b. Clients in Canada - businesses
c. Clients in Canada - governments, not-for-profit organizations and public institutions
e.g., hospitals and schools
d. Clients outside Canada
Total percentage
Notification of intent to extract web data
1. Does this business have a website?
Yes
Specify the business website address 1
Specify the business website address 2
Specify the business website address 3
No
Notification of intent to extract web data
Statistics Canada engages in web-data extraction, also known as web scraping, which is a process by which information is gathered and copied from the Web using automated scripts or robots, for retrieval and analysis. As a result, we may visit the website for this business or organization to search for and compile additional information. The use of web scraping is part of a broader effort to reduce the response burden on businesses or organizations, as well as produce additional statistical indicators to ensure that our data remain accurate and relevant.
We will strive to ensure that the data collection does not interfere with the functionality of the website. Any data collected will be used by Statistics Canada for statistical and research purposes only, in accordance with the agency's privacy and confidentiality mandate. All information collected by Statistics Canada is strictly protected.
If you have any questions or concerns, please contact Statistics Canada Client Services, toll-free at 1-877-949-9492 (TTY: 1-800-363-7629) or by email at infostats@statcan.gc.ca- this link will open in a new window. Additional information about this survey can be found by selecting the following link: Information for survey participants (ISP).
Changes or events
1. Indicate any changes or events that affected the reported values for this business or organization, compared with the last reporting period.
Select all that apply.
Strike or lock-out
Exchange rate impact
Price changes in goods or services sold
Contracting out
Organizational change
Price changes in labour or raw materials
Natural disaster
Recession
Change in product line
Sold business or business units
Expansion
New or lost contract
Plant closures
Acquisition of business or business units
Other
Specify the other changes or events:
No changes or events
Contact person
2. Statistics Canada may need to contact the person who completed this questionnaire for further information.
Is Provided Given Names, Provided Family Name the best person to contact?
Yes
No
Who is the best person to contact about this questionnaire?
First name:
Last name:
Title:
Email address:
Telephone number (including area code):
Extension number (if applicable):
The maximum number of characters is 5.
Fax number (including area code):
Feedback
3. How long did it take to complete this questionnaire?
Include the time spent gathering the necessary information.
Hours:
Minutes:
4. Do you have any comments about this questionnaire?
Centre for Energy and Transportation Statistics
Energy Section
This guide is designed to assist you as you complete the
2023 Annual Survey of Electric Power Thermal Generating Station Fuel Consumption.
Help Line: 1-877-604-7828
Confidentiality
Statistics Canada is prohibited by law from releasing any information it collects which could identify any person, business, or organization, unless consent has been given by the respondent or as permitted by the Statistics Act. Statistics Canada will use the information from this survey for statistical and research purposes.
This schedule is to be completed for the station or stations indicated on the affixed label to the questionnaire. Please report for the requested period: January to December 2023.
Report only the amount of fuel used for the generation of electricity.
Reported value ($) should be the total cost at the station gate.
If there are any stations on standby, please report them in the notes section.
If the information requested is unknown, please provide your best estimate.
This guide is designed to assist you as you complete the 2023 Annual Survey of Electric Power Thermal Generating Station Fuel Consumption. If you need more information, please call 1-877-604-7828.
B – Cogeneration
Cogeneration: A highly efficient means of generating heat and electric power at the same time from the same energy source. Cogeneration makes use of the excess heat, usually in the form of relatively low-temperature steam exhausted from the power generation turbines towards another purpose.
Type: Primary purpose
Electricity own-use (internal): electricity which is used only for internal purposes.
Electricity for sale (external): electricity which is sold / supplied to another company.
Sub-Types
Combined cycle: burns fuel in a gas turbine or engine to generate electricity. The exhaust from the turbine or engine can provide usable heat or go to a heat recovery system to generate steam which then may drive a secondary steam turbine.
Steam turbine: burns fuel to produce steam, which generates power through a steam turbine. Exhaust (left over steam) can be used as low-pressure steam to heat water.
Combustion engine: rely solely on heat and pressure created by the engine in its compression process for ignition. For a diesel engine, the compression that occurs is usually twice or more higher than a gasoline engine. Diesel engines will take in air only, and shortly before peak compression, a small quantity of diesel fuel is sprayed into the cylinder via a fuel injector that allows the fuel to instantly ignite.
Natural gas combustion turbine: involves a natural gas fired turbine, which runs a generator to produce electricity. The exhaust gas flows through a heat recovery boiler, which can convert the exhaust energy into steam or usable heat.
C – Solid fuel types used to generate electricity
Any energy form consumed not otherwise identified on the questionnaire. Specify in the spaces provided.
Bituminous coal: A dense, black coal, often with well-defined bands of bright and dull material with a moisture content usually less than 20%. Used primarily for generating electricity, making coke and space heating.
Sub-bituminous coal: A black coal used primarily for thermal generation, with moisture content between 15% and 30%. (Canadian/Foreign) - It is important to distinguish between Canadian versus imported sub-bituminous as each carries a different content, depending on the location of the coal mine.
Lignite: A brownish-black coal of low rank containing 30% to 40% moisture and volatile matter. Used almost exclusively for electric power generation.
Wood (Report for "Dry" method): Wood and wood energy used as fuel, including round wood (cord wood), lignin, wood scraps from furniture and window frame manufacturing, wood chips, bark, sawdust, forest residues, charcoal and pulp waste.
Petroleum coke: (often abbreviated petcoke) is a carbonaceous solid derived from oil refinery coker units or other cracking processes. Other coke has traditionally been derived from coal.
Agriculture biomass: includes animal manure, cellulosic crop residue, fruit and vegetable culls and food-processing effluent. Potential energy crops include high-yielding, high-carbohydrate crops such as switchgrass and vegetable-oil crops such as canola and sunflower, and hydrocarbon plants such as milkweed and gumweed.
Other biomass: (food processing) can include residues that are produced during the processing of a product, such as cheese whey, canning factory residues, fruit pits, apple pumice and coffee grounds.
Other biomass: (type unknown) any other type of biomass not otherwise identified on the questionnaire. Specify in the spaces provided.
Municipal and other waste: can include residues that are produced during the processing of a product, such as paper, cardboard, rubber, leather, natural textiles, wood, brush, grass clippings, kitchen wastes and sewage sludge.
D – Liquid fuel types used to generate electricity
Any energy form consumed not otherwise identified on the questionnaire. Specify in the spaces provided.
Biodiesel: refers to a non-petroleum-based diesel fuel consisting of short chain alkyl (methyl or ethyl) esters, made by transesterification of vegetable oil or animal fat (tallow), which can be used (alone, or blended with conventional petrodiesel) in unmodified diesel-engine vehicles.
Ethanol: (ethanol fuel) the same type of alcohol found in alcoholic beverages. It can be used as a fuel, mainly as a biofuel alternative to gasoline. It can be made from very common crops such as sugar cane and corn, it is an increasingly common alternative to gasoline in some parts of the world.
Other biofuel: any other type of biofuel not otherwise identified on the questionnaire. Specify in the spaces provided.
Light fuel oil (LFO): all distillate type fuels for power burners, fuel oil no. 1, fuel oil no. 2 (heating oil no. 2), fuel oil no. 3 (heating oil no. 3), furnace fuel oil, gas oils and light industrial fuel.
Heavy fuel oil (HFO): all grades of residual type fuels including low sulphur. Usually used for steam and electric power generation and diesel motors. Includes fuel oil nos. 4, 5 and 6. (Canadian/Foreign) - it is important to distinguish between Canadian versus imported Heavy Fuel Oil as each carries a different energy(sd) a content andis used to validate the integrity of Canada's Energy Balances.
Propane: is a three-carbon alkane, normally a gas, but compressible to a transportable liquid. It is derived from other petroleum products during oil or natural gas processing. It is commonly used as a fuel for engines, barbeques and home heating systems.
Diesel: all grades of distillate fuel used for diesel engines including low sulphur content (lower than 0.05%). Does not include diesel used for transportation off the plant site.
Spent pulping liquor: A by-product in the paper making process, containing carbohydrate and lignin decomposition products. Also known as black liquor.
Orimulsion: is a registered trademark name for a bitumen-based fuel that was developed for industrial use. Bitumen is a mixture of organic liquids that are highly viscous, black, sticky and entirely soluble in carbon disulfide and composed primarily of highly condensed polycyclic aromatic hydrocarbons. Currently orimulsion is used as a commercial boiler fuel in power plants worldwide.
E – Gaseous fuel types used to generate electricity
Any energy form consumed not otherwise identified on the questionnaire. Specify in the spaces provided.
Waste gasification: the process of waste gasification involves converting the organic material within the waste into synthetic natural gas (syngas), which is a mixture of carbon monoxide and hydrogen gas. The syngas is used to produce electricity in the same way that natural gas is combusted for energy production-in combined-cycle mode.
Gasification: uses high temperatures in the presence of oxygen to convert solid biomass into gas (known as producer gas) to fuel a turbine to generate electricity.
Natural gas: a mixture of hydrocarbons (principally methane) and small quantities of various hydrocarbons existing in the gaseous phase or in solution with crude oil in underground reservoirs.
Coke oven gas: is obtained as a by-product of the manufacture of coke oven coke for the production of iron and steel.
Biogas: is a chemical compound with the molecular formula CH4. It is the simplest alkane, and the principal component of natural gas. Burning methane in the presence of oxygen produces carbon dioxide and water.
Refinery fuel gas: a gaseous mixture of methane, light hydrocarbons, hydrogen, and other miscellaneous species (nitrogen, carbon dioxide, hydrogen sulphide, etc.) that is produced in the refining of crude oil and/or petrochemical processes and that is separated for use as a fuel in boilers and process heaters throughout the refinery.
F – Other fuel types used to generate electricity
Nuclear: is any nuclear technology designed to extract usable energy from atomic nuclei via controlled nuclear reactions. The most common method today is through nuclear fission, though other methods include nuclear fusion and radioactive decay.
Steam from waste heat: The amount of electricity generated when waste heat is recaptured to run a steam generator.
G – Useful thermal energy
Useful thermal energy produced: The amount of energy, in the form of heat, that is produced as a by-product of the generation of electricity and that is used for another application in a productive manner (e.g. the heating of industrial, commercial or residential space; steam used in an industrial process; etc.)
H – Units of Measure
Kilojoules per grams
(kj/g)
Kilojoules per kilograms
(kj/kg)
Kilojoules per litres
(kj/L)
Kilojoules per cubic meter
(kj/m3)
Metric tonnes
(t)
Kilolitres
(kl)
Thousands of cubic metres
(103 m3)
Kilograms
(kg)
Thousands of Canadian dollars
($'000)
Megawatt-hours
(MW.h)
I – Reporting Categories
Cogeneration Heat energy
Reported in Gigajoules, is defined as heat generated for the purpose of this business’s own use or for sale. It does not include heat by-products, such as waste heat.
Average heat content
The energy content one can expect to obtain from burning various raw materials.
Quantity/Volume
Please indicate the amount or volume of fuel used to generate electricity.
Total cost
Please indicate the fuel cost in thousands of Canadian dollars.
Total gross net electricity generation
Indicate the total (combined) amount of electricity generated, by all fuel types used, in MW.h
Gross electricity generation is the total amount of electricity generated by the power plant during the reporting period.
Gross electricity generation = Net electricity generation + Own use consumption.
(Net electricity generation is the amount of electricity generated by the power plant that is delivered to the electricity grid during the reporting period).
1. As of April 8, 2024, please select whether there was regular ongoing child care services provided at this location for each of the following age groups:
Regular ongoing child care services includefull-time, part-time, before and after school, overnight, and weekend services provided on a fixed or flexible schedule and drop-in child care.
If your organization is providing child care services at more than one address, please respond for this location only.
Select all that apply.
Children aged 5 or younger
Children aged 6 to 12 years old
Or
None of the above
Flow Condition: If "None of the above" is selected in Q1, exit survey. Otherwise go to Q2.
2. As of April 8, 2024, what type of child care services did this location provide?
Home-based
e.g., family child care, child care services provided in a private residence
Centre-based
e.g.,child care services provided in a facility that is not a private residence
3. In what year was your home child care service or this centre first established?
Year your home child care service or this centre was first established:
Or
Don't know
Flow Condition: If "Centre-based" is selected in Q2, go to Q3. Otherwise go to Q5.
4. Is this centre licensed by child care authorities from the provincial or territorial or local government?
Yes
In what year was it first licensed?
Year:
No
Don't know
Flow Condition: If "Home-based" was selected in Q2, go to Q5. Otherwise go to Q6.
5. To which of the following categories does your home child care service belong?
Licensed by the provincial or territorial or local government directly
In what year was it licensed?
Year:
Approved or registered by a child care agency, association or coordinating office
In what year was it approved or registered?
Year:
Not licensed by the provincial or territorial or local government directly and not approved or registered by a child care agency, association, or coordinating office
Has your home child care service previously been licensed by the provincial or territorial or local government or approved or registered by a child care agency?
Yes
No
Flow Condition: If "Not licensed by the provincial or territorial or local government directly and not approved or registered by a child care agency, association, or coordinating office" was selected in Q5, go to Q6. Otherwise go to Q7.
6. For which of the following reasons is your home child care service unlicensed?
Select all that apply.
I want control over my own business
There is no benefit to me becoming licensed
I do not meet all the requirements
There are too many requirements
I am in the process of becoming licensed
I do not plan on providing care for long enough to make it worthwhile
I did not know about the licensing system
The costs associated with meeting the licensing requirements are too high
It is not necessary to obtain licensing for my business
Other reasons
Specify other reasons:
Flow condition: If "Centre-based" was selected in Q2, go to Q7. Otherwise go to Q10.
7. On April 8, 2024, was the legal status of this centre a not-for-profit?
i.e., organized and operated exclusively for a purpose other than profit
Yes
Has this centre ever operated as a private or for-profit organization?
Yes
No
Don't know
No
Is this centre a for-profit organization?
i.e., privately owned and operated
Yes
No
Don't know
8. On April 8, 2024, was this centre operated directly by a government agency?
e.g., school board or district, municipality, regional district or public health authority
Yes
No
Don't know
9. On April 8, 2024, was this centre operated by a First Nations, Métis or Inuit organization or association?
Yes
No
Don't know
10. On April 8, 2024, what types of care options did your home child care service or this centre offer?
Select all that apply.
Full-time
Child care offered for 6 hours or more per day and at least 5 days per week.
Part-time
Child care offered for either 6 hours or more per day and less than 5 days per week or for less than 6 hours per day, for any number of days per week.
Before school
After school
Weekends
Evenings
Child care offered after 6 PM.
Overnight
Drop-in
Flexible
Additional or alternative days of child care offered upon request for non regular full-time children.
11. On April 8, 2024, what languages were regularly spoken while providing child care with children or parents in your home child care service or this centre?
Select all that apply.
English
French
Chinese
Punjabi
Indigenous language
Other languages
Specify the other languages spoken:
Operating days
12. In March 2024, what were the usual days of operation of your home child care service or this centre?
Usual days of operation are the days during which your home child care service or this centre is open to provide care for children.
Select all that apply.
Monday
Tuesday
Wednesday
Thursday
Friday
Saturday
Sunday
Operating hours
Display condition: Only days of the week that were selected in Q12 are shown in Q13.
13. In March 2024, what were the operating hours of your home child care service or this centre during its usual days of operation?
Operating hours are the hours during which your home child care service or this centre is open to provide care for children.
Monday
Start time
End time
Tuesday
Start time
End time
Wednesday
Start time
End time
Thursday
Start time
End time
Friday
Start time
End time
Saturday
Start time
End time
Sunday
Start time
End time
Maximum capacity
14. On April 8, 2024, what was the maximum capacity of your home child care service or this centre?
Maximum capacity refers to the maximum number of children to which child care services can be provided to at one time during your home child care service's or this centre's operating hours.
Report the maximum capacity or maximum number of children allowed as indicated on the child care licence or permit for this child care location.
Otherwise, report the maximum capacity or maximum number of children allowed for this type of child care service according to provincial or territorial child care regulations, considering the number of caregivers and the ages of enrolled children.
Maximum capacity in number of children:
15. On April 8, 2024, was your home child care service or this centre operating at its maximum capacity?
Refers to capacity occupied by children who were scheduled to attend on this day, even if they were absent.
Yes
No
On April 8, 2024, how many more children would your home child care service or this centre have been allowed to provide care to?
Number of children:
16. Compared to April 7, 2023, has there been a change in the maximum capacity of your home child care service or this centre?
Maximum capacity refers to the maximum number of children to which child care services can be provided to at one time during your home child care service's or this centre's operating hours.
Yes,there has been anincrease in maximum capacity
Yes, there has been a decrease in maximum capacity
No change
Enrollment
Flow condition: If "Centre-based" is selected in Q2, go to Q17. Otherwise, go to Q19.
17. On April 8, 2024, how many children were enrolled at this centre?
Include children 12 years and younger, including those enrolled full-time, part-time, before school only, after school only or both before and after school.
Full-time refers to children enrolled to attend this centre for 6 hours or more per day, at least 5 days per week. Part-time refers to children enrolled to attend this centre for either 6 hours or more per day and less than 5 days per week or for less than 6 hours per day, for any number of days per week.
Total number of children enrolled:
Total number of children enrolled may exceed the maximum capacity of this centre.
Display condition: Based on the province or territory the home or centre was located in, the age groups for that province or territory were displayed.
18. On April 8, 2024, how many children were enrolled at this centre on a full-time and part-time basis by age group?
Provide the number of children enrolled full-time and part-time separately by age group. Age groups provided are defined by provincial or territorial licensing age ranges or by child care agencies, associations or coordinating offices.
Count each child once according to the age group to which the child was assigned to meet provincial or territorial maximum group size regulations.
Full-time refers to children enrolled to attend this centre for 6 hours or more per day, at least 5 days per week. Part-time refers to children enrolled to attend this centre for either 6 hours or more per day and less than 5 days per week or for less than 6 hours per day, for any number of days per week.
Enter "0" if there is no value to report.
Newfoundland and Labrador:
a. Infants – aged less than 24 months
Number of children enrolled full-time
Number of children enrolled part-time
b. Toddlers – children aged 18 months to less than 3 years
Number of children enrolled full-time
Number of children enrolled part-time
c. Pre-school age children – children aged 2 years, 9 months to less than 5 years, 9 months who do not attend pre-kindergarten nor school
Number of children enrolled full-time
Number of children enrolled part-time
d. Pre-kindergarten age children – children aged 3 years, 8 months to less than 5 years, 9 months who attend pre-kindergarten
Number of children enrolled full-time
Number of children enrolled part-time
e. School age children – children aged 4 years, 8 months to 13 years who attend school
Number of children enrolled full-time
Number of children enrolled part-time
Prince Edward Island:
a. Children aged less than 22 months
Number of children enrolled full-time
Number of children enrolled part-time
b. Children aged 22 months to 3 years
Number of children enrolled full-time
Number of children enrolled part-time
c. Children aged 3 years or more who do not attend school
Number of children enrolled full-time
Number of children enrolled part-time
d. School age children – children aged 3 years or more who attend school
Number of children enrolled full-time
Number of children enrolled part-time
Nova Scotia:
a. Infants – children aged less than 18 months
Number of children enrolled full-time
Number of children enrolled part-time
b. Toddlers – children aged 18 months to less than 36 months
Number of children enrolled full-time
Number of children enrolled part-time
c. Preschoolers – children aged 3 years or older who do not attend school nor a pre-primary program
Number of children enrolled full-time
Number of children enrolled part-time
d. Pre-primary children – children who attend a pre-primary program
Number of children enrolled full-time
Number of children enrolled part-time
e. School-age children – children 12 and under who attend school above pre-primary level
Number of children enrolled full-time
Number of children enrolled part-time
New Brunswick:
a. Infants – children aged less than 2 years
Number of children enrolled full-time
Number of children enrolled part-time
b. Preschool children, aged 2 years old
Number of children enrolled full-time
Number of children enrolled part-time
c. Preschool children, aged 3 years old – Children who do not attend school
Number of children enrolled full-time
Number of children enrolled part-time
d. Preschool children, aged 4 years or older – Children who do not attend school
Number of children enrolled full-time
Number of children enrolled part-time
e. School-age children – children who attend school
Number of children enrolled full-time
Number of children enrolled part-time
Quebec:
a. Children aged less than 18 months
Number of children enrolled full-time
Number of children enrolled part-time
b. Children aged 18 months to less than 4 years who do not attend school
Number of children enrolled full-time
Number of children enrolled part-time
c. Children aged 4 years or more who do not attend school
Number of children enrolled full-time
Number of children enrolled part-time
d. Children who attend school
Number of children enrolled full-time
Number of children enrolled part-time
Ontario:
a. Infants – children aged less than 18 months
Number of children enrolled full-time
Number of children enrolled part-time
b. Toddlers – children aged 18 months to less than 30 months
Number of children enrolled full-time
Number of children enrolled part-time
c. Preschool age children – children aged 30 months to less than 6 years who do not attend school
Number of children enrolled full-time
Number of children enrolled part-time
d. Kindergarten age children – children aged 44 months to less than 7 years who attend kindergarten
Number of children enrolled full-time
Number of children enrolled part-time
e. Primary / Junior grade school age children – children aged 68 months to 12 years who attend school
Number of children enrolled full-time
Number of children enrolled part-time
Manitoba:
a. Infants, aged 12 weeks to less than 12 months
Number of children enrolled full-time
Number of children enrolled part-time
b. Infants, aged 12 months to less than 24 months
Number of children enrolled full-time
Number of children enrolled part-time
c. Preschool age children, aged 2 years old
Number of children enrolled full-time
Number of children enrolled part-time
d. Preschool age children, aged 3 years old – children who do not attend school
Number of children enrolled full-time
Number of children enrolled part-time
e. Preschool age children, aged 4 years old – children who do not attend school
Number of children enrolled full-time
Number of children enrolled part-time
f. Preschool age children, aged 5 years and older – children who do not attend school
Number of children enrolled full-time
Number of children enrolled part-time
g. School age children - children who attend school
Number of children enrolled full-time
Number of children enrolled part-time
Saskatchewan:
a. Infants – children aged 6 weeks to less than 18 months
Number of children enrolled full-time
Number of children enrolled part-time
b. Toddlers – children aged 18 months to less than 30 months
Number of children enrolled full-time
Number of children enrolled part-time
c. Preschool children – children aged 30 months or more who do not attend school
Number of children enrolled full-time
Number of children enrolled part-time
d. School-age children – children who attend school
Number of children enrolled full-time
Number of children enrolled part-time
Alberta:
a. Infants, aged less than 12 months
Number of children enrolled full-time
Number of children enrolled part-time
b. Infants, aged 12 months to less than 19 months
Number of children enrolled full-time
Number of children enrolled part-time
c. Children aged 19 months to less than 3 years – children who do not attend school
Number of children enrolled full-time
Number of children enrolled part-time
d. Pre-school children, aged 3 years to less than 4 years – children who do not attend school
Number of children enrolled full-time
Number of children enrolled part-time
e. Pre-school children, aged 4 years or more – children who do not attend school
Number of children enrolled full-time
Number of children enrolled part-time
f. Kindergarten children and school-aged children – children aged 4 years or more who attend school
Number of children enrolled full-time
Number of children enrolled part-time
British Columbia:
a. Children aged less than 18 months
Number of children enrolled full-time
Number of children enrolled part-time
b. Children aged 18 months to less than 30 months
Number of children enrolled full-time
Number of children enrolled part-time
c. Preschool children - Children aged 30 months or more who do not attend school
Number of children enrolled full-time
Number of children enrolled part-time
d. School age children – Children who attend school
Number of children enrolled full-time
Number of children enrolled part-time
Yukon:
a. Infants - children less than 18 months
Number of children enrolled full-time
Number of children enrolled part-time
b. Preschool children, aged 18 months to less than 3 years – children who do not attend school
Number of children enrolled full-time
Number of children enrolled part-time
c. Preschool children, aged 3 years or more – children who do not attend school
Number of children enrolled full-time
Number of children enrolled part-time
d. School age children – children who attend school
Number of children enrolled full-time
Number of children enrolled part-time
Northwest Territories:
a. Infants, aged less than 13 months
Number of children enrolled full-time
Number of children enrolled part-time
b. Infants, aged 13 months to less than 25 months
Number of children enrolled full-time
Number of children enrolled part-time
c. Preschool child, aged 25 months to less than 36 months
Number of children enrolled full-time
Number of children enrolled part-time
d. Preschool children, aged 3 years – children who do not attend school
Number of children enrolled full-time
Number of children enrolled part-time
e. Preschool children, aged 4 years – children who do not attend school
Number of children enrolled full-time
Number of children enrolled part-time
f. Preschool children, aged 5 years or more – children who do not attend school
Number of children enrolled full-time
Number of children enrolled part-time
g. School age children – children who attend school
Number of children enrolled full-time
Number of children enrolled part-time
Nunavut:
a. Children aged 0 to 12 months
Number of children enrolled full-time
Number of children enrolled part-time
b. Children aged 13 to 24 months
Number of children enrolled full-time
Number of children enrolled part-time
c. Children aged 25 to 35 months
Number of children enrolled full-time
Number of children enrolled part-time
d. Children aged 3 years
Number of children enrolled full-time
Number of children enrolled part-time
e. Children aged 4 years who do not attend school
Number of children enrolled full-time
Number of children enrolled part-time
f. Children aged 5 years or more who do not attend school
Number of children enrolled full-time
Number of children enrolled part-time
g. School age children – children who attend school
Number of children enrolled full-time
Number of children enrolled part-time
Flow condition: If "Home-based" is selected in Q2, go to Q19. Otherwise, go to Q20.
19. On April 8, 2024, how many children were enrolled at your home child care service by age group?
If applicable, include your own children or children living in your household who count toward the maximum number of children allowed at this child care service.
Children attending school includeschildren regardless of age, in full or part-day schooling external to the child care service, enrolled to attend this home service either 6 hours or more per day and less than 5 days per week or for less than 6 hours per day, for any number of days per week.
Enter "0" if there is no value to report. Total number of children enrolled may exceed the maximum capacity of this home child care service.
a. Children aged 5 and younger not attending school
Number of children enrolled
b. Children attending school
Include children regardless of age in full day or part day schooling.
Number of children enrolled
Flow condition: If "Centre-based" is selected in Q2, and did not report any infant enrollment in Q18, go to Q20. Otherwise, go to Q21.
20. Does this centre accept infants for enrollment?
Yes
No
21. On April 8, 2024, did your home child care service or this centre have a list of children waiting to be enrolled?
Yes
No
Flow condition: If "Centre-based" is selected in Q2, go to Q22. Otherwise, go to Q23.
Display condition: Based on the province or territory the centre was located in, the age groups for which the centre reported enrollment were displayed.
22. On April 8, 2024, how many rooms and employees were allocated to children enrolled at this centre by age group?
Rooms with mixed age groups should be assigned to the age group that contains most of the children in that room. For example, if a room contains 4 toddlers and 6 pre-school aged children, allocate the room to the pre-school aged group. For rooms that contain an equal number of children in more than one age group, assign the rooms to the youngest age group. For example, if a room contains 4 toddlers and 4 pre-school aged children, allocate the room to the toddler age group.
Newfoundland and Labrador:
a. Infants – aged less than 24 months
Number of rooms allocated
Number of employees providing direct care
b. Toddlers – children aged 18 months to less than 3 years
Number of rooms allocated
Number of employees providing direct care
c. Pre-school age children – children aged 2 years, 9 months to less than 5 years, 9 months who do not attend pre-kindergarten nor school
Number of rooms allocated
Number of employees providing direct care
d. Pre-kindergarten age children – children aged 3 years, 8 months to less than 5 years, 9 months who attend pre-kindergarten
Number of rooms allocated
Number of employees providing direct care
e. School age children – children aged 4 years, 8 months to 13 years who attend school
Number of rooms allocated
Number of employees providing direct care
Prince Edward Island:
a. Children aged less than 22 months
Number of rooms allocated
Number of employees providing direct care
b. Children aged 22 months to 3 years
Number of rooms allocated
Number of employees providing direct care
c. Children aged 3 years or more who do not attend school
Number of rooms allocated
Number of employees providing direct care
d. School age children – children aged 3 years or more who attend school
Number of rooms allocated
Number of employees providing direct care
Nova Scotia:
a. Infants – children aged less than 18 months
Number of rooms allocated
Number of employees providing direct care
b. Toddlers – children aged 18 months to less than 36 months
Number of rooms allocated
Number of employees providing direct care
c. Preschoolers – children aged 3 years or older who do not attend school nor a pre-primary program
Number of rooms allocated
Number of employees providing direct care
d. Pre-primary children – children who attend a pre-primary program
Number of rooms allocated
Number of employees providing direct care
e. School-age children – children 12 and under who attend school above pre-primary level
Number of rooms allocated
Number of employees providing direct care
New Brunswick:
a. Infants – children aged less than 2 years
Number of rooms allocated
Number of employees providing direct care
b. Preschool children, aged 2 years old
Number of rooms allocated
Number of employees providing direct care
c. Preschool children, aged 3 years old – Children who do not attend school
Number of rooms allocated
Number of employees providing direct care
d. Preschool children, aged 4 years or older – Children who do not attend school
Number of rooms allocated
Number of employees providing direct care
e. School-age children – children who attend school
Number of rooms allocated
Number of employees providing direct care
Quebec:
a. Children aged less than 18 months
Number of rooms allocated
Number of employees providing direct care
b. Children aged 18 months to less than 4 years who do not attend school
Number of rooms allocated
Number of employees providing direct care
c. Children aged 4 years or more who do not attend school
Number of rooms allocated
Number of employees providing direct care
d. Children who attend school
Number of rooms allocated
Number of employees providing direct care
Ontario:
a. Infants – children aged less than 18 months
Number of rooms allocated
Number of employees providing direct care
b. Toddlers – children aged 18 months to less than 30 months
Number of rooms allocated
Number of employees providing direct care
c. Preschool age children – children aged 30 months to less than 6 years who do not attend school
Number of rooms allocated
Number of employees providing direct care
d. Kindergarten age children – children aged 44 months to less than 7 years who attend kindergarten
Number of rooms allocated
Number of employees providing direct care
e. Primary / Junior grade school age children – children aged 68 months to 12 years who attend school
Number of rooms allocated
Number of employees providing direct care
Manitoba:
a. Infants, aged 12 weeks to less than 12 months
Number of rooms allocated
Number of employees providing direct care
b. Infants, aged 12 months to less than 24 months
Number of rooms allocated
Number of employees providing direct care
c. Preschool age children, aged 2 years old
Number of rooms allocated
Number of employees providing direct care
d. Preschool age children, aged 3 years old – children who do not attend school
Number of rooms allocated
Number of employees providing direct care
e. Preschool age children, aged 4 years old – children who do not attend school
Number of rooms allocated
Number of employees providing direct care
f. Preschool age children, aged 5 years and older – children who do not attend school
Number of rooms allocated
Number of employees providing direct care
g. School age children - children who attend school
Number of rooms allocated
Number of employees providing direct care
Saskatchewan:
a. Infants – children aged 6 weeks to less than 18 months
Number of rooms allocated
Number of employees providing direct care
b. Toddlers – children aged 18 months to less than 30 months
Number of rooms allocated
Number of employees providing direct care
c. Preschool children – children aged 30 months or more who do not attend school
Number of rooms allocated
Number of employees providing direct care
d. School-age children – children who attend school
Number of rooms allocated
Number of employees providing direct care
Alberta:
a. Infants, aged less than 12 months
Number of rooms allocated
Number of employees providing direct care
b. Infants, aged 12 months to less than 19 months
Number of rooms allocated
Number of employees providing direct care
c. Children aged 19 months to less than 3 years – children who do not attend school
Number of rooms allocated
Number of employees providing direct care
d. Pre-school children, aged 3 years to less than 4 years – children who do not attend school
Number of rooms allocated
Number of employees providing direct care
e. Pre-school children, aged 4 years or more – children who do not attend school
Number of rooms allocated
Number of employees providing direct care
f. Kindergarten children and school-aged children – children aged 4 years or more who attend school
Number of rooms allocated
Number of employees providing direct care
British Columbia:
a. Children aged less than 18 months
Number of rooms allocated
Number of employees providing direct care
b. Children aged 18 months to less than 30 months
Number of rooms allocated
Number of employees providing direct care
c. Preschool children - Children aged 30 months or more who do not attend school
Number of rooms allocated
Number of employees providing direct care
d. School age children – Children who attend school
Number of rooms allocated
Number of employees providing direct care
Yukon:
a. Infants - children less than 18 months
Number of rooms allocated
Number of employees providing direct care
b. Preschool children, aged 18 months to less than 3 years – children who do not attend school
Number of rooms allocated
Number of employees providing direct care
c. Preschool children, aged 3 years or more – children who do not attend school
Number of rooms allocated
Number of employees providing direct care
d. School age children – children who attend school
Number of rooms allocated
Number of employees providing direct care
Northwest Territories:
a. Infants, aged less than 13 months
Number of rooms allocated
Number of employees providing direct care
b. Infants, aged 13 months to less than 25 months
Number of rooms allocated
Number of employees providing direct care
c. Preschool child, aged 25 months to less than 36 months
Number of rooms allocated
Number of employees providing direct care
d. Preschool children, aged 3 years – children who do not attend school
Number of rooms allocated
Number of employees providing direct care
e. Preschool children, aged 4 years – children who do not attend school
Number of rooms allocated
Number of employees providing direct care
f. Preschool children, aged 5 years or more – children who do not attend school
Number of rooms allocated
Number of employees providing direct care
g. School age children – children who attend school
Number of rooms allocated
Number of employees providing direct care
Nunavut:
a. Children aged 0 to 12 months
Number of rooms allocated
Number of employees providing direct care
b. Children aged 13 to 24 months
Number of rooms allocated
Number of employees providing direct care
c. Children aged 25 to 35 months
Number of rooms allocated
Number of employees providing direct care
d. Children aged 3 years
Number of rooms allocated
Number of employees providing direct care
e. Children aged 4 years who do not attend school
Number of rooms allocated
Number of employees providing direct care
f. Children aged 5 years or more who do not attend school
Number of rooms allocated
Number of employees providing direct care
g. School age children – children who attend school
Number of rooms allocated
Number of employees providing direct care
Fees
Flow condition: If "Centre-based" is selected in Q2, go to next condition. Otherwise, go to Q24.
If infant age groups were not reported in Q18 and school age groups were reported in Q18, go to Q24.
Display condition: Based on the province or territory the centre was located in, the age groups for which the centre reported enrollment were displayed.
23. On April 8, 2024, what were the full-time daily fees collected from parents per child by age group?
Age groups provided are those defined in provincial or territorial child care regulations.
Full-time refers to children enrolled to attend this centre for 6 hours or more per day, at least 5 days per week.
Newfoundland and Labrador:
a. Infants – aged less than 24 months
Full-time daily fee
b. Toddlers – children aged 18 months to less than 3 years
Full-time daily fee
c. Pre-school age children – children aged 2 years, 9 months to less than 5 years, 9 months who do not attend pre-kindergarten nor school
Full-time daily fee
Prince Edward Island:
a. Children aged less than 22 months
Full-time daily fee
b. Children aged 22 months to 3 years
Full-time daily fee
c. Children aged 3 years or more who do not attend school
Full-time daily fee
Nova Scotia:
a. Infants – children aged less than 18 months
Full-time daily fee
b. Toddlers – children aged 18 months to less than 36 months
Full-time daily fee
c. Preschoolers – children aged 3 years or older who do not attend school nor a pre-primary program
Full-time daily fee
New Brunswick:
a. Infants – children aged less than 2 years
Full-time daily fee
b. Preschool children, aged 2 years old
Full-time daily fee
c. Preschool children, aged 3 years old – Children who do not attend school
Full-time daily fee
d. Preschool children, aged 4 years or older – Children who do not attend school
Full-time daily fee
Quebec:
a. Children aged less than 18 months
Full-time daily fee
b. Children aged 18 months to less than 4 years who do not attend school
Full-time daily fee
c. Children aged 4 years or more who do not attend school
Full-time daily fee
Ontario:
a. Infants – children aged less than 18 months
Full-time daily fee
b. Toddlers – children aged 18 months to less than 30 months
Full-time daily fee
c. Preschool age children – children aged 30 months to less than 6 years who do not attend school
Full-time daily fee
Manitoba:
a. Infants, aged 12 weeks to less than 12 months
Full-time daily fee
b. Infants, aged 12 months to less than 24 months
Full-time daily fee
c. Preschool age children, aged 2 years old
Full-time daily fee
d. Preschool age children, aged 3 years old – children who do not attend school
Full-time daily fee
e. Preschool age children, aged 4 years old – children who do not attend school
Full-time daily fee
f. Preschool age children, aged 5 years and older – children who do not attend school
Full-time daily fee
Saskatchewan:
a. Infants – children aged 6 weeks to less than 18 months
Full-time daily fee
b. Toddlers – children aged 18 months to less than 30 months
Full-time daily fee
c. Preschool children – children aged 30 months or more who do not attend school
Full-time daily fee
Alberta:
a. Infants, aged less than 12 months
Full-time daily fee
b. Infants, aged 12 months to less than 19 months
Full-time daily fee
c. Children aged 19 months to less than 3 years – children who do not attend school
Full-time daily fee
d. Pre-school children, aged 3 years to less than 4 years – children who do not attend school
Full-time daily fee
e. Pre-school children, aged 4 years or more – children who do not attend school
Full-time daily fee
British Columbia:
a. Children aged less than 18 months
Full-time daily fee
b. Children aged 18 months to less than 30 months
Full-time daily fee
c. Preschool children - Children aged 30 months or more who do not attend school
Full-time daily fee
Yukon:
a. Infants - children less than 18 months
Full-time daily fee
b. Preschool children, aged 18 months to less than 3 years – children who do not attend school
Full-time daily fee
c. Preschool children, aged 3 years or more – children who do not attend school
Full-time daily fee
Northwest Territories:
a. Infants, aged less than 13 months
Full-time daily fee
b. Infants, aged 13 months to less than 25 months
Full-time daily fee
c. Preschool child, aged 25 months to less than 36 months
Full-time daily fee
d. Preschool children, aged 3 years – children who do not attend school
Full-time daily fee
e. Preschool children, aged 4 years – children who do not attend school
Full-time daily fee
f. Preschool children, aged 5 years or more – children who do not attend school
Full-time daily fee
Nunavut:
a. Children aged 0 to 12 months
Full-time daily fee
b. Children aged 13 to 24 months
Full-time daily fee
c. Children aged 25 to 35 months
Full-time daily fee
d. Children aged 3 years
Full-time daily fee
e. Children aged 4 years who do not attend school
Full-time daily fee
f. Children aged 5 years or more who do not attend school
Full-time daily fee
Flow condition: If "Home-based" is selected in Q2 and "Children aged 5 and younger not attending school" is reported in Q19, or "Children aged 5 and younger not attending school" and "Children attending school" are 0 in Q19, or "Children aged 5 and younger not attending school" and "Children attending school" are nonresponse in Q19, or "Children aged 5 and younger not attending school" is nonresponse and "Children attending school" is 0 in Q19, go to Q24. Otherwise, go to Q25.
24. On April 8, 2024, what was the full-time daily fee collected from parents for children aged 5 and younger that were not attending school?
Full-time refers to children enrolled to attend this home child care for 6 hours or more per day, at least 5 days per week.
If there are multiple fees, indicate the most frequently charged.
a. Children aged 5 and younger not attending school
Full-time daily fee
Flow condition: If "Centre-based" is selected in Q2, go to next condition. Otherwise, go to Q26. If infant age groups were not reported in Q18 and school age groups were reported in Q18, go to Q26.
Display condition: Based on the province or territory the centre was located in, the age groups for which the centre reported enrollment were displayed.
25. On April 8, 2024, what were the daily fees collected from parents per child by age group?
Age groups are those defined by provincial or territorial child care regulations.
Newfoundland and Labrador:
d. Pre-kindergarten age children – children aged 3 years, 8 months to less than 5 years, 9 months who attend pre-kindergarten
Daily fee
e. School age children – children aged 4 years, 8 months to 13 years who attend school
Daily fee
Prince Edward Island:
d. School age children – children aged 3 years or more who attend school
Daily fee
Nova Scotia:
d. Pre-primary children – children who attend a pre-primary program
Daily fee
e. School-age children – children 12 and under who attend school above pre-primary level
Daily fee
New Brunswick:
e. School-age children – children who attend school
Daily fee
Quebec:
d. Children who attend school
Daily fee
Ontario:
d. Kindergarten age children – children aged 44 months to less than 7 years who attend kindergarten
Daily fee
e. Primary / Junior grade school age children – children aged 68 months to 12 years who attend school
Daily fee
Manitoba:
g. School age children - children who attend school
Daily fee
Saskatchewan:
d. School-age children – children who attend school
Daily fee
Alberta:
f. Kindergarten children and school-aged children – children aged 4 years or more who attend school
Daily fee
British Columbia:
d. School age children – Children who attend school
Daily fee
Yukon:
d. School age children – children who attend school
Daily fee
Northwest Territories:
g. School age children – children who attend school
Daily fee
Nunavut:
g. School age children – children who attend school
Daily fee
Flow condition: If "Home-based" is selected in Q2 and "Children attending school" is reported in Q19, or "Children aged 5 and younger not attending school" and "Children attending school" are 0 in Q19, or "Children aged 5 and younger not attending school" and "Children attending school" are nonresponse in Q19 or, "Children aged 5 and younger not attending school" is 0 and "Children attending school" is nonresponse in Q19, go to Q26. Otherwise, go to Q27.
26. On April 8, 2024, what was the daily fee collected from parents for school-aged children at your home child care service?
If there are multiple fees, indicate the most frequently charged.
a. Children attending school
Include children regardless of age in full day or part day schooling.
Daily fee
27. On April 8, 2024 did your home child care service or this centre charge parents for other goods or services in addition to those covered by the set daily fee?
Include transportation, late pick up, supplies, food, diapers, activity fee and field trips.
Yes
No
Don't know
Flow condition: If province is Quebec, go to Q29. Otherwise go to next condition.
If "Home-based" is selected in Q2 and "Approved or registered by a child care agency, association or coordinating office" or "Not licensed by the provincial or territorial or local government directly and not approved or registered by a child care agency, association, or coordinating office" is select in Q5, go to Q28. Otherwise go to next condition.
If "Centre-based" is select in Q2, go to Q28. Otherwise go to Q29.
Subsidies
28. Did any of the children enrolled at you home child care service or this centre on April 8, 2024 receive a subsidy to cover all or part of the usual parent fee?
Include costs that were partially or fully covered.
Exclude the Canada Child Benefit, the Child Care Expense Deduction, and other child care tax credits.
Yes
No
Don't know
Workforce characteristics
Flow condition: If "Centre-based" is selected in Q2, go to Q29. Otherwise go to Q30.
29. On the last pay period of March 2024 how many paid employees did this centre have in the following categories?
Include paid employees at this location who work on-site, as well as casual workers, supply staff, on call employees, paid students and employees that work full-time or part-time. Exclude volunteers and any unpaid employees or students.
Supervisory staff includes directors, managers, or supervisors regardless of whether they provided direct care to children or not.
Full-time employees include employees that work 30 hours or more per week.
Part-time employees include employees that work less than 30 hours per week.
a. Supervisory staff
Include directors, managers, or supervisors.
Full-time employees
Part-time employees
Casual, on call, or supply staff
b. Non-supervisory staff providing direct care to children
Full-time employees
Part-time employees
Casual, on call, or supply staff
c. Support staff
e.g., cooks, cleaners or accountants
Full-time employees
Part-time employees
Casual, on call, or supply staff
Total
Full-time employees
Part-time employees
Casual, on call, or supply staff
Flow condition: If "Home-based" is selected in Q2, go to Q30. Otherwise go to Q31.
30. On April 8, 2024, did this home child care service have any paid employees providing direct care to children other than the owner or operator?
Exclude volunteers, unpaid students, workers on leave and any paid employees that did not directly provide care to children such as cooks, cleaners or accountants.
Yes
On April 8, 2024, how many paid employees providing direct care to children did this home child care service have?
Full-time employees providing direct care to children
Include employees that work 30 hours or more per week.
Part-time employees providing direct care to children:
Include employees that work less than 30 hours per week.
Casual, on-call, or supply staff:
No
Flow condition: If "Centre-based" is selected in Q2, go to Q31. Otherwise go to Q32.
31. Provide the number of employees this centre had based on their highest level of formal Early Childhood Education (ECE)-related training as of April 8, 2024.
Exclude volunteers, unpaid students, workers on leave and any support staff e.g., cooks, cleaners, accountants.
Supervisory staff includes directors, managers, or supervisors regardless of whether they provided direct care to children or not. Include both full-time and part-time supervisory staff under supervisory staff only.
a. No ECE-related training
Supervisory staff
Full-time staff providing direct care to children
Part-time staff providing direct care to children
b. ECE course or workshop less than 1 year
Supervisory staff
Full-time staff providing direct care to children
Part-time staff providing direct care to children
c. ECE 1, 2 or 3 year certificate or diploma from a post-secondary institution
Supervisory staff
Full-time staff providing direct care to children
Part-time staff providing direct care to children
d. ECE 4 year degree or graduate training
Supervisory staff
Full-time staff providing direct care to children
Part-time staff providing direct care to children
Total
Supervisory staff
Full-time staff providing direct care to children
Part-time staff providing direct care to children
Flow condition: If "Home-based" is selected in Q2, go to Q32. Otherwise go to Q33.
32. As of April 8, 2024, what was the highest level of formal Early Childhood Education (ECE)-related training that you had?
Family child care-specific workshop
ECE courses or workshops lasting less than 1 year
ECE 1 year certificate or diploma
ECE 2 year certificate or diploma
ECE 3 year certificate or diploma
ECE 4 year degree or graduate training
Other level of training
Specify the highest level of training:
No ECE-related training
Flow condition: If "Home-based" is selected in Q2 and "Yes" or "nonresponse" in Q30, go to Q33. Otherwise go to Q34.
33. Provide the number of paid employees this home child care service had based on their highest level of formal Early Childhood Education (ECE)-related training as of April 8, 2024.
Exclude volunteers, unpaid students, workers on leave and any paid employees that did not directly provide care to children such as cooks, cleaners or accountants.
a. Family child care-specific workshop
Employees providing direct care to children
b. ECE course or workshop less than 1 year
Employees providing direct care to children
c. ECE 1, 2 or 3 year certificate or diploma from a post-secondary institution
Employees providing direct care to children
d. ECE 4 year degree or graduate training
Employees providing direct care to children
e. No ECE-related training
Employees providing direct care to children
Total
Employees providing direct care to children
Flow condition: If "Centre-based" is selected in Q2, go to Q34. Otherwise go to Q36.
34. On April 8, 2024, did this centre have permission from licensing authorities to operate, for a specified period, with fewer Early Childhood Education (ECE)-qualified staff than required?
Yes
No
Don't know
35. Over the last year, did any paid employees providing direct care to children increase their Early Childhood Education (ECE) levels while employed at this centre?
An increase in ECE levels refers to a new certificate or diploma.
Exclude volunteers, unpaid students, workers on leave and any support staff such as cooks, cleaners and accountants.
Yes
No
Don't know
36. Over the last year, did any employees at this centre or did you or your employees or did you participate in any of the following child care-related professional development training, conferences, workshops or courses?
Include non-mandatory staff development training, conferences, workshops and courses.
Select all that apply.
Child health and personal care
Incorporating Indigenous or culturally relevant ways of knowing and learning
Communicating effectively with parents
Child development
e.g., socio-emotional, motor, cognitive
Working with children with disabilities
Working with children with diverse backgrounds
Facilitating play
Facilitating learning in literacy and numeracy
Facilitating learning in arts
Curriculum implementation
Pedagogical approaches or learning theories
Trauma informed practices
Autism spectrum disorder support training
2SLGBTQI+ support training
Emergency preparedness training
Or
None of the above
Flow condition: If "Centre-based" is selected in Q2, go to Q37. Otherwise go to Q38.
37. On the last pay period of March 2024, what was the minimum, maximum and most frequently paid hourly rate of employees at this centre?
Include all top-ups or wage enhancements on top of the hourly rate.
Exclude volunteers, unpaid students, workers on leave and any support staff e.g., cooks, cleaners, accountants.
a. Supervisory staff
Include directors, managers, or supervisors.
Minimum hourly rate
Maximum hourly rate
Most frequently paid hourly rate
b. Employees with ECE course or workshop less than 1 year
Exclude directors, managers, or supervisors.
Minimum hourly rate
Maximum hourly rate
Most frequently paid hourly rate
c. ECE 1, 2 or 3 year certificate or diploma from a post-secondary institution
Exclude directors, managers, or supervisors.
Minimum hourly rate
Maximum hourly rate
Most frequently paid hourly rate
d. Employees with ECE 4 year certificate or diploma
Exclude directors, managers, or supervisors.
Minimum hourly rate
Maximum hourly rate
Most frequently paid hourly rate
e. Employees with no ECE qualifications or training
Exclude any support staff e.g., cooks, cleaners, accountants.
Minimum hourly rate
Maximum hourly rate
Most frequently paid hourly rate
Flow condition; If "Yes" is selected in Q30, go to Q38. Otherwise go to Q39.
38. On the last pay period of March 2024, what was the most frequently paid hourly rate of employees at your home child care service?
Exclude volunteers, unpaid students, workers on leave and any support staff such as cooks, cleaners and accountants.
a. Staff providing direct care to children
Most frequently paid hourly rate
Flow condition: If "Centre-based" is selected in Q2, go to Q39. Otherwise go to next condition.
If "Home-based" is selected in Q2 and "yes" is selected in Q30, go to Q39. Otherwise go to Q41.
39. On the last pay period of March 2024, which of the following health or pay-related benefits were available to employees of your home child care service or this centre?
Select all that apply.
Dental care plan
Supplementary health or drug plan
Life insurance or disability insurance
Top up payments above what EI pays for maternity, parental leave
Pension plan contribution
Group RRSP
Paid sick leave
Other benefits
Specify other benefits:
Or
None of the above
40. On the last pay period of March 2024, which of the following benefits were available to employees of your home child care service or this centre?
Select all that apply.
Paid breaks other than those required by law
Program planning or lesson planning and preparation time
Paid documentation time
Paid overtime
Time off in lieu of overtime
Reduced child care fees for own children
Financial assistance with First Aid certification
Financial assistance (or a Professional Development Fund) to attend ECE-related workshops or conferences
Financial assistance (or a Professional Development Fund) to take courses or post-basic training
Paid time for training, workshops, conferences or peer learning
Paid staff meetings
Other benefits
Specify other benefits:
Or
None of the above
Flow condition: If "Centre-based" is selected in Q2, go to Q41. Otherwise go to Q46.
41. On the last pay period of March 2024, were employees of this centre that provide direct care to children unionized?
Yes
No
Don't know
Hires, departures and vacancies
42. Report the number of employees hired by this centre from January 1 to December 31 2023.
A hire is any addition or returning child care employee to this centre's payroll from January 1 to December 31 2023.
Exclude:
transfers or promotions within this location or another location run by the same organization;
independent contractors or consultants; and
employees of temporary help agencies.
a. Supervisory staff
Include directors, managers, and supervisors.
Number of employees hired from January 1 to December 31 2023
b. Employees providing direct care to children with sufficient ECE qualifications or training
Exclude directors, managers, and supervisors.
Sufficient refers to the legal requirements as set out by the province or territory.
Number of employees hired from January 1 to December 31 2023
c. Employees providing direct care to children without sufficient ECE qualifications or training
Exclude directors, managers, and supervisors.
Number of employees hired from January 1 to December 31 2023
Total
Number of employees hired from January 1 to December 31 2023
43. Report the number of employee departures this centre had from January 1 to December 31 2023.
Exclude transfers within this location, employees on strike, employees of temporary help agencies, volunteers or co-op students and employees that departed and were rehired within the reference period.
Include voluntary departures under employees that quit.
Other departures include dismissals, permanent layoffs, temporary layoffs and transfers to other locations.
a. Supervisory staff
Include directors, managers, and supervisors.
Number of employees that quit
Number of employees that retired
Number of other employee departures
b. Employees providing direct care to children with sufficient ECE qualifications or training
Exclude directors, managers, and supervisors.
Sufficient refers to the legal requirements as set out by the province or territory.
Number of employees that quit
Number of employees that retired
Number of other employee departures
c. Employees providing direct care to children without sufficient ECE qualifications or training
Exclude directors, managers, and supervisors.
Number of employees that quit
Number of employees that retired
Number of other employee departures
Total
Number of employees that quit
Number of employees that retired
Number of other employee departures
44. Report the total number of vacancies this centre had on April 8, 2024.
Include full-time, part-time, temporary, permanent and seasonal vacant positions.
A job is vacant if it meets all three conditions:
a specific position exists;
work could start within 30 days; and
you are actively seeking workers from outside this location to fill the position.
Exclude:
positions to be filled by promotion or demotion, internal transfers or recall from layoffs;
positions with start dates more than 30 days in the future; and
positions for which employees have been hired, but they have not yet reported for work.
a. Supervisory staff
Include directors, managers, and supervisors.
Number of vacant positions
b. Employees providing direct care to children with sufficient ECE qualifications or training
Exclude directors, managers, and supervisors.
Sufficient refers to the legal requirements as set out by the province or territory.
Number of vacant positions
c. Employees providing direct care to children without sufficient ECE qualifications or training
Exclude directors, managers, and supervisors.
Number of vacant positions
Total
Number of vacant positions
Difficulties faced filling vacant positions
Flow condition: If "Centre-based" is selected in Q2, go to Q45. Otherwise go to Q46.
45. Which of the following difficulties has this centre faced when trying to fill vacant positions?
Select all that apply.
Lack of time to recruit
Lack of money or funding for recruiting
Applicants lack of skills required for the job
Applicants lack of related work experience
Few or no applicants to choose from
Applicant was not satisfied with salary offer
Applicant was not satisfied with employee benefits
Competition from other centres or organization
Competition from the school system
Lack of employment security
Work schedule did not meet applicants needs
Reduced the number of child care spaces because it has been unable to fill vacant positions with sufficiently qualified ECE staff
Child care centre is in a rural or remote location
Other difficulties
Specify other difficulties:
Or
No difficulties
Service characteristics
Flow condition: If "Home-based" is selected in Q2, go to Q46. Otherwise go to Q48.
46. Recognizing that there may be many reasons, what is the primary reason you have chosen to be a home child care provider?
To be with my own children, grandchildren, or relatives
Financial reasons
Flexibility
Safety concerns for own children
Could not get another job
Interest in child care profession
Other reason
Specify the primary reason:
47. Do you intend to continue providing child care services in your home three years from now?
Yes
No
What are the reasons you would no longer provide child care services in your home?
Select all that apply.
Ready for a career change
Plan to go back to school
My own children, grandchildren or relatives will no longer require me to be at home
I feel I will need a break
Financial instability
I do not like to work alone
Plan to retire
Plan to work in centre-based child care
Plan on moving
Requirements to be licensed due to legislation
Other reasons
Specify other reasons:
48. On April 8, 2024, did this child care service have accommodations or supports in place to serve the needs of children with a long-term condition or disability?
An accommodation refers to any characteristic of the child care environment, curriculum, or equipment that was purposely designed, built, or altered to remove potential barriers and encourage or promote the full participation of children with a disability in daily activities, e.g., fidget toys, learning aids, wheelchair ramps.
Support may refer to assisting children in compensating for intellectual, physical or behavioral challenges.
Include accommodations or supports in place regardless of whether or not children with a long-term condition or disability were enrolled at this child care service.
Yes
No
Child care location
Flow condition: If "Centre-based" is selected in Q2, go to Q49. Otherwise go to Q51.
49. Which of the following best describes the type of building in which this centre is currently located?
In an independent commercial building
In a house including a town house
In an apartment or condominium building
In or attached to a private school
In or attached to a publicly funded school
On a university or college campus
In a community centre, library, hospital, or other public building
In a place of worship
In an office building
In a shopping mall or strip mall
In a social housing complex
Other type of building
Specify other type of building:
50. Over the last year, has this centre expanded by increasing its physical space?
Yes
Did this centre receive any capital funding from the provincial or territorial government for this expansion?
Yes
No
Don't know
No
Flow condition: If "Home-based" is selected in Q2 and "Approved or registered by a child care agency, association or coordinating office" or "Not licensed by the provincial or territorial or local government directly and not approved or registered by a child care agency, association, or coordinating office" is selected in Q5, go to Q51. Otherwise go to next condition.
If "Centre-based" is selected in Q2, go to Q51. Otherwise go to Q53.
Operating budget
51. In March 2024, what percentage of your home child care service's or this centre's operating budget was paid for by the following categories?
Exclude capital funding and start-up funding.
Percent of operating budget received from government in other forms includes grants, operating funding and wage enhancement funding.
Please provide best estimates.
a. Paid by parents
Percentage of operating budget:
b. Paid by government
Percentage of operating budget:
c. Paid by other sources
e.g., operating expenses covered by an employer or organization
Percentage of operating budget:
52. In March 2024, what percentage of your home child care service's or this centre's operating budget was spent in the following categories?
Please provide best estimates.
a. Rent or mortgage
Percentage of operating budget:
b. Employee wages
Percentage of operating budget:
c. Building maintenance
Include both indoor and outdoor maintenance.
e.g., repairs, cleaning, landscaping
Percentage of operating budget:
d. Food
Percentage of operating budget:
e. Supplies
e.g., toys, furniture, craft materials
Percentage of operating budget:
f. Other
Percentage of operating budget:
Canada-Wide Early Learning and Child Care (CWELCC)
Flow condition: If province is Quebec, go to Q54. Otherwise go to next condition.
If "Home-based" is selected in Q2 and "Approved or registered by a child care agency, association or coordinating office" or "Not licensed by the provincial or territorial or local government directly and not approved or registered by a child care agency, association, or coordinating office" is selected in Q5, go to Q53. Otherwise go to next condition.
If "Centre-based" is selected in Q2, go to Q53. Otherwise go to Q54.
53. Does your child care service receive any funding from the Canada-Wide Early Learning and Child Care (CWELCC) agreement that your province or territory signed with the Government of Canada?
The Canada-Wide Early Learning and Child Care (CWELCC) agreement outlines is a five-year plan that is being implemented in stages, to make regulated child care more accessible and affordable. Under this plan, fees will be reduced to an average of $10 a day by 2025-2026.
Yes
No
Don't know
Flow condition: If province is Quebec and if "Home-based" is selected in Q2 and "Approved or registered by a child care agency, association or coordinating office" or "Not licensed by the provincial or territorial or local government directly and not approved or registered by a child care agency, association, or coordinating office" is selected in Q5, go to Q54. Otherwise go to next condition.
If province is Quebec and if "Centre-based" is selected in Q2, go to Q54. Otherwise go to Q55.
Québec Reduced Contribution Program
54. On April 8, 2024, did your home child care service or this centre offer child care services subsidized by the Québec Reduced Contribution Program?
Yes
No
Don't know
Flow condition: If "Home-based" is selected in Q2, go to Q55. Otherwise go to end of survey.
Home childcare provider characteristics
The groups identified within the following questions are included in order to gain a better understanding of child care businesses owned by members of various communities across Canada.
55. What is the gender of the owner or operator of this home child care service?
Gender refers to current gender which may be different from sex assigned at birth and may be different from what is indicated on legal documents.
Male
Female
Please specify
Specify the gender of the owner or operator:
Prefer not to answer
Don't know
56. Is the owner or operator of this home child care service First Nations, Métis, or Inuk (Inuit)?
First Nations (North American Indian) includes Status and Non-Status Indians.
Yes, First Nations (North American Indian), Métis, or Inuk (Inuit)
Which of the following best describes the owner or operator of this home child care service?
Select all that apply.
Yes, First Nations (North American Indian)
Yes, Métis
Yes, Inuk (Inuit)
No, not First Nations, Métis, or Inuk (Inuit)
Prefer not to answer
Don't know
57. Is the owner or operator of this home child care service a landed immigrant to Canada in the last 10 years?
A landed immigrant (permanent resident) is a person who has been granted the right to live in Canada permanently by immigration authorities.
Yes
No
Prefer not to answer
Don't know
58. Is the owner or operator of this home child care service a person with a disability?