I am pleased to present Statistics Canada’s report on fees for 2023–24.
The Service Fees Act provides a modern legislative framework that enables cost-effective delivery of services and, through better reporting to Parliament, improves transparency and oversight.
Statistics Canada reports to the Minister of Innovation, Science and Industry. Its mandate is to produce data that help Canadians better understand their country - its population, resources, economy, environment, society and culture. As Canada's central statistical office, Statistics Canada is legislated to serve this function for Canada and each of the provinces and territories. The agency must also conduct the Census of Population and the Census of Agriculture every five years, providing a detailed picture of Canadian society. Statistics Canada operates under the authority of the Statistics Act and is committed to protecting the confidentiality and privacy of the information it is entrusted with.
As part of the Innovation, Science and Economic Development portfolio, Statistics Canada has the authority to collect fees set by contract from external clients for cost-recovered statistical services.
The Service Fees Act enhances the transparency and accountability of fees charged by ISED and its portfolios. I support this reporting regime and I am committed to ensuring that Canadians and Canadian businesses receive quality services that reflect the principles of this Act.
The Honourable François-Philippe Champagne, P.C., M.P.
Minister of Innovation, Science and Industry
The report covers fees that are subject to the Service Fees Act.
For reporting purposes, fees are categorized by fee-setting mechanism. There are three mechanisms:
Act, regulation or fees notice
The authority to set these fees is delegated to a department, minister or Governor in Council pursuant to an act of Parliament.
Contract
Ministers have the authority to enter into contracts, which are usually negotiated between the minister and an individual or organization, and which cover fees and other terms and conditions. In some cases, that authority may also be provided by an act of Parliament.
Market rate or auction
The authority to set these fees is fixed pursuant to an act of Parliament or a regulation, and the minister, department or Governor in Council has no control in determining the fee amount.
No fees under Statistics Canada’s authority are set by act, regulation or fees notice. This report therefore only covers fees set by contract. It provides total revenue and costs only.
Fees charged by Statistics Canada under the Access to Information Act are not subject to the Service Fees Act and are not included in this report. Information on Statistics Canada’s access to information fees can be found in our annual report to Parliament on the administration of the Access to Information Act: Annual Reports on Access to Information and Privacy.
Remissions
In 2023–24, Statistics Canada was not subject to the requirements in section 7 of the Service Fees Act and had no authority to remit, so this report does not include remission amounts.
Overall totals, by fee-setting mechanism
The following table presents the total revenue, cost and remissions for all fees Statistics Canada had the authority to charge in 2023–24, by fee-setting mechanism.
Overall totals for 2023–24, by fee-setting mechanism
The 2021 Census of Population was Canada's 23rd national census. The COVID-19 pandemic emerged in Canada in early 2020 and affected all steps of the 2021 Census process, from data collection to dissemination. In light of this, the Census Program undertook an extensive review of its operations to adjust its plans and procedures to ensure the continuity of census activities while protecting the safety of all Canadians and its employees. This included, among others, focusing on contactless approaches (e.g., electronic questionnaire and telephone follow-up), revising engagement and communication efforts, and introducing remote work. Moreover, changes in content and analysis were incorporated into released products to enhance the understanding of the pandemic's effects on various census topics.
In addition to these adjustments, the Census Program also continued its pursuit of innovation through research and development, as well as the implementation of new and existing innovation projects aimed at maintaining a high level of data quality, supporting data relevance, achieving a high response rate, reducing respondent burden, and improving efficiency and cost-effectiveness. Innovations occurred in all stages of the 2021 Census, from content determination to dissemination.
The evaluation was conducted in accordance with the Treasury Board Policy on Results and Statistics Canada's Risk-based Audit and Evaluation Plan (2023/2024 to 2027/2028). The objective of the evaluation is to provide credible and neutral information on the ongoing performance of the Census of Population and to identify potential areas to consider for the next census cycle. The scope of the evaluation focused on the key innovations from the 2021 Census of Population and the lessons learned from these innovations to inform continuous improvement within the Census Program and the broader agency.
The evaluation methodology consisted of a document review, interviews and an internal survey. Interviews were conducted with representatives from the Census Program, subject-matter areas and other partners within Statistics Canada. The survey was sent to directors. The findings outlined in this report are based on the triangulation of these data collection methods.
Key findings and recommendations
The 2021 Census introduced a spectrum of innovations and process improvements, ranging from small advancements building on past successes to important breakthroughs. With the onset of the COVID-19 pandemic, additional changes were implemented to help mitigate risks. Overall, the innovation activities contributed to the high performance of the 2021 Census and achievements in operational efficiency and effectiveness.
Notwithstanding the significant challenges introduced by COVID-19, the pandemic was an impetus for rapid and breakthrough change within the program. Building on the momentum of COVID-19, leveraging success factors (e.g., buy-in, dedication, strong governance and project management) and learning from challenges (e.g., rigid timelines, last-minute changes, unanticipated complexities) will support the Census Program going forward.
The Census Program has effective debriefing and governance mechanisms to support the identification of best practices and lessons learned at the end of each cycle. Guided by these activities, Census Project Team has a defined vision for 2026 and is already working on improving its processes. Some felt that the post-cycle debriefings could be improved by enhancing communication across project teams and key stakeholders to support awareness of the next steps, and by focusing on a more continuous documentation of lessons learned across the cycle to ensure the timely identification and planning of innovations for the next census. More broadly, staff reported barriers to moving from innovative ideas to execution. The formalization of Census Futures is expected to help the program to overcome some of the barriers to engaging in long-term innovation planning.
Across the agency, there are some mechanisms for knowledge exchange between the Census Program and other areas, both formally and informally. Generally, the Census Program is seen as a driver for innovation within the agency, as investments in new processes and tools can be leveraged for wider benefit. However, representatives within and outside the program agreed that learning across the agency could be improved. This could include exploring structured and dedicated forums for innovation sharing and investigating opportunities such as employee rotations, innovation-focused communities of practice and learning symposiums.
Considering these findings, the following recommendations are proposed:
Recommendation 1
The Assistant Chief Statistician (ACS) of Census, Regional Services and Operations (Field 7) should ensure continued support of the activities of the Census Futures subproject to facilitate the timely advancement of long-term and breakthrough innovation projects.
Recommendation 2
The ACS of Field 7 should ensure that mechanisms for the continuous and ongoing documentation of lessons learned throughout the census cycle are explored to support the timely identification and planning of innovations for the next cycle.
Recommendation 3
The ACS of Field 7 should ensure that internal communication around decisions on innovations and improvements is enhanced so that all stakeholders are aware and interdependencies are understood.
Recommendation 4
The ACS of Field 7, in collaboration with other ACSs, should ensure that mechanisms are explored to further support knowledge exchange between the Census Program and other parts of the agency regarding innovation activities (in both directions).
Acronyms and abbreviations
ACS
Assistant Chief Statistician
BT
Behavioural test
CCPT
Combined Census Project Team
CIIR
Census Innovation and Improvement Register
CIRC
Census Innovation Review Committee
CPT
Census Project Team
CPTP
Census Program Transformation Project
CSC
Census Steering Committee
CSMS
Census Subject Matter Secretariat
CSU
Collection Support Unit
E&I
Edit and imputation
EQ
Electronic questionnaire
IRCC
Immigration, Refugees and Citizenship Canada
IT
Information technology
NRFU
Non-response follow-up
R&D
Research and development
REQM
Research, Evaluation and Quality Management
What is covered
The evaluation was conducted in accordance with the Treasury Board Policy on Results and Statistics Canada's Risk-based Audit and Evaluation Plan (2023/2024 to 2027/2028). The objective of the evaluation is to provide credible and neutral information on the ongoing performance of the Census of Population and to identify potential areas to consider for the next census cycle.
The Census of Population
Statistics Canada has the legal obligation to conduct a Census of Population every five years. The census provides a statistical portrait of Canada and its people, covering various demographic and social topics. The statistical information produced by the Census Program supports the measurement of the changes occurring in the demographic, social and economic characteristics of Canadians. It also supports a variety of statutory, legislative and regulatory requirements. The information is used by a wide range of organizations, such as various levels of government, not-for-profit and private organizations, and academic institutions, as well as by individual Canadians.
Census information is collected through mandatory short-form and long-form questionnaires. The short-form questionnaire, containing a basic set of questions, is distributed to all households, whereas the long-form questionnaire, containing the full set of questions, is distributed to a sample of households. Some information also continued to be collected directly from administrative records, such as tax data for income-related variables from the Canada Revenue Agency, and admission category and applicant type information from Immigration, Refugees and Citizenship Canada (IRCC). In 2021, for the first time, records from IRCC were also used for immigrant status and year of immigration.
2021 Census cycle
The 2021 Census of Population was Canada's 23rd national census. The COVID-19 pandemic emerged in Canada in early 2020 and affected all steps of the 2021 Census process, from data collection to dissemination. In light of this, the Census Program undertook an extensive review of its operations to adjust plans and procedures to ensure the continuity of census activities while protecting the safety of all Canadians and its employees. This included, among others, focusing on contactless approaches (e.g., electronic questionnaire [EQ] and telephone follow-up), revising engagement and communication efforts, and introducing remote work.
The 2021 Census cycle also covered a broader range of topics and included new and revised content, including instruction in the minority official language, a modified question on sex at birth, a new question on Canadian military experience, updates to ethnic or cultural origins, new labour questions addressing underemployment, updated terminology related to Indigenous peoples, and new questions on membership within a Métis organization or Settlement and enrolment under an Inuit land claims agreement. Moreover, changes in content and analysis were incorporated into released products to enhance the understanding of the pandemic's effects on various census topics.
In addition to these adjustments, the Census Program also continued its pursuit of innovation through research and development (R&D), as well as the implementation of new and existing innovation projects aimed at maintaining a high level of data quality, supporting data relevance, achieving a high response rate, reducing respondent burden, and improving efficiency and cost-effectiveness. Innovations occurred in all stages of the 2021 Census, from content determination to dissemination.
Ongoing improvements and innovations
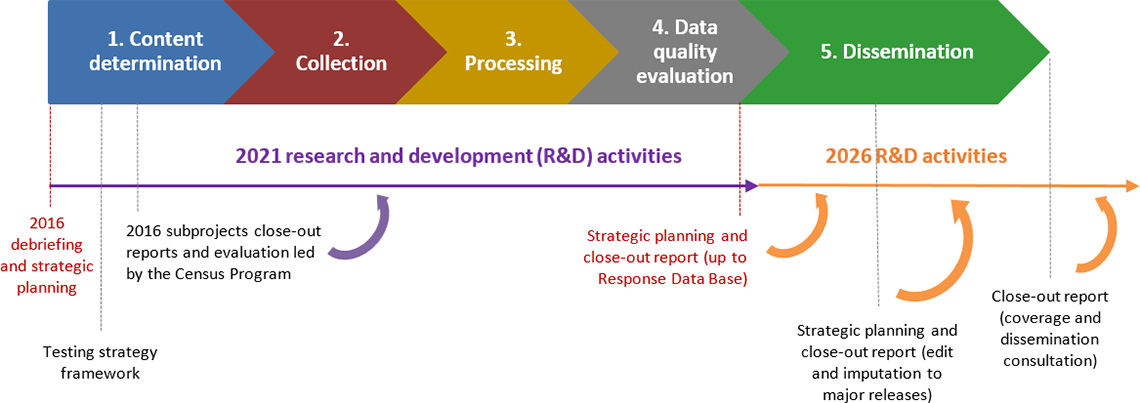
A key strength of the Census Program is its strong attention to critical inquiry and the identification of best practices and areas for improvement in subsequent cycles. At the end of each cycle, the Census Program undertakes a comprehensive review of all program elements to identify lessons learned and areas for improvement. As depicted in Figure 1, this exercise involves a multi-step evaluation, reporting and debriefing process leading to key decisions on innovation priorities for subsequent cycles. The exercise is overseen by the Census Project Team (CPT) and the Census Steering Committee (CSC).
Figure 1 Census cycle and ongoing improvement processDescription - Figure 1 Census cycle and ongoing improvement process
Figure 1 depicts the Census cycle and ongoing improvement process with a timeline featuring five key phases:
Phase 1: Content Determination
Activities in this phase included:
Debriefing and strategic planning in 2016
Testing strategy framework
Close-out reports and evaluations of 2016 subprojects led by the Census Program
Phase 2: Collection
Phase 3: Processing
Phase 4: Data Quality Evaluation
Activity in this phase included:
Strategic planning and close-out report (up to Response Data Base)
Phase 5: Dissemination
Activities in this phase included:
Strategic planning and close-out report (edit and imputation to major releases)
Close-out report (coverage and dissemination consultation)
The 2021 Research and Development activities were conducted between the 2021 Phase 1 Content Determination phase and the 2021 Phase 4 Data Quality Evaluation
The 2026 Research and Development activities started during the 2021 Phase 5 Dissemination step and will be ongoing for the rest of 2026.
The CSC and its operational subcommittee, the CPT, are cross-divisional and cross-field governance structures that provide overall direction to the census. The CSC reports to the Strategic Management Committee, the senior governance body at Statistics Canada, and is made up of senior officials within the Census Program.
Led by the Director General of the Census Management Office, the CPT reports to the CSC and is a decision-making and managing body for the Census Program. The CPT also comprises subproject managers who are each responsible for different areas and aspects of the Census Program (e.g., Census Subject Matter Secretariat [CSMS]; Research, Evaluation and Quality Management [REQM] Project; Census Futures). Through these debriefing and governance mechanisms, key decisions are made regarding planned innovations for the next cycle or thereafter based on an assessment of factors, including feasibility, priority, scope and risk.
The evaluation
The scope of the evaluation focused on the key innovations from the 2021 Census of Population and the lessons learned from these innovations to inform continuous improvement within the Census Program and the broader agency.
For the purposes of the evaluation, key innovations were defined as those identified following the 2016 Census cycle, developed through business cases by subproject teams and approved for the 2021 Census cycle. Innovations implemented to mitigate the risks related to the COVID-19 pandemic were also considered. Appendix B provides the list of the 2021 Census key innovations included in the scope of this evaluation.
The evaluation issues and questions that were identified for the evaluation are the following:
1. Performance of 2021 Census innovations
1.1 To what extent did key innovations of the 2021 Census of Population cycle contribute to its overall performance (efficiency and effectiveness)?
1.2 What factors facilitated and impeded the implementation of key innovations for the 2021 Census of Population cycle?
2. Lessons learned and continuous improvement
2.1 To what extent are the identified best practices and lessons learned from key innovations leveraged to support continuous improvement within the Census of Population Program?
2.2 To what extent are the best practices and lessons learned from innovations shared and leveraged between the Census of Population Program and the broader agency
The evaluation was conducted from September 2023 to March 2024.
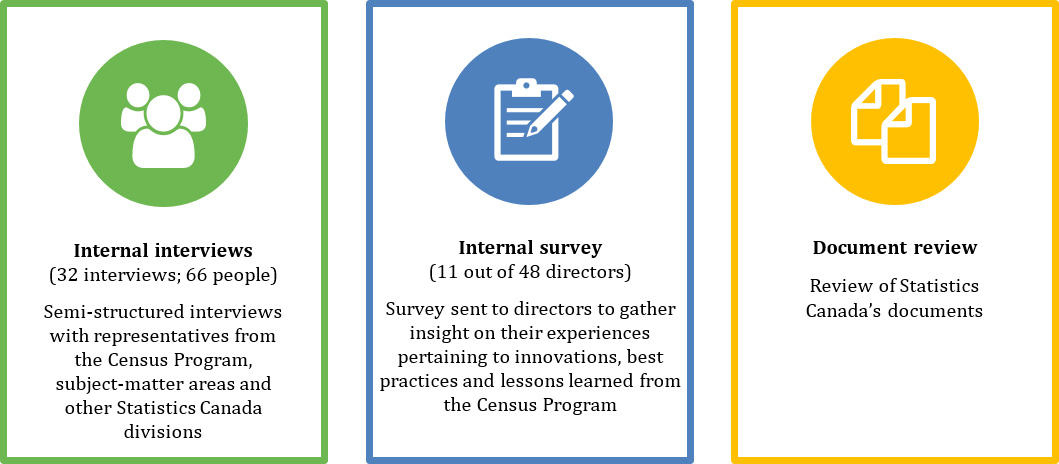
The data collection methods outlined in Figure 2 were used. The findings outlined in this report are based on the triangulation of these data collection methods.
Figure 2 Data collection methodsDescription - Figure 2 Data collection methods
Figure 2 depicts the three data collection methods used for the evaluation: internal interviews, internal survey, and document review.
The internal interviews included semi-structured interviews with representatives from the Census Program, subject-matter areas and other Statistics Canada divisions. There were 32 interviews conducted with 66 people.
An internal survey was sent to directors to gather insight on their experiences pertaining to innovations, best practices and lessons learned from the Census Program. 11 out of 48 directors responded to the survey.
The document review included a review of Statistics Canada's files and documents.
Limitations were identified and mitigation strategies were employed, as outlined in Table 1.
Table 1 Limitations and mitigation strategies
Limitations
Mitigation strategies
Self-report bias can occur in interviews, where individuals reporting on their own activities (i.e., innovations) may portray them in a more positive light.
To the extent possible, feedback and reflections on innovation activities were sought from a range of individuals who were familiar with or affected by the innovation. A review of program documents also supported a balanced perspective.
The internal survey had a low response rate (11 out of 48). Thus, survey responses may not be fully representative of the perspectives of other divisions within Statistics Canada.
The evaluation included interviews with divisional representatives to increase the coverage of data collection. Respondent-driven sampling was also used to gather additional suggestions and maximize reach.
Given that the timing of this evaluation coincided with the completion of debriefing and evaluation sessions for earlier phases of the 2021 Census cycle (i.e., up to Response Data Base), the evaluation may have an overall bias to innovation activities in the collection phase.
The evaluation gathered recommendations and context on innovation activities that occurred in later stages of the census cycle. The semi-structured format of the interviews also allowed for the identification of other innovation activities that may not have been captured through the available documentation.
The COVID-19 pandemic had a significant overall effect on the 2021 Census (positive and negative); however, some challenges were encountered in attributing the effects of COVID-19.
Findings were triangulated across multiple sources where possible. Where there was uncertainty regarding the effects or attribution of COVID-19, findings were reported in a way that suggested contribution but did not assume cause.
What we learned
1. Performance—2021 Census key innovations
Evaluation question
1.1 To what extent did key innovations of the 2021 Census of Population cycle contribute to its overall performance (efficiency and effectiveness)?
Description of the key innovations introduced in the 2021 Census, including their goals and rationale.
Documented and perceived achievement of efficiency gains in the 2021 Census cycle attributable to the key innovations.
Documented and perceived effectiveness of the 2021 Census cycle attributable to the key innovations.
Summary
The 2021 Census introduced numerous innovation activities to build on lessons learned and best practices following the 2016 cycle, to mitigate against the effects of the COVID-19 pandemic, and to enhance performance (effectiveness, efficiency). Overall, there were achievements in operational efficiency (e.g., decreased unit costs, improved self-response, improved coding efficiency) and in overall effectiveness of the census (e.g., maintained data quality, improved data relevance, achieved response rate target) as a result of innovation activities.
Following the 2016 Census, a suite of research and innovation items was identified for consideration and possible implementation for the 2021 Census cycle to support the achievement of census priorities (i.e., efficiency, effectiveness).
The debriefing and strategic planning sessions held at the end of the 2016 Census cycle gave rise to 18 outstanding items (research items), which were action items assigned to a subproject lead for further research or inquiry in response to recommendations or identified areas of interest. Following subsequent reviews, most of these research items advanced to development, alongside the identification and investigation of additional ones, all leading up to the 2021 Census cycle.
These research items culminated into a spectrum of innovations and process improvements introduced in the 2021 Census, ranging from small advancements building on past successes to breakthrough changes. According to the REQM Project, they can be broadly categorized under three types of innovation:
Incremental: Leverages existing processes and systems, has a clear benefit and can be implemented rapidly (e.g., wave methodology, mail-out expansion, optimization of the Collection Support Unit [CSU] operators).
Strategic: Requires higher effort and supports achievement of program objectives or drivers (e.g., data quality indicators, machine learning).
Breakthrough: Requires extraordinary effort, signifies a paradigm shift and is the source of further innovation (e.g., administrative data contingency plan, COVID-19 adjustments).
For the 2021 cycle, the key innovation drivers were to improve efficiency and cost-effectiveness; maintain or improve the timeliness of census releases; reduce respondent burden; maintain coverage, relevance and high data quality; and reduce reliance on paper in favour of electronic media.
Additional changes were introduced to the 2021 Census to address the challenges posed by the COVID-19 pandemic.
At the onset of the COVID-19 pandemic (spring 2020), the Census Program undertook an extensive risk analysis of the anticipated effects of COVID-19, resulting in a single plan with the assumption that the 2021 Census would be conducted in a pre-vaccine context. The plan was approved by the Chief Statistician and focused on minimizing in-person contact and maintaining data quality. The Census Program received additional funding to absorb costs related to COVID-19 (e.g., personal protective equipment, front-line worker salary, printing and shipping costs, information technology [IT] infrastructure). Among others, the COVID-19 pandemic led to the following rapid adjustments:
Expansion of EQs: Use of EQs was expanded to allow administrators of institutional collective dwellings (e.g., hospitals, nursing homes and residences, long-term care facilities) to complete their information online. Collective dwellings were also enumerated via telephone interview rather than in person.
Focus on self-response: The 2A-R paper questionnaire was redesigned to enable canvasser and reserve areas to self-respond (i.e., without administration from a canvasser completing in-person enumeration). To reduce in-person canvassing, the mail-out, mail-out with drop-off and list/leave collection modes were used.Footnote 1 More resources were deployed for telephone follow-up to reduce the number of in-person visits.
Introduction of remote work: IT infrastructure was expanded to support remote work, and census offices were used primarily as distribution facilities for field staff. Furthermore, training for staff was delivered virtually via Microsoft Teams and over the phone.
Administrative data contingency planning: A contingency data plan was developed with a focus on using administrative data to impute a limited number of characteristics of non-responding households after collection and under specific circumstances.Footnote 2
Several of the innovations introduced in the 2021 Census contributed to gains in efficiency and cost-effectiveness of the 2021 cycle.
Several of the 2021 innovations and process improvements contributed to operational efficiency across the cycle and helped the census to manage complexities introduced by COVID-19 (e.g., collection delays, staffing shortages).
Incremental improvements to census collection methodologies, including the 2021 wave methodology and the mail-out expansion, helped the census to achieve its goal of decreasing the unit cost per dwelling.Footnote 3 The revised wave methodology also contributed to an overall increase in the Internet self-response rate, from 68% in 2016 to 84% in 2021. This reduced the costs and processing required. The observed increase in online self-response was also likely driven by COVID-19 (i.e., rapid digital transformation), though it was impossible to quantify this effect.
With the large-scale implementation of the mail-out expansion, roughly 1 million former list/leave dwellings were converted to mail-out with drop-off, and this brought the overall level of the mail-out across the country to approximately 90%. A few regional interviewees stated that these changes led to some efficiency gains in field operations: list/leave areas were streamlined, fewer field staff were required for delivery, and the switch to a door-dropper invitation reduced the potential for error within the field.
For post-field activities, machine learning significantly improved coding efficiency, facilitating the coding of 31 questions and approximately 7 million write-in responses using fastText. Several interviewees highlighted machine learning's contribution in reducing the time, staff and costs associated with coding (approximately $4 million saved), while also unexpectedly helping to overcome hiring challenges caused by COVID-19.
Some interviewees also noted that pivoting to a virtual environment because of the COVID-19 pandemic led to operational efficiency, resulting in cost savings and improved collaboration (e.g., savings in travel time and the costs for recruitment and training, the use of platforms like Microsoft Teams). However, a few interviewees noted that the rapid implementation of virtual training via teleconference posed challenges, particularly in equipping field staff with technical knowledge. For the next cycle, interviewees recommended improving training through a hybrid approach (e.g., combining video-based onboarding and immersive in-person activities) to maximize effectiveness.
A few interviewees familiar with Meltwater found the social monitoring tool to be a more efficient approach to monitoring census communications, as it significantly reduced the time required to review a large volume of information.
Innovation activities contributed to the achievement of most key outcomes for the 2021 Census, including maintaining high data quality, supporting data relevance and achieving a high response rate.
Maintaining high data quality
The 2021 Census introduced process improvements and contingency planning to support the achievement of high-quality data.
The 2021 certification process was revised following data quality issues identified in 2016. Program reports and interviewees highlighted that the revised process introduced greater scrutiny, allowed for the identification of quality and comparability issues, and ensured that census products contained relevant information for data users (e.g., pandemic-related effects, limitations, comparability). New virtual consultation activities with external users were also reported to be a valuable opportunity to validate and discuss the data before their release.
The dissemination strategy for data quality indicators was revamped to allow data users to better assess the quality and relevance of the data as they relate to their needs. Although almost all interviewees stated that the uptake and overall utility of the quality indicators are not yet known, most of those familiar with this innovation reported that it was important for improving the transparency of census data quality and aligning it with data standards.
Considering the COVID-19 pandemic, the development and activation of the administrative data contingency plan supported the imputation of 12,000 non-responding households. While this represents a very small proportion of private dwellings (less than 0.1%), a few felt that the contingency plan was a proof of concept for the further use of administrative data to ensure data quality.
Supporting data relevance
A few interviewees familiar with changes to the census content explained that the content consultations conducted before 2021 helped the census to maintain data relevance, align with priority issues, and address identified gaps or informational needs (e.g., new variables for sex at birth and gender, minority language instruction, Métis membership, Canadian military experience). Some concrete examples of identified uptake included the following:
In the Federal 2SLGBTQI+ Action Plan 2022, census data were cited to support insights on population diversity (i.e., statistics on transgender and non-binary populations).Footnote 4
New content focused on education in the minority official language responded to recommendations in the House of Commons Standing Committee on Official Languages' 2017 report.Footnote 5 Interviewees within subject-matter areas reported that language of instruction data have been used by linguistic organizations, and their relevance is also indicated by recent Supreme Court decisions.
Achieving a high response rate
The 2021 Census achieved its overall national target response rate of 98%, including high provincial response rates,Footnote 6 a 97.4% long-form questionnaire total response rate and high levels of self-response. The census communications campaign and incremental improvements to the wave methodology were cited as two innovations that contributed to achievements in the response rate.
The census communications campaign used a mixed-media approach, which focused on promoting Internet response and targeting key audiences. Among the achievements in 2021, the campaign contributed to an approximately 22% increase in the online response rate of harder-to-enumerate audiences. The fine-tuning of the wave methodology was also highlighted by a few as contributing to the high response rate achieved in the census, as evidenced by high levels of self-response and online response.
It was not possible to fully account for the extent to which the COVID-19 pandemic influenced the response rate achieved in the 2021 Census (positively or negatively). Interviewees explained that there were some advantages to operating the census in a pandemic context as individuals were at home and perhaps more readily available to complete their questionnaire; however, the census also experienced difficulty in meeting some of its response targets (as predicted by the wave methodology). This may have been because of factors such as anti-government sentiment (i.e., related to COVID-19 lockdowns) and limited in-person collection. The 2021 Census had a lower response rate for some populations (roughly 85% of Indigenous communities and 70% of homeless shelter residents were enumerated). A few interviewees stated that this illustrated the challenges caused by COVID-19 and indicated that not all COVID-19-related adjustments were successful in mitigating all effects.
Decreasing respondent burden
The results for reducing respondent burden were mixed as the census implemented several content additions, which increased overall questionnaire length; however, some innovations helped to manage added burden. Looking ahead, more consideration of respondent burden is highlighted as a priority for the 2026 cycle.
The census leveraged administrative data through IRCC to introduce two new variables of interest (immigrant status and year of immigration), and this minimized the impact on questionnaire length given other content changes. As well, data from the Canadian Correctional Services Survey were used to replace collection in correctional institutions. Some interviewees expressed that there are opportunities for the census to continue to expand the use of administrative data, which can reduce costs, maintain data quality and avoid added burden (e.g., integration of data from the Canadian Housing Statistics Program).
In the 2021 Census, the ability to complete the census questionnaire online was expanded to include respondents of the 2A-R and collective dwelling questionnaires. A few interviewees indicated that access to the online questionnaire was positively received by remote, northern and Indigenous communities as it responded to complaints in 2016 (although connectivity can be a challenge). While the questionnaire content was the same, features such as automated skip patterns (i.e., skipping inapplicable questions) may have contributed to greater convenience for respondents.
The 2021 wave methodology and the COVID-19 collection adjustments focused on minimizing contact with respondents through a communication strategy that increased the level of self-response before the start of non-response follow-up (NRFU). Follow-up without contact was also implemented for private dwellings, and face-to-face interviews for collective dwellings were removed in 2021 because of COVID-19. The 2021 Census had a self-response rate of 88.1%, and approximately 84% of households completed the questionnaire online.
The 2021 Census communication strategy used behavioural and sociodemographic segmentation to help identify hard-to-enumerate audiences. This supported targeted communications to reach areas that are less predisposed to self-response while accounting for key characteristics in the design and execution of communication activities.
Evaluation question
1.2 What factors facilitated and impeded the implementation of key innovations for the 2021 Census of Population cycle?
Identification of factors that facilitated key innovations and the achievement of efficiency and effectiveness outcomes.
Identification of factors that hindered key innovations and the achievement of efficiency and effectiveness outcomes.
Identification of factors that could impact the implementation of key innovations for future census cycles.
Summary
The COVID-19 pandemic was a significant factor influencing innovations in the 2021 Census cycle as it presented complex challenges and provided an impetus for significant changes, leading to innovations that may not have been implemented otherwise. Strong buy-in and dedication from staff at all levels, rigorous testing activities, effective governance and project management, and collaboration efforts supported the implementation of various innovation activities and the overall success of the 2021 Census. At the same time, staff reported difficulties with rigid and planned timelines, COVID-19-related delays, high workloads, and system or technical constraints. Several emerging factors were identified that could impact innovations going forward (e.g., IT development resources, census and non-census alignment).
The COVID-19 pandemic introduced complex and evolving challenges and highlighted underlying factors that made the implementation of innovations successful in the 2021 Census.
The COVID-19 pandemic was highlighted by most interviewees as having a significant influence on innovation activities, both positive and negative. Release dates were firm, even though the census encountered COVID-19-related delays to collection activities, the cancellation of early enumeration, restrictions on travel and in-person activities, and unique and ever-evolving provincial and territorial public health restrictions. Managing these risks required the identification of creative and rapid solutions and highlighted the underlying success factors to the 2021 Census.
Numerous factors were outlined by interviewees as supportive to the implementation and overall success of innovations, especially in the context of COVID-19. The most reported contributors to success were the following:
Having buy-in from affected stakeholders: Interviewees explained that the census has many interdependencies, and one change can lead to multiple consequences and downstream effects for other subprojects and areas. Having buy-in and flexibility from key stakeholders (e.g., subject-matter areas, subprojects) and strong leadership from senior management in response to the pandemic was important to ensuring that changes were implemented successfully—particularly last-minute changes driven by COVID-19.
Implementing a formal test: Before each cycle, the census implements formal research and testing (i.e., a "dress rehearsal") at the program and subproject levels to assess feasibility, minimize risk, and verify the performance of new technologies and innovations. The findings from these activities are then presented to the CPT and the Data Quality Review Board for review and approval. Interviewees reported these testing activities as important to increasing confidence and preparation ahead of the 2021 cycle. Given the insights that testing activities can offer, some interviewees stated that they would like to see the testing activities expanded to include innovations and process changes later in the census cycle.
Strong governance and project management: The census effectively used governance structures, including the CPT and CSMS, to support overall coordination and decision making. A few interviewees highlighted that these structures worked well for discussing issues and staying informed on the progress of key projects. Given the unique context of COVID-19, attendance at CPT meetings was also expanded to allow for some census representatives to observe virtually. This was highlighted as a valuable opportunity for information gathering. The Census Program also used project management tools such as JIRA and the kanban method to manage workflow, coordinate activities, and track change requests and decisions (e.g., COVID-19 planning) leading up to and throughout the 2021 cycle.
Collaboration and dedication: Most interviewees highlighted that collaboration within the 2021 cycle was strong, and a few felt that collaboration had improved since the 2016 cycle (e.g., between subject-matter areas and methodology). Activities such as regular meetings and virtual platforms (e.g., Microsoft Teams, SharePoint) helped teams to navigate the learning curves of innovations, manage and communicate dependencies, and troubleshoot unforeseen challenges. For example, the development of the administrative data contingency plan was facilitated by strong integration and collaboration between the Census Futures subproject and other census teams. Census staff also emphasized that dedication across all levels of the program (e.g., senior management, operational staff, division partners) was instrumental in the achievement of census objectives against complex changes and unanticipated challenges.
Most interviewees reported that a lesson learned from the pandemic is that the pace of innovation within the census can change in extraordinary circumstances. While COVID-19 was a unique event for the census, leveraging the success factors and building on the momentum generated can help the program continue to advance significant and timely innovations.
Some barriers were encountered in the implementation of innovation activities in the 2021 Census because of COVID-19 and other factors.
Census staff and post-cycle debriefing reports pointed to some challenges in implementing innovations in 2021, which were primarily associated with the census schedule and timeline (i.e., not enough time allocated), unexpected COVID-19 delays, and higher-than-anticipated workload.
Lack of time within planned schedule: The most consistently reported challenge was managing innovations and new activities against rigid and tight timelines. Content innovations, certification activities and data quality indicators required more time than initially planned, and the existing schedule did not adequately accommodate the time required for process changes in machine learning. This was also exacerbated by COVID-19 delays. Census staff reported that tight timelines had a detrimental and domino effect on teams later in the cycle, as staff were required to process, analyze and disseminate a record amount of data; meet new dissemination deadlines; and adapt to new tools and processes (e.g., certification activities, new systems). This led to high overtime hours and stress among operational staff.
High volume of work: Some innovations were reported to have added a large volume of work among some teams that may not have been adequately planned and accounted for (and was exacerbated by having insufficient time). This was highlighted by a few staff involved with certification activities (e.g., time required for external consultations, presentation attendance), and with the new data quality indicators (e.g., doubling of work, repetitive and manual tasks, management of cell limits).
System and technical constraints: Practical challenges related to system and technical capacity hindered some projects. With the integration of question-level data quality indicators (i.e., confidence intervals), a corresponding tripling of data table size created practical limitations to developing tables. The transition to a new tabulation system involved limited integration with other census tools, leading to a duplication of efforts. Similarly, representatives familiar with machine learning described limitations in processing capacity, and system constraints were reported with the generation of more infographics and visuals (e.g., images) as part of The Daily releases.
Clarity around governance, roles and responsibilities: Some interviewees suggested that having a more defined lead in place at the outset of some projects may be beneficial to ensure activities can proceed efficiently and to avoid delays in decision making and confusion at the operational level (e.g., reported within the administrative data contingency plan, machine learning innovation). Interviewees also reported that key innovations such as the contingency plan were hindered by changing priorities among senior management as factors such as risk, public perception and data quality were balanced. Other subprojects, including edit and imputation (E&I) and dissemination, also noted that roles and responsibilities should be better defined for the 2026 cycle.
Three main factors were identified by interviewees as influencing innovations going forward: more census and non-census alignment of processes, lack of IT resources, and the changing data consumption patterns of users.
Looking ahead to the next census cycle, interviewees highlighted a few factors that may influence what types of innovations are prioritized and a possible risk to their development.
Increasing census and non-census alignment of processes: In accordance with Statistics Canada's strategic plan (One Plan),Footnote 7 some interviewees reported that there are increasing initiatives to align processes and systems between the census and other areas of Statistics Canada, including the New Dissemination Model and other corporate collection and processing systems (discussed further under evaluation question 2.2).
IT development resources: A few interviewees reported a lack of IT development resources and the inability to effectively recruit IT resources as a threat to 2026 and long-term R&D. As IT resources are often occupied with production and operation tasks, there is limited time for engagement in development activities.
Changing user consumption patterns: A few interviewees highlighted that the dissemination vehicles used by the census (e.g., The Daily) are "stuck in the print publication world" and have not kept pace with user preferences, such as infographics and other visual outputs. As well, it is important for the census to be aware of and responsive to changing technology, including the use of artificial intelligence to retrieve and synthesize information.
2. Lessons learned and continuous improvement
Evaluation question
2.1 To what extent are the identified best practices and lessons learned from key innovations leveraged to support continuous improvement within the Census of Population Program?
Documented and reported mechanisms to share and leverage the best practices and lessons learned from key innovations within the Census Program.
Perceived appropriateness and effectiveness of the mechanisms for sharing the best practices and lessons learned to inform and leverage innovations.
Evidence of the integration of the best practices and lessons learned from the 2021 Census in the planning and execution of future census cycles.
Perceived barriers and challenges to leveraging the best practices and lessons learned from key innovations.
Summary
The primary mechanism within the census to identify, share and leverage innovation opportunities occurs through a multi-stage evaluation and debriefing process. Overall, interviewees indicated that the process is effective for identifying and documenting findings (e.g., success factors, challenges, areas to innovate), with some noted suggestions for improvement. However, barriers are encountered in moving from idea to execution because of factors such as the limited time between cycles, the complexity and scope of the census, the loss of corporate knowledge, and resistance to change. To advance modernization efforts, the Census Futures subproject was formalized to help the program to engage in skip-cycle innovation R&D.
The Census Program has established rigorous processes, including evaluation mechanisms and governance, to facilitate the identification and incorporation of best practices and lessons learned.
Following the 2021 cycle, the Census Program launched once again its cyclical evaluation and debriefing process; subproject close-out reports detailing specific activities, objectives and lessons learned were developed and later reviewed by the CPT and the CSC. Two debriefing and strategic planning sessions focused on specific parts of the census cycle were also held, leading to key recommendations on where to prioritize efforts ahead of the 2026 cycle.
Most interviewees within the Census Program agreed that the census evaluation and debriefing activities are useful overall, well structured, and supportive for discussion and rigorous documentation. A vision for 2026 that sets to build on the successes of 2021 and provide a reference tool for staff has also been established.
At the operational level, census staff indicated that they are already working on measures to improve and adapt their processes (e.g., certification, machine learning, content innovations) based on findings from 2021, including the following:
reviewing the census schedule and plan for 2026 to ensure that enough time is allocated for workflow changes and to help reduce pressure for staff
finding opportunities to further streamline and automate processes to reduce manual and repetitive tasks (e.g., in certification, verification, E&I, the preparation of data tables)
reviewing census products and outputs with the highest influence and overall value to ensure innovation efforts are commensurate with user gains
improving consultation and early planning efforts to ensure that proposed changes are feasible and that the effects are well understood and minimized in advance (e.g., content changes, certification, collection activities, coding).
A few challenges and opportunities were shared by program staff to improve the census evaluation and debriefing process within the program:
Risk of low engagement and capacity: A few operational staff stated that the census evaluation activities follow an intense period in the cycle, and this may lead to low engagement and capacity to participate in activities (i.e., risking a "checkbox" approach). A few also commented that it can be difficult to reflect on experiences that occurred in earlier stages of the cycle if they are not adequately documented throughout.
Attention across the cycle: A few interviewees involved in later stages of the cycle (i.e., E&I to major releases) felt that the timing of the debriefing exercise may favour the identification of and investment in innovation activities in earlier stages of the cycle (e.g., collection-related innovations). Staff in later stages of the cycle may also not be adequately consulted on the corresponding impacts of the proposed changes to activities earlier in the cycle.
Communication efforts: Representatives of enabling divisions recommended that the Census Program improve communication following the debriefing exercise. Some regional office staff reported concerns as recommendations were shared across more than one cycle (e.g., improvement of training modules, changes to data tables) and stated that there was a lack of follow-up on whether and how their recommendations were explored within the program. Similarly, divisional representatives felt that their input on Indigenous-specific collection processes has not always been extensively considered.
Following the identification of innovation areas, some barriers are encountered in advancing the development of innovations, potentially leading to repeated processes and delays in implementation.
Interviewees highlighted that there are obstacles in the ensuing steps of actioning and developing innovations (i.e., moving from idea to execution). The most consistently reported challenge is the lack of time available to engage in development within a five-year cycle. Given immediate production tasks, about half of Census Program staff reported that it is difficult to prioritize innovation planning, particularly for long-term activities requiring complex change. As a result, the program has encountered delays in advancing breakthrough innovations between cycles, such as the introduction of handheld devices to field collection. Having limited time to develop and implement innovations is further hampered by the complexity and scale of the census. As there are numerous interdependencies to account for between activities, one change can have an unintended and chain effect on other processes, requiring considerable logistical planning.
Additional high-level barriers as outlined by interviewees included resistance to change and loss of corporate knowledge. Some census staff highlighted that there can be a reluctance to change processes and systems because of familiarity and their perceived relative effectiveness, despite opportunities afforded by innovations and technology (e.g., automation, artificial intelligence). Staff may also experience concern over effects on their processes and activities. Interviewees explained that staff rotations and a reduction in staff between cycles are common within the program. For example, staff in subject-matter areas may be moved to other program areas after census production. This can lead to missed opportunities to develop and implement lessons learned ahead of the next cycle, particularly if key takeaways are not documented before staff depart and new staff are moved to the program.
Alongside the anticipated role of Census Futures (outlined below), various suggestions were shared by interviewees to overcome innovation barriers. A few program staff who were familiar with change management techniques reported that the Census Program could focus on identifying change agents to socialize change and gain buy-in among key stakeholders. Some felt that the census could be improved by ensuring lessons learned and action items are consistently documented throughout the cycle to maintain a continuous outlook on new opportunities and retain corporate knowledge. For example, this could include a regular "pulse survey" or assigning personnel on each subproject team to regularly note challenges, areas to investigate and best practices that should be scaled. Lastly, some operational staff recommended that the census focus on improving internal communication across subprojects and with key stakeholders to ensure that proposed improvements are well understood and that all implications are assessed early on. For example, this could include engaging in submapping activities to build a common understanding of process changes and ensuring that working groups are consulting all affected teams.
The Census Futures subproject was formalized to enhance long-term planning and the development of major innovations.
A key change made within the Census Program is the formalization of the Census Futures subproject to support modernization efforts. It was originally named the Census Program Transformation Project (CPTP), which was launched in June 2016 with the two-fold mandate of creating the Statistical Register Infrastructure and researching a new "combined census" model that relies on administrative data. Building on its success in advancing research and methodological innovations for collection activities, the CPTP was transformed into Census Futures in March 2023 with the added responsibility of skip-cycle planning and long-term strategy development (i.e., priority items that cannot be managed in the period between cycles). Among areas of focus, the Census Futures subproject is continuing the long-term planning of increased use of administrative data and the replacement of paper forms with handheld devices.Footnote 8
Interviewees familiar with the subproject echoed that Census Futures plays an important role in helping the Census Program to advance priority innovations and overcome some of the known barriers to innovation development. While the project was only recently formalized, a few stated that the effects have already been demonstrated, including advancements in research and logistical considerations on the implementation of handheld devices. Given the required expertise from census operational staff and other key stakeholders in the planning and development of innovation activities (e.g., identifying logistical considerations, dependencies, feasibility and constraints), a few stated that it will be important that Census Futures has sufficient opportunities to integrate and collaborate with relevant staff.
Evaluation question
2.2 To what extent are the best practices and lessons learned from innovations shared and leveraged between the Census of Population Program and the broader agency?
Documented and reported mechanisms to share and leverage the best practices and lessons learned from innovations between the Census Program and the broader agency.
Examples of sharing and leveraging best practices and lessons learned from innovations between the Census Program and the broader agency, including their impacts.
Identification of opportunities to further share and leverage the best practices and lessons learned from innovations between the Census Program and the broader agency.
Summary
Overall, there was some evidence of knowledge exchange and uptake between the census and the broader agency. The Census Program plays an important role as a driver for innovation within Statistics Canada (e.g., investing in and improving systems and tools). At the same time, there are barriers to innovation sharing and uptake, including a lack of time for external networking, perceptions and attitudes, and a lack of awareness of innovation activities. Opportunities to formalize innovation sharing were identified, including dedicated working groups, regular presentations or other sharing forums, and improved circulation of documents.
Knowledge exchange between the Census Program and other parts of the agency occurs through formal and informal mechanisms.
Various forums can support knowledge exchange between the census and other Statistics Canada divisions and programs. Based on survey findings and interviews, structured mechanisms for being kept informed include census governance structures (e.g., CSC, CPT, CSMS), collaboration and service meetings (e.g., field debriefs; meetings with other survey areas, IT, communications, methodology), and participation in committees and working groups. A few representatives outside the Census Program also reported referencing census documents to learn about activities and findings from the previous cycle (e.g., project or program close-out reports).
Alongside structured approaches, approximately half of all interviewees stated that informal knowledge exchange, such as casual discussions with colleagues, was a common approach to learning about innovation activities and best practices in other areas of the agency; however, with the increased reliance on virtual working environments, opportunities for informal conversations are less common. Staff who move to other areas of the agency also help facilitate the cross-pollination of ideas and processes.
Some interviewees within the Census Program reported having touchpoints with other federal departments (e.g., Employment and Social Development Canada, Health Canada) and through international census forums to share best practices. A few census staff felt that they were more engaged in discussions outside the agency than through internal mechanisms.
Cross-agency knowledge exchange has led to some awareness of and uptake in innovation activities.
Sharing census innovations across Statistics Canada
Most interviewees positioned the Census Program as a driver for innovation across the agency. With greater resources available, census investments in processes and systems can be leveraged for overall benefit within Statistics Canada. For example, the introduction of the new Field Management SystemFootnote 9 within the Census Program was later expanded to other program areas, generating cost savings and streamlining processes. Specific examples of sharing best practices and lessons learned from 2021 Census innovations included the following:
Presentations and workshops on topics such as the use of segmentation in the census communications campaign and the application of machine learning to other survey areas were delivered to other areas of the agency. Discussions with some program areas (e.g., Labour Force Survey) have also arisen to share and harmonize processes in coding.
Subject-matter areas have harmonized variables and concepts introduced in the census with other survey areas (e.g., COVID-19-related income variables, content innovations).
Divisional representatives surveyed stated that they considered integrating the lessons learned from administrative data imputation in the 2021 Census and census collection processes (e.g., wave methodology, communication strategies, follow-up operations).
Methodology areas have collaborated through symposiums and communities of practice, focusing on topics such as machine learning coding and the use of quality indicators.
Leveraging Statistics Canada innovations and best practices within the census
With a greater focus on aligning census and non-census processes, the 2021 Census was marked by the integration of several corporate tools, such as the Common Output Data Repository, TestRail, Power BI, G-code and the New Dissemination Model. A few interviewees within the census noted that while streamlining systems has an overall benefit for the agency (e.g., cost savings, optimization of processes), it can be challenging for the census to adopt corporate systems when they are not developed to fit the parameters of the census at the outset. For example, the transition to the New Dissemination Model and G-code required additional expenditures and led to delays in their adoption as the systems required enhancements to meet the needs of the Census Program.
In addition to the integration of corporate systems within the census, subject-matter representatives reported bringing new ideas and practices to the 2021 Census based on lessons and techniques developed from other survey areas (e.g., surveys conducted more frequently). This included the modernization of data tables and charts and the migration of income linkages.
Most agreed that learning across the agency is impeded by factors such as a lack of awareness, time constraints and attitudinal beliefs.
Most agreed that learning between the Census Program and other parts of the agency could be improved. For example, census staff felt that processes and tools developed within the census (e.g., automation, coding, collection methodologies) could help other program areas to increase efficiencies and overcome challenges such as declining response rates. Similarly, interviewees from other Statistics Canada divisions stated that the census could learn more from surveys that are conducted more frequently. For example, other survey areas could provide insights on respondent behaviour and other contextual factors that could influence the next census. Innovative approaches that are introduced in other survey and program areas can also reduce risk and increase confidence for implementation in the Census Program (i.e., opportunity to "test the waters").
Nevertheless, awareness of innovation activities appears to be low across the agency. Based on the results of the internal survey that was distributed to all Statistics Canada's directors, most respondents reported that they had not integrated, or considered integrating, any innovations, best practices or lessons learned from the 2021 Census, and most indicated that they were not aware of 2021 innovations. The overall low response rate to the internal survey (23%) further suggests that knowledge is low. A few interviewees also described the duplication of processes and systems as evidence of limited awareness (e.g., some software tools have been unknowingly purchased twice), and one interviewee noted that the census has invested in the development of some tools with the intention of broader corporate use, though not all divisions have agreed to use them (instead developing a new tool for their own use).
Several factors were described by interviewees as limiting awareness and the uptake of innovations. Some highlighted that there is an absence of a formalized or strategic approach to sharing innovations across Statistics Canada, such as an agency-wide innovation committee (i.e., a "top-down" approach). Other barriers identified in interviews and the survey include the following:
Lack of time: Interviewees emphasized that high workloads and immediate priorities within the Census Program can limit the extent to which census staff can readily engage in outside networking. Similarly, representatives from other divisions agreed that time constraints can hinder their ability to participate in forums and incorporate new processes and tools.
Insufficient knowledge transfer: A few interviewees explained that innovation activities may be shared with staff who have differing levels of technical familiarity with a given subject or approach, and that the Census Program tends to communicate information with census-specific language and terminology. Because of this, there may be less understanding of the possible applications of innovation activities, and the information may not be relayed at the operational level.
Perceptions and attitudes: Interviewees inside and outside the Census Program agreed that attitudinal factors can greatly influence interest in innovations occurring in other areas of the agency. The census can be perceived by other program areas as a more complex, higher-priority and better-resourced program. Because of this, other programs may feel fatigue and have limited interest in learning about census activities. There can also be a reluctance to abandon existing processes and systems in favour of those used by the census. In the other direction, the census may not embrace all learning opportunities, as they are not perceived as relevant given the complexity and scale of the program.
Incompatible processes and practical constraints: Other common factors hindering the ability to incorporate census innovations include having a limited workforce, incompatible systems and processes, and budget constraints.
Awareness and information exchange could be improved through a multi-faceted approach.
Interview discussions highlighted that a multi-faceted approach is required to address the barriers to knowledge exchange, as there are practical factors (e.g., time, capacity) and broader challenges (e.g., attitudes, beliefs). Among the suggestions, introducing a more formalized and structured mechanism that supports objective and open dialogue (i.e., avoiding one program overshadowing another) could increase awareness across the agency. A few interviewees noted that an innovation working group committee had previously been in effect and that reinstating such an approach would also align with the broader objectives of the One Plan. For example, a structured forum could support the identification of where census and non-census processes and tools can be further aligned, benefitting the broader agency (i.e., leveraging best practices) while potentially generating cost savings.
Other recommendations that could target staff at the operational and management level were also shared:
Improve the dissemination of census documents (e.g., census close-out reports, innovation documents, Census Futures reports) across the agency (e.g., at field debriefings, in committees, in forums) to increase awareness of census activities.
Increase opportunities to participate in focused communities of practice with a mandate of sharing best practices and lessons from innovations (e.g., in collections, methodology, dissemination).
Reinstate optional knowledge exchange activities, such as "lunch and learns" or other regular presentation forums.
Encourage opportunities for employee rotation between the Census Program and the rest of Statistics Canada to build awareness of practices and processes across the agency and to transplant knowledge.
How to improve the Census Program
The most cited barrier to advancing innovation within the census is the inability to engage in long-term planning and development activities given the immediate operational priorities within the program. Furthermore, interviewees highlighted the limited time for innovation development within a five-year cycle. The work of the Census Futures subproject could help the program in overcoming these barriers and should continue to be supported.
The timing of the census evaluation and debriefing exercise follows an intense period within the cycle. Interviewees reported that the lessons learned and recommendations identified in earlier stages may be missed in the absence of ongoing documentation or mechanisms for feedback. Given the limited timeframe between cycles, identified opportunities for innovation may already be considered too late for research and implementation. Ensuring mechanisms are in place for ongoing feedback and documentation can help streamline innovation planning and avoid missed opportunities.
Interviewees involved with the census reported that internal communication could be improved. Some subproject teams also stated that communication could be strengthened when innovations and process improvements are being introduced in other areas of the census cycle to avoid unforeseen and downstream effects. Identifying mechanisms that can provide updates on proposed changes and support adequate consultation can improve preparation for the next cycle.
While the Census Program is generally seen as a driver for innovation within the agency, representatives within and outside the program agreed that learning across the agency could be improved. This could include exploring structured and dedicated forums for innovation sharing and investigating opportunities such as employee rotations, innovation-focused communities of practice and learning symposiums.
Recommendation 1
The Assistant Chief Statistician (ACS) of Census, Regional Services and Operations (Field 7) should ensure continued support of the activities of the Census Futures subproject to facilitate the timely advancement of long-term and breakthrough innovation projects.
Recommendation 2
The ACS of Field 7 should ensure that mechanisms for the continuous and ongoing documentation of lessons learned throughout the census cycle are explored to support the timely identification and planning of innovations for the next cycle.
Recommendation 3
The ACS of Field 7 should ensure that internal communication around decisions on innovations and improvements is enhanced so that all stakeholders are aware and interdependencies are understood.
Recommendation 4
The ACS of Field 7, in collaboration with other ACSs, should ensure that mechanisms are explored to further support knowledge exchange between the Census Program and other parts of the agency regarding innovation activities (in both directions).
Management response and action plan
Recommendation 1
The ACS of Field 7 should ensure continued support of the activities of the Census Futures subproject to facilitate the timely advancement of long-term and breakthrough innovation projects.
Management response
Management agrees with the recommendation.
In the 2023/2024 fiscal year, Census Futures was established as a subproject of the Census of Population, with an associated high level of visibility within the project structure of the census.
A new Combined Census Project Team (CCPT), reporting to the CSC, will begin in the first quarter of 2024/2025 to provide governance over the main research activities of the Census Futures subproject and prepare for a 2027 decision about whether to transform the 2031 Census to a hybrid administrative and traditional census.
Other Census Futures research (i.e., priority "breakthrough" innovations) will be governed at CPT and Field 7 Planning Board meetings, starting in the first quarter of 2024/2025.
Deliverables and timelines
Implement the new CCPT, including its terms of reference, in April 2024.
Recommendation 2
The ACS of Field 7 should ensure that mechanisms for the continuous and ongoing documentation of lessons learned throughout the census cycle are explored to support the timely identification and planning of innovations for the next cycle.
Management response
Management agrees with the recommendation.
In the second quarter of 2024/2025, a new subcommittee of the CPT, the Census Innovation Review Committee (CIRC), will be created to oversee the establishment and ongoing development of the Census Innovation and Improvement Register (CIIR):
The CIRC will be responsible for updating the register using predetermined criteria (defined and approved by the CPT) to review and classify the lessons learned proposed by subprojects or other entities (e.g., regional offices) and to suggest additional items.
The CIRC will be responsible for reviewing and classifying the lessons learned as they arise during the cycle.
The CIRC will report to the CPT on updates and seek approval for new items, movement through some stages and gates, and any significant changes required throughout the cycle.
In the second quarter of 2024/2025, an evergreen CIIR will be established and maintained.
Each item on the register will include the lessons learned, the approval status, the target cycle of implementation, the type of innovation, etc.
The register is a new product, not cycle-specific, leveraging existing census and corporate tools.
The register will be accessible to all census staff and stakeholders at any time.
Deliverables and timelines
Implement the new CIRC, including its terms of reference, before July 2024.
Establish the first register before September 2024.
Recommendation 3
The ACS of Field 7 should ensure that internal communication around decisions on innovations and improvements is enhanced so that all stakeholders are aware and interdependencies are understood.
Management response
Management agrees with the recommendation.
The evergreen CIIR will contain the latest information, such as the stage and status, allowing any Statistics Canada staff to consult the register for information on innovations, improvements and interdependencies.
The CIIR will include the following items:
lessons learned associated with the creation of an item or rationale
the date the item was added
CPT or CSC approval status
the target cycle of implementation (current, next, skip-cycle)
the subproject leading the elaboration and implementation
the type of innovation (incremental, strategic, breakthrough)
the origin of the innovation (census, corporate, etc.)
the stage (elaboration, development, implementing, implemented)
the status (standby, ongoing, completed)
interdependencies
a link to the innovation's GCdocs main directory
the date of implementation.
The CIRC will present updates to the CPT and seek approval of new items added to the register.
The CIIR will be presented to the Field 7 Planning Board and the CSC.
Deliverables and timelines
Present the CIIR to the CPT before October 2024.
Present the CIIR to the Field 7 Planning Board and the CSC before December 2024.
Recommendation 4
The ACS of Field 7, in collaboration with other ACSs, should ensure that mechanisms are explored to further support knowledge exchange between the Census Program and other parts of the agency regarding innovation activities (in both directions).
Management response
Management agrees with the recommendation.
Divisional innovation champions will be named and will form a Field 7 committee that will develop the Field 7 Innovation and Improvement Register and will report to the Field 7 Planning Board.
The CIIR will be shared and used to facilitate communication with other parts of the agency:
The register will be shared with the Field 7 Planning Board and will form part of the broader Field 7 Innovation and Improvement Register planned for late 2024/2025.
This Field 7 register will be shared with other fields.
Linkages between census and corporate innovations will be sought, for instance, through participation by the Director of the Census Operations Division at the Enterprise Architecture Review Board.
Deliverables and timelines
Implement the Field 7 Innovation and Improvement Committee, including its terms of reference, before December 2024.
Build the initial Field 7 Innovation and Improvement Register integrating the CIIR before March 2025.
Appendix A Interview quantification scale
Interview responses are quantified and categorized in this report using the scale shown in the table below.
Interview quantification scale
Term
Definition
One
The term "one" is used when one participant provided the answer.
A few
The term "a few" is used when 4% to 15% of participants responded with similar answers. The sentiment of the response was articulated by these participants but not by the other participants.
Some
The term "some" is used when 16% to 45% of participants responded with similar answers.
About half
The term "about half" is used when 46% to 55% of participants responded with similar answers.
Most or a majority
The terms "most" or "a majority" are used when 56% to 89% of participants responded with similar answers.
Almost all
The term "almost all" is used when 90% to 99% of participants responded with similar answers.
All
The term "all" is used when 100% of participants responded with similar answers.
Appendix B 2021 Census innovation activities
2021 Census innovation activities
Innovation
Overview
2021 wave methodology
To increase Internet response rates, improve data quality and reduce NRFU costs, several changes and improvements were explored to enhance the wave methodology for 2021. The main changes were the new wave materials for wave 3 (mail-out) and wave 1 (non-mail-out), which were developed and tested during behavioural test (BT) 3 and BT4. BT4 results clearly demonstrated that sending a wave 3 reminder letter in an envelope would likely result in higher EQ responses and thus reduce NRFU volume. Another significant difference in 2021 was the decision to deliver a door-dropper invitation (instead of a questionnaire) to all list/leave and drop-off dwellings in 2021. Additionally, text or voice broadcasts or email reminders were sent following the wave 3 letters and before the start of NRFU activities.
Optimizing the use of CSU operators
This initiative was intended to explore ways in which CSU operators could be integrated into the inbound call processes and work more closely with the Census Helpline to potentially pick up questionnaire completion calls from the Census Helpline queue to permit the handling of more calls. Other considerations were to assign a higher proportion of NRFU cases to be resolved by the CSU while maintaining efficient collection operations. The virtual call centre technology used to deliver the telephone infrastructure allowed the CSU call lines to be integrated with the Census Helpline, and CSU tasks were expanded to assist with several operations in addition to NRFU in 2021.
Mail-out expansion
The mail-out expansion was established using a new collection methodology that helped increase the number of mailable dwellings in Canada by combining mail-out and drop-off activities in specific collection units. The mail-out with drop-off methodology was first tested in 2016 and again during the 2019 BT (BT3). This methodology was implemented on a large scale for the 2021 Census, converting roughly 1 million former list/leave dwellings to mail-out with drop-off, of which approximately 75% were mailed, bringing the overall level of mail-out across the country to approximately 90%.
Data quality indicators for users (including the dissemination strategy of quality indicators)
The census subject-matter quality measurement team implemented a new plan for data quality indicators disseminated for the 2021 Census. The main data quality indicator for the global non-response rate released in 2016 was replaced with a geographic area-level total non-response rate. The question-level non-response rate and the imputation rate were provided in separate data tables for low levels of geography, such as the census subdivision, and variance-based confidence intervals were also implemented.
For the 2021 Census of Population, the dissemination strategy of quality indicators was completely revamped, with the aim of providing more detailed information about data quality and not performing data suppression for quality reasons (a new approach for the Census Program). New quality indicators are included with the data products (at the census-question level and for various geographical levels), helping users better assess data quality and determine how well the available information meets their needs.
Administrative data contingency plan
The statistical contingency plan was developed with a focus on a strategy to impute limited characteristics (number of usual residents, date of birth, sex at birth) of non-responding households using administrative data after collection and only in case of natural disaster or if enumeration is severely impacted.
Administrative data linkages
Administrative data were used to increase content for the immigration topic on the 2021 Census. Two new variables, immigrant status and year of immigration, were added using administrative files provided by IRCC. All income variables, immigration admission category and applicant type were also obtained directly from administrative records. Data from the Canadian Correctional Services Survey were used to replace collection in correctional institutions, contributing to a reduction in respondent burden.
COVID-19 adjustments
In the spring of 2020, an extensive review was conducted to assess the risks and impacts to the 2021 Census should COVID-19 continue or re-emerge. A detailed plan was formulated with three main goals: minimize face-to-face contact and movement of staff, emphasize self-response with the expansion of EQs, and increase telephone NRFU. Early enumeration was cancelled, and canvasser activity was also replaced with list/leave and the offer of an EQ option. A "no dwelling entry" approach and personal protective equipment were introduced for enumerators. Collective dwellings were enumerated by administrators via phone interview or an EQ option.
Group activities changed significantly as office staff worked remotely and training was completed using videoconferencing. Leased office spaces were transitioned and used as distribution facilities for field staff, and materials and equipment were used for some recruitment activity.
Another main goal was to ensure data quality was maintained. An administrative data backstop contingency plan was developed where administrative data would be used to support the imputation process under specific conditions.
Machine learning in census coding
In 2021, a new strategy was implemented for coding write-in responses to questions asked in the Census of Population. FastText, a natural language processing algorithm, was applied to 31 questions and approximately 7 million write-in responses that would have been coded by humans in the past.
Certification process changes
For the 2021 Census, the Census Certification Review Committee, a new governance body that reports to the CSC, oversaw certification activities and the consultation of external experts before release.
Content innovation (Gender-based Analysis Plus)
The 2021 Census included new content to address emerging trends and issues, including sex at birth and gender. In the past, the census collected information on sex using the binary options of male or female. The 2019 Census Test quantitatively tested changes to sex and gender questions; results from the 2019 Census Test and from consultations contributed to content determination for the 2021 Census. This change affected operational activities and dissemination, requiring adjustments to processes and data table products to incorporate the new standard.
Other content was added to or revised in the 2021 Census, including instruction in the minority official language, Canadian military experience, membership in a Métis organization or Settlement, enrolment under an Inuit land claims agreement, multiple modes of commuting, the main reason for not working the full year, the main reason for working mostly part time, and shelter costs (band housing).
Meltwater
Meltwater was introduced for the 2021 Census cycle as a social monitoring tool to search, monitor and analyze social and traditional media trends and conversations on relevant issues and topics. Using application programming interfaces, Meltwater performs searches of social and traditional media content based on specific search query keywords. The results are then aggregated in a summary. The use of Meltwater allowed the agency to better understand the current opinion, sentiment and overall conversation on specific census issues to create communications products that resonate with target audiences. Throughout the census dissemination period, the Social Trends Monitoring and Reporting team regularly monitored and reported on census-related activity within the social environment.
Others
The evaluation also considered innovations that were in the process of development but remained incomplete during the 2021 cycle (e.g., handheld devices). Additionally, it also considered smaller projects falling under the responsibilities of subprojects.
The 2021 Census of Population was Canada's 23rd national census. The COVID-19 pandemic emerged in Canada in early 2020 and affected all steps of the 2021 Census process, from data collection to dissemination. In light of this, the Census Program undertook an extensive review of its operations to adjust its plans and procedures to ensure the continuity of census activities while protecting the safety of all Canadians and its employees. This included, among others, focusing on contactless approaches (e.g., electronic questionnaire and telephone follow-up), revising engagement and communication efforts, and introducing remote work. Moreover, changes in content and analysis were incorporated into released products to enhance the understanding of the pandemic's effects on various census topics.
In addition to these adjustments, the Census Program also continued its pursuit of innovation through research and development, as well as the implementation of new and existing innovation projects aimed at maintaining a high level of data quality, supporting data relevance, achieving a high response rate, reducing respondent burden, and improving efficiency and cost-effectiveness. Innovations occurred in all stages of the 2021 Census, from content determination to dissemination.
The evaluation was conducted in accordance with the Treasury Board's Policy on Results and Statistics Canada's Risk-Based Audit and Evaluation Plan (2023/2024 to 2027/2028). The objective of the evaluation is to provide credible and neutral information on the ongoing performance of the Census of Population and to identify potential areas to consider for the next census cycle. The scope of the evaluation focused on the key innovations from the 2021 Census of Population and the lessons learned from these innovations to inform continuous improvement within the Census Program and the broader agency.
The evaluation methodology consisted of a document review, semi-structured interviews, and an internal survey. Interviews were conducted with representatives from the Census Program, subject-matter areas and other partners within Statistics Canada. The survey was sent to directors to gather insight on their experiences pertaining to innovations, best practices and lessons learned from the Census Program. The findings outlined in this report are based on the triangulation of these data collection methods.
Key findings and recommendations
The 2021 Census introduced a spectrum of innovations and process improvements, ranging from small advancements building on past successes to important breakthroughs. With the onset of the COVID-19 pandemic, additional changes were implemented to help mitigate risks. Overall, the innovation activities contributed to the high performance of the 2021 Census and achievements in operational efficiency and effectiveness.
Notwithstanding the significant challenges introduced by COVID-19, the pandemic was an impetus for rapid and breakthrough change within the program. Building on the momentum of COVID-19, leveraging success factors (e.g., buy-in, dedication, strong governance and project management) and learning from challenges (e.g., rigid timelines, last-minute changes, unanticipated complexities) will support the Census Program going forward.
The Census Program has effective debriefing and governance mechanisms to support the identification of best practices and lessons learned at the end of each cycle. Guided by these activities, Census Project Team has a defined vision for 2026 and is already working on improving its processes. Some felt that the post-cycle debriefings could be improved by enhancing communication across project teams and key stakeholders to support awareness of the next steps, and by focusing on a more continuous documentation of lessons learned across the cycle to ensure the timely identification and planning of innovations for the next census. More broadly, staff reported barriers to moving from innovative ideas to execution. The formalization of Census Futures is expected to help the program to overcome some of the barriers to engaging in long-term innovation planning.
Across the agency, there are some mechanisms for knowledge exchange between the Census Program and other areas, both formally and informally. Generally, the Census Program is seen as a driver for innovation within the agency, as investments in new processes and tools can be leveraged for wider benefit. However, representatives within and outside the program agreed that learning across the agency could be improved. This could include exploring structured and dedicated forums for innovation sharing and investigating opportunities such as employee rotations, innovation-focused communities of practice and learning symposiums.
Considering these findings, the following recommendations are proposed:
Recommendation 1
The Assistant Chief Statistician (ACS) of Census, Regional Services and Operations (Field 7) should ensure continued support of the activities of the Census Futures subproject to facilitate the timely advancement of long-term and breakthrough innovation projects.
Recommendation 2
The ACS of Field 7 should ensure that mechanisms for the continuous and ongoing documentation of lessons learned throughout the census cycle are explored to support the timely identification and planning of innovations for the next cycle.
Recommendation 3
The ACS of Field 7 should ensure that internal communication around decisions on innovations and improvements is enhanced so that all stakeholders are aware and interdependencies are understood.
Recommendation 4
The ACS of Field 7, in collaboration with other ACSs, should ensure that mechanisms are explored to further support knowledge exchange between the Census Program and other parts of the agency regarding innovation activities (in both directions).
Under the authority of the Statistics ActFootnote 1, Statistics Canada publishes statistical information to inform Canadians about the general activities and condition of the people. To support these dissemination activities, the StatsCAN app was made available in the Apple App Store and Google Play Store on January 31, 2022. This free app lets Canadians tap into expert analysis, fun facts, visuals, short stories and insights that bring together data, tools and publications to provide them with the latest information on Canada's economy, society and environment.
The app provides timely and convenient access to trusted, unbiased facts right from Statistics Canada and provides a personalized browsing journey allowing users to follow subjects of interest to know when the latest publications become available, save publications for reading later, or opt-in to in-app notifications that provide a comprehensive overview of the country's latest statistical news.
The StatsCAN app supports the five pillars of Statistics Canada's modernization agendaFootnote 2, which align with the agency's mission, vision, and values. These pillars respond to the ever-changing data landscape and to users' and stakeholders' requirements for more data, provided faster, and made available in multiple formats and from multiple access points.
The initial StatsCAN app was not intended or built to collect, use, or disclose any user personal information aside from standard aggregate app metrics and Key Performance Indicators (KPI) provided by the respective app stores hosting the app to measure app performance, such as number of downloads, uninstalls, number of active users, etc., and only in-app notifications were available to users. As such, the initial implementation did not require a Privacy Impact Assessment.
However, in Statistics Canada’s efforts to enhance the app and deliver additional features to improve the user experience, some new functionalities (a feedback form, in-app metrics, and push notifications), are being implemented that utilize some user data. As such, this Privacy Impact Assessment (PIA) was created to describe these uses in more detail and analyze potential privacy implications. These new features may be implemented simultaneously or sequentially.
Objective
A privacy impact assessment for StatsCAN app was conducted to determine if there were any privacy, confidentiality or security issues with the new functionalities being introduced to the app and, if so, to make recommendations for their resolution or mitigation.
Description
Feedback form
Purpose
The purpose of the feedback form is to receive feedback from StatsCAN app users regarding their thoughts and opinions about the app, any improvements they would like to see, or as a mechanism to report issues or bugs. This information will assist the StatsCAN app team in decision-making about the app. The advantage of this feedback form mechanism over the current one is that it will allow users to communicate more easily and directly with Statistics Canada’s app team (users may not wish to publicly post on their app store, and may similarly not wish to leave the app to submit feedback). Unlike the generic Contact Us form that exists on the StatCan website, the new feedback form will be specific to the StatsCAN app, making it easier for users to identify any technical bugs, and provide device information to assist the team in resolving the bugs reported. The StatsCAN app feedback form is not intended to replace the Contact Us form where users wish to contact Statistics Canada regarding the agency’s products and services, or to inquire about concepts, methods or data quality of releases.
The form is hosted on the Statistics Canada website but is not linked to the homepage, or any other public-facing pages on the StatCan website. The form has been developed to be ‘hidden’ and will only be accessible from a desktop if the user has a direct link. Although the form will be hosted on the website, it will be directly integrated within the StatsCAN app and accessible through the Settings screen.
Submission of identifiable personal information (email address) is not mandatory. If the user chooses to leave their email address when reporting an issue or sending a comment or suggestion, the app team may follow up with the user (if more details are required). However, if the user does not want to leave contact information, feedback can be submitted anonymously, without direct identifiers.
In-app metrics
Purpose
New in-app metrics (detailed below) will be analyzed by the StatsCAN app team to better understand their users. These metrics will inform what type of content users are interested in and what types of features are being used most often. In-app metrics will enable the app team to continue building a product that meets users’ needs and delivers an ideal user experience.
Google Analytics for Firebase ("Firebase”) will be the technology used to collect and analyze detailed in-app metrics for both Android OS and iOS users. Firebase was selected due to project parameters and budgetary considerations, as the estimated time and effort for implementation by the StatsCAN app ITFootnote 3 team was much lower compared to other analytics services for mobile. Firebase was also identified as an industry standard for collecting and analyzing in-app metrics. In-app metrics are collected using an Application Program Interface (API) that is plugged into the back-end of the StatsCAN app allowing it to process certain information in accordance with the relevant Firebase Terms of ServiceFootnote 4. This functionality will be appropriately assessed to ensure compliance with applicable Canadian legislation and TBS direction before going into live production (operationalization). Any risks or vulnerabilities found within the assessment will be mitigated and approved by the relevant partners.
For more information on how the StatsCAN app’s third-party analytics service provider uses and safeguards user data, please consult:
If users do not want their information to be used by the third-party analytics service provider, they may alternatively access the same published content on Statistics Canada’s website, which adheres to Statistics Canada’s general privacy notice.
Push notifications
Purpose
The purpose of push notifications is to improve the user experience by better notifying users of the availability of StatCan products and releases that interest them. Users will no longer need to access the app directly to be notified of new releases, should they choose to enable push notifications. Notifying users of new content that has been published in the app will also increase the visibility and use of new data, as well as its timeliness. This will, in turn, increase the agency’s relevance and reach to the Canadian public.
Risk Area Identification and Categorization
The PIA identifies the level of potential risk (level 1 is the lowest level of potential risk and level 4 is the highest) associated with the following risk areas:
a) Type of program or activity
Risk scale
Program or activity that does not involve a decision about an identifiable individual.
1
b) Type of personal information involved and context
Personal information, with no contextual sensitivities after the time of collection, provided by the individual with consent to also use personal information held by another source.
2
c) Program or activity partners and private sector involvement
Within the institution (among one or more programs within the same institution)
1
d) Duration of the program or activity
Long-term program or activity.
3
e) Program population
* The program’s use of personal information is not for administrative purposes. Information is collected for client information and public communications purposes and will not be used to make a decision about any identifiable individual.
N/A
f) Personal information transmission
The personal information is transmitted using wireless technologies.
4
g) Technology and privacy
To implement in-app metrics, Firebase, a mobile application development platform developed & operated by Google will be collecting and handling personal information. Firebase will collect user behaviour metrics within the StatsCAN mobile application.
h) Potential risk that in the event of a privacy breach, there will be an impact on the individual or employee.
There is a very low risk of a breach of some of the personal information being disclosed without proper authorization. The impact on the individual would be minor.
i) Potential risk that in the event of a privacy breach, there will be an impact on the institution.
There is a very low risk of a breach of some of the personal information being disclosed without proper authorization. The impact on the institution would be minor.
Conclusion
This assessment of the StatsCAN app did not identify any privacy risks that cannot be managed using existing safeguards.
National Level CVs by Characteristic
Table summary
This table displays the results of Monthly Survey of Manufacturing: National Level CVs by Characteristic. The information is grouped by Month (appearing as row headers), and Sales of goods manufactured, Raw materials and components inventories, Goods / work in process inventories, Finished goods manufactured inventories and Unfilled Orders, calculated in percentage (appearing as column headers).
This module provides a concise summary of selected Canadian economic events, as well as international and financial market developments by calendar month. It is intended to provide contextual information only to support users of the economic data published by Statistics Canada. In identifying major events or developments, Statistics Canada is not suggesting that these have a material impact on the published economic data in a particular reference month.
All information presented here is obtained from publicly available news and information sources, and does not reflect any protected information provided to Statistics Canada by survey respondents.
Resources
Calgary-based Canadian Natural Resources Limited announced it had entered into an agreement to acquire from Chevron Canada Limited its 20% interest in the Athabasca Oil Sands Project and Chevron's 70% operated working interest of light crude oil and liquids rich assets in the Duvernay play in Alberta for an aggregate consideration of USD $6.5 billion. The company said the effective date for these acquisitions is September 1, 2024 and are targeted to close in the fourth quarter of 2024, subject to regulatory approvals.
Calgary-based Enbridge Inc. announced it will build, own, and operate crude oil and natural gas pipelines in the U.S. Gulf of Mexico for the recently sanctioned Kaskida development, operated by BP Exploration & Production Company. Enbridge said that the Canyon Oil Pipeline System will have a capacity of 200,000 barrels per day and the Canyon Gathering System will have a capacity of 125 million cubic feet per day. Enbridge also said that the pipelines are expected to be operational by 2029 and that the cost of the pipelines will be approximately USD $700 million.
Vancouver-based Western Forest Products Inc. announced that it plans to reduce lumber production in its British Columbia sawmills by approximately 30 million board feet during the period from October to December, 2024 due to a combination of market challenges including weaker lumber demand and higher U.S. softwood lumber duty rates, and factors relating to the B.C. operating environment creating a lack of available economic log supply at certain saw mills. The company said that for the full year of 2024, total lumber production will be reduced by approximately 90 million board feet.
Illinois-based Coeur Mining, Inc. and SilverCrest Metals Inc. of Vancouver announced they had entered into a definitive agreement whereby, a wholly-owned subsidiary of Coeur will acquire all of the issued and outstanding shares of SilverCrest for a total implied equity value of approximately USD $1.7 billion. The companies said the transaction is expected to close late in the first quarter of 2025, subject to shareholder, court, and regulatory approvals.
Minimum wage
Prince Edward Island's minimum wage increased from $15.40 to $16.00 per hour on October 1st.
Ontario's minimum wage increased from $16.55 to $17.20 per hour on October 1st.
Manitoba's minimum wage increased from $15.30 to $15.80 per hour on October 1st.
Saskatchewan's minimum wage increased from $14.00 to $15.00 per hour on October 1st.
Economic and fiscal updates
The Government of Ontario released its 2024 Ontario Economic Outlook and Fiscal Review on October 30th, which included providing a $200 taxpayer rebate early next year, proposing to further extend the temporary gas tax and fuel tax rate cuts until June 30, 2025, and expanding access for families who are seeking fertility treatment. The Government is projecting a $6.6 billion deficit in 2024-25 and real gross domestic product (GDP) growth of 0.9% in 2024 and 1.7% in 2025.
The Government of Newfoundland and Labrador delivered its mid-year fiscal and economic update on October 30th. The Government forecasts a $218 million deficit in 2024-2025 and real GDP growth of 3.3% in 2024.
Other news
The Bank of Canada reduced its target for the overnight rate by 50 basis points to 3.75%. The last change in the target for the overnight rate was a 25 basis points cut in September 2024. The Bank also said it is continuing its policy of balance sheet normalization.
The Government of Canada announced reforms to one of the Temporary Foreign Worker (TFW) Program streams, and that effective November 8th, the starting hourly wage for workers coming into Canada through the high-wage stream will be increased to 20% higher than its current level. The Government said that as a result, a greater number of jobs are expected to be subject to the stricter rules of the low-wage stream.
The Government of Canada announced the 2025-2027 Immigration Levels Plan, which includes controlled targets for temporary residents, specifically international students and foreign workers, as well as for permanent residents. The Government said the 2025–2027 Immigration Levels Plan is expected to result in a population decline of 0.2% in both 2025 and 2026, before returning to a population growth of 0.8% in 2027.
The Government of Ontario announced it was introducing legislation, the Affordable energy Act, that would, if passed, enable the implementation of an integrated energy plan that would prioritize zero-emissions nuclear energy as the province's grid expands, support the government's expansion of energy efficiency programs, help get more electric vehicle (EV) chargers built and reduce "last-mile" connection costs for electricity infrastructure.
TD Canada Trust, RBC Royal Bank of Canada (RBC), BMO Bank of Montreal, Canadian Imperial Bank of Commerce (CIBC), Scotiabank, and Laurentian Bank of Canada announced they were decreasing their Canadian dollar prime lending rates by 50 basis points from 6.45% to 5.95%, effective October 24th.
The Port of Montreal announced on October 10th that a partial strike of indefinite duration in which longshoremen would not be working overtime as part of their duties had been initiated. The Port said this could result in processing delays and a backlog of containers waiting to be handled. On October 27th, the Port of Montreal announced a 24-hour strike will take place at the Port of Montreal on Sunday, October 27, in accordance with the notice filed by the Longshoremen's Union CUPE, Local 375 and that this would affect all Port of Montreal container and dry bulk terminals. On October 31st, the Port of Montreal announced that a new strike had been filed by the longshore workers' union providing for an unlimited strike affecting two container terminals and that these two terminals would be closed until further notice.
United States and other international news
On October 2nd, United States President Joseph R. Biden, Jr. declared that major disasters exist in the State of Georgia and the Commonwealth of Virginia and ordered Federal aid to supplement Commonwealth and local recovery efforts in the areas affected by Hurricane Helene beginning on September 24, 2024, and continuing.
On October 7th, U.S. President Joseph R. Biden, Jr. declared that an emergency exists in the State of Florida and ordered Federal assistance to supplement State, tribal, and local response efforts due to the emergency conditions resulting from Hurricane Milton beginning on October 5, 2024, and continuing.
The Reserve Bank of New Zealand (RBNZ) lowered the Official Cash Rate (OCR), its main policy rate, by 50 basis points to 4.75%. The last change in the OCR was a 25 basis points cut in August 2024.
The European Central Bank (ECB) lowered its three key interest rates by 25 basis points to 3.25% (deposit facility), 3.40% (main refinancing operations), and 3.65% (marginal lending facility). The last change in the deposit facility was a 25 basis points reduction in September 2024. The ECB said it intends to discontinue reinvestments under the pandemic emergency purchase programme (PEPP) at the end of 2024.
The Bank of Japan announced it will encourage the uncollateralized overnight call rate to remain at around 0.25%.
The European Commission announced it had completed its anti-subsidy investigation by imposing definitive countervailing duties on imports of battery electric vehicles (BEVs) from China for a period of five years. The Commission said that sampled Chinese exporting producers will be subject to the following countervailing duties: BYD: 17.0%, Geely: 18.8%, and SAIC: 35.3%. The Commission also said that other cooperating companies would be subject to a duty of 20.7% while all other non-cooperating companies would have a duty of 35.3%.
On October 1st, the International Longshoremen's Association (ILA) announced that members had launched a strike at all major United States ports on the Atlantic and Gulf Coasts. On October 3rd, the ILA and the United States Maritime Alliance, Ltd. announced they had reached a tentative agreement on wages and had agreed to extend the Master Contract until January 15, 2025 to return to the bargaining table to negotiate all other outstanding issues. The ILA said that effective immediately, all current job actions would cease, and all work covered by the Master Contract would resume.
Virginia-based Boeing Company announced plans to reduce the size of its total workforce by roughly 10% over the coming months. Boeing said the reductions would include executives, managers and employees.
Kansas-based Spirit AeroSystems announced employee furloughs in response to the ongoing strike by Boeing employees that began on September 13th. The company said that effective October 28th, it will implement a 21-day furlough for approximately 700 employees working on the 767 and 777 programs and that if the strike continues beyond November, financial pressures may require it to implement additional cost savings measures including layoffs and additional furloughs.
United Kingdom-based Rio Tinto and Arcadium Lithium plc of Ireland, a lithium chemicals producer, announced a definitive agreement under which Rio Tinto will acquire Arcadium in an all-cash transaction that values Arcadium's diluted share capital at approximately USD $6.7 billion. The companies said the transaction is expected to close in mid-2025, subject to receipt of shareholder and customary regulatory approvals and other closing conditions.
France-based Airbus SE announced it plans to adapt its Airbus Defence and Space Division's organization and workforce at that this is expected to result in a reduction of up to 2,500 positions within Airbus Defence and Space until mid 2026.
Germany-based Siemens AG announced an agreement to acquire Altair Engineering Inc. of Michigan, a provider of software in the industrial simulation and analysis market, for an enterprise value of USD $10 billion. Siemens said the transaction is expected to close within the second half of 2025, subject to customary closing conditions.
Financial market news
West Texas Intermediate crude oil closed at USD $69.26 per barrel on October 31st, up from a closing value of USD $68.17 at the end of September. Western Canadian Select crude oil traded in the USD $55 to $66 per barrel range throughout October. The Canadian dollar closed at 71.86 cents U.S. on October 31st, down from 74.08 cents U.S. at the end of September. The S&P/TSX composite index closed at 24,156.87 on October 31st, up from 24,000.37 at the end of September.
The Property Values Program produces annual estimates of assessment values of properties across Canada. These estimates are produced using a common price date, which corresponds to July 1st of the year preceding the tax year under evaluation. Finance Canada uses these estimates to determine fiscal capacity with respect to property taxes for the Equalization program and the Territorial Formula Financing (TFF) program. Footnote 1 To ensure comparability of the data, a number of adjustments are made. They include: the coding of property categories to a common classification; the adjusting of values to a common price base date and to a common volume state (or stock) date; and the imputation of missing property values. Additionally, other removals and adjustments are carried out to produce estimates of assessment values at a common price date that meet the requirements to determine fiscal capacity.
This document presents these adjustments in more detail.
The price base date (PBD) is also called the valuation date and corresponds to a fixed point in time when a property is valued by assessment agencies.
The Target Price Base Date (TPBD) serves as the benchmark for price adjustments within the Property Values Program. It is set as July 1st of the year preceding the tax year under assessment. For instance, the TPBD for the tax year 2023 (TY2023) corresponds to July 1st, 2022.
b. Volume state date
The volume state date (VSD) is the fixed point in time when the physical condition of properties is considered for the purpose of assessment.
The Target Volume State Date (TVSD) serves as the benchmark for volume adjustments within the Property Values Program. It is set as January 1st of the tax year under assessment. For instance, the TVSD for the tax year 2023 (TY2023) corresponds to January 1, 2023.
c. Residential property
Defined as all types of property categorized as residential for assessment purposes in the majority of provinces and territories. It includes single and multi-unit properties, farm residences, cottages and vacation homes, mobile homes, and vacant lands which are designated for residential purposes.
d. Non-residential property
Defined as all types of property categorized as non-residential for assessment purposes in the majority of provinces and territories. It includes industrial, commercial and institutional properties, engineering construction and mining properties, and vacant lands which are designated for non-residential purposes.
Agricultural properties Footnote 3 (excluding residential dwellings on farm property, which are considered residential property for the Property Values Program) as well as the value of machinery and equipment improvements on properties are excluded from final estimates.
e. Properties subject to municipal, provincial, territorial and federal payment-in-lieu
Defined as municipal, provincial, territorial and federal government-owned property for which owners remit payment-in-lieu of tax to municipal governments or local taxation authorities.
3. Input data
a. Data sources
Assessment data are collected from provincial, territorial and municipal assessment entities and are based on municipal assessment rolls. Data providers agree to provide the data on a regular basis either through formal agreements or responding per data request.
Starting in January 2018, assessment roll microdata is gradually being received from every jurisdiction, to replace the use of assessment roll aggregate data. In 2024, we received assessment roll microdata for the tax year 2023 from 12 provinces and territories, up from six provinces and territories in 2017 providing microdata for the tax year 2016. See Annex 2.
b. Unit reported
Data are reported either at the municipal, property or sub-property level.
4. Auxiliary Data
a. Multiple Listing Service data
Multiple Listing Service (MLS) data are produced by the Canadian Real Estate Association (CREA). The data are obtained via Haver Analytics, a company that is the sole distributer of CREA MLS data. MLS data are aggregate monthly residential sales data reported as dollar volume sales and the number of units sold by real estate board. Data are available at sub-provincial level for all provinces and territories with the exception of only provincial-level data for Québec, and no data available for Nunavut. MLS data files are used for price adjustment.
b. Building Permits and Investment in Building Construction data
Data on the number of residential and non-residential building permits issued, investment in construction completion, by type of work (e.g., new unit, conversion, etc.), is obtained from Statistics Canada's Building Permits (BDP) and Investment in Building Construction (IBC) programs. The data are produced monthly, by jurisdiction. IBC data files are used for volume adjustment.
c. Census of Population
Data from Census of Population are available every five years. Between census years, yearly property values, referred to as "intercensal" values, are derived using linear interpolation. Footnote 4 These values are used for the imputation of missing property values.
This report provides a summary of changes to municipal boundaries, status and names. The list is usually produced on an annual basis for changes that occurred during the previous year. A five-year list is produced on Census of population years. Property Values program uses the report for the mapping of new municipalities to the Census 2021 geography during the intercensal period. Upon the publication of the 2026 census, Property Values program will reconcile the intercensal municipal changes to the new census geography.
5. Classification
a. Geography
The municipalities covered by the collected data are assigned to Census Subdivisions (CSDs) updated annually by Statistics Canada's Data Integration Infrastructure Division, using the Standard Geographical Classification system. The assignment of CSDs is revised yearly to reflect changes (municipal amalgamations, legal status changes, etc.) that occur during the year. During the period between censuses, these municipal changes are mapped to their prior census subdivisions, census year 2021. Accumulated intercensal changes are revised to their new CSDs in the year following the publication of the census.
CSDs containing First Nations or other autonomous or self-governing areas are out of scope for Fiscal Arrangements purposes (see Annex 1). As a result, these CSDs are not included in the provincial estimates.
b. Type of property
The type of property classification is reviewed to improve comparability of the data amongst provinces and territories. The classification of properties is more precise when more details are available in the data.
6. Imputation for missing data
There exist municipalities or regions that are not assessed by provincial or territorial assessment agencies, and therefore no property taxes are levied. As a result, assessment values are missing for some jurisdictions, mostly in unorganized areas. Footnote 5 Additionally, on occasion, some municipalities submit their assessment values to assessment agencies later than when the data are required. Missing property assessment values for these municipalities are imputed.
For taxation year 2023, there were 146 jurisdictions with missing data that were imputed, 136 of which were in Newfoundland-and-Labrador, 8 were in Northwest Territories and 2 were in Saskatchewan.
a. Imputation of residential values
The imputation strategy relies on three key assumptions: (1) the reported owner-occupied dwelling values from CSDs in the same province and population group are expected to be similar; (2) the composition of the residential housing mix is consistent between the donor and imputed population group; and (3) property tax assessors would have valued properties similarly in both the donor group and imputed population group.
During the intercensal period, an owner-occupied dwelling value (Intercensal OODV) is found from the forward extrapolation in time to the relevant Tax Year, for the CSD, the line that connects the owner-occupied dwelling counts from two prior census values. For Tax Year 2023 those would be the 2016 Census of Population and the 2021 Census of Population.
The concept of owner-occupied dwelling is different from the concept of residential property value. Residential property value in a geography is the sum of all of owner and non-owner-occupied dwellings, vacant dwellings properties and vacant residential land. Let RV be the ratio of owner-occupied dwelling value (Intercensal OODV) to residential property value (RPV). Based on the key assumptions stated above, we assume that RV of the donor CSD is equal to the RV of the imputed CSD:
Therefore, the “imputed residential property value (IRPV)” could be calculated as
In order to produce an imputed value that best reflects the price base date and volume state date:
the number of private dwellings value is taken from the yearly intercensal file of the same year as the volume state date of the raw file; and
the average value of owner-occupied dwellings is taken from the yearly intercensal file or derived from assessed values of the same year as the price base date of the raw file.
The resulting imputed values are then processed and adjusted Footnote 6 using the same methodology as for raw values.
b. Imputation of non-residential values
Unlike the imputation for residential property values where dwelling values from intercensal files can be used to estimate the value of residential properties, no similar direct indicator is available for non-residential properties. Therefore, non-residential values are imputed using data of CSDs with similar Census population counts within the same province or territory.
Ratios of the total non-residential values over the total population are calculated using data from CSDs for each population class (see table 1 below) for each province and territory. These ratios Footnote 7 are then applied to the population count of the missing CSD to derive the imputed non-residential value. Most of the missing CSDs are from rural areas.
Table 1 – Population class used for imputation on non-residential values Footnote 8
Population Class
Description
1
Rural
2
Small Sized Municipalities
3
Medium Sized Municipalities
4
Large Sized Municipalities
7. Price adjustments
Due to differences in assessment practices and frequency of revaluation practices, data received do not always align with the target price base date (TPBD) of July 1 of the year preceding the taxation year.
a. Choice of source data vintage
To minimize price adjustments, the data from the file whose price base date (PBD) most closely aligns with the target price base date (TPBD) is used to produce the estimates of a given taxation year. If two input files have the same time interval between their price base date and the target price base date, the file with the closest volume state date is selected.
b. Jurisdictions that are not price adjusted
The following provinces do not undergo price adjustments since their price base date corresponds to the desired target price base date:
Quebec
Alberta
British Columbia
c. Residential price adjustment
Sale and resale values are used in the reassessment of properties by assessment agencies. Multiple Listing Service (MLS) resale data is a suitable candidate as a proxy for this information. However, sales data are not the only information that are used by assessment agencies in determining assessment values. Other information such as demolition/construction permits, renovation permits, construction costs, physical inspection and other indicators are used in their complex modelling methodology. Also, MLS resale values are a subset of all residential property values as they exclude private sales as well as properties that have not sold in many years. By consequence, although they are a good indicator, MLS resale values do not always closely follow assessment values price movements.
Statistics Canada does not attempt to replicate the complex modelling of assessment agencies. Instead, it favours the use of price indices to adjust assessment values to the target price base date.
i. Modelling of assessment values
For certain provinces, reassessments occur yearly or on a frequent basis and the target price base date is close to the price base date of the data received. To make better use of the assessment data collected since the onset of this program and to improve the quality of estimates, a price index is generated by calculating the polynomial trendFootnote 9 of average values by property classes. Using average values excludes the effect due to yearly changes in volume (new construction and demolition) and help isolate price movements. Such an index is called Assessment Roll Trend (AR Trend). This modelling is performed at the provincial level.
This method is used in the following provinces:
Newfoundland
Prince Edward Island
Nova Scotia
New Brunswick
ii. Modelling of MLS monthly resale values
For remaining provinces and territories (except Nunavut), in order to represent yearly price movements, a price index is generated by calculating the polynomial trend of seasonally adjusted MLS monthly average resale values. These polynomial trend series are calculated by MLS jurisdiction and applied by CSD.
This method is used in the following provinces and territories:
Ontario
Manitoba
Saskatchewan
Yukon
Northwest Territories
iii. Residential price index for Nunavut
As resale data do not exist for Nunavut, Statistics Canada uses data for the region of northern Quebec Footnote 10 as a proxy for this territory. Footnote 11 The property assessment data are provided by the provincial government of Quebec.
The Nunavut residential index is calculated using an unweighted average of residential and non-residential property values reported. Footnote 12
An annual series is generated and converted into a monthly series by adding one twelfth of the dollar difference between two observations to each successive month between observed values (linear interpolation), creating a monthly index. Residential price-adjustments are then applied to Nunavut property values using the same algorithm (for ratios) designed for resale data.
d. Non-residential price adjustment
Unlike residential properties, non-residential properties (more specifically industrial, commercial, and industrial) are not often for sale. It is therefore comparatively more difficult to find appropriate market indicators to use for non-residential price adjustment. To overcome this, the correlation between residential and non-residential price changes was analysed.
A regression analysis was performed, and a model was constructed using assessment data from four provinces: Prince Edward Island, New Brunswick, Quebec, and British Columbia. The reasons for using these specific four provinces are twofold: (1) these provinces evaluate their non-residential property stock on an annual basis Footnote 13 and (2) they report data for both assessment values and numbers of non-residential properties. This level of detail allowed the derivation of the annual non-residential price movements. The conclusion was to use the model coefficient of 0.73 as a discount factor to the residential series.
The discount factor methodology was satisfactory for several years, while MLS resale values observed a consistent behaviour compared to non-residential values. However, over the last 3 years, the correlation between residential and non-residential values became weaker. This combined with the fact that assessment data was collected since 2006, it became realistic to favour the development of the polynomial trend of assessment data (AR Trend) methodology to replace the discount factor methodology, when possible.
i. Modelling of non-residential assessment data
Like the modelling of residential assessment data, non-residential assessment data is modelled using polynomial trend of average values by broad property types.
This method is used in:
Newfoundland (provincial level)
Prince Edward Island (provincial level)
Nova Scotia (provincial level)
New Brunswick (provincial level)
Ontario (separate modelling for Toronto and rest of province)
Manitoba (separate modelling for Winnipeg and rest of province)
ii. Discount factor applied to MLS polynomial trend series
For remaining provinces and territories (except Nunavut), it is not possible to model the assessment data as the reassessments cycle is long and there is not yet enough source data for modelling. In these cases, the discount factor is used to adjust the non-residential property values by applying it to the MLS polynomial trend series of residential properties. In future, it may become possible to update this methodology, as more assessment data is received.
This method is used in:
Saskatchewan
Yukon
Northwest Territories
iii. Discount factor applied to Nunavut price index
Similarly, the discount factor is applied to the Nunavut residential price index.
e. Calculating the price adjusted value
It involves price index preparation, price adjustment ratio and adjusted value calculation.
Price index is generated using polynomial regression model on either data of MLS prices or of assessment averages.
The price adjustment ratio is calculated by taking the value of the index value representing the month of the target price base date (TPBD) over the index value for the month of the price base date (PBD) of the source data. This price adjustment ratio is then applied to the assessment value to yield the adjusted value on the month of the target price base date.
8. Volume adjustments
Volume adjustments ensure that properties reflect a common volume state date as of January 1st of the taxation year. For assessment data that reflects a volume state date earlier or later than the target volume state date, the value of all completed construction that occurred in the period between the two dates is estimated using Statistics Canada's monthly Building Permits Program or from the Investment in Building Construction Program and then added or subtracted, as the case may be, from the total property values. This methodology is used for both residential and non-residential property values.
a. Residential volume adjustments
For residential properties, the volume adjustment is calculated by estimating the construction that was completed in between the volume state date and the target volume state date using the investment in construction completion values.
Construction completion values represent the total investment in construction available upon completion of construction. Monthly values that fall between the volume state date and the target volume state date are summed for an estimated total volume adjustment for the period. Residential volume adjustments typically account for less than 2% of estimated total values.
b. Non-residential volume adjustments
Same as for residential volume adjustments, non-residential investment in construction completion values are used in the calculations of volume adjustments. Non-residential volume adjustments could slightly exceed 2% of estimated total values.
9. Removals and adjustments in accordance with typical property assessment and taxation practices
a. Removal of CSDs on account of First Nations and other Aboriginal Groups
Census subdivisions containing First Nations reserves, and autonomous or self-governing areas are removed as they are deemed out of scope. Such CSDs are identified based on their CSD type.Footnote 14
b. Exclusion of exempt residential property
In some provinces, certain properties are identified as exempt from property taxes as presented in the input files received from the assessment agencies. Any value associated with these properties are excluded from estimates for the purposes of fiscal arrangements.
c. Exclusions of schools, churches and hospitals
The most important non-residential properties which are generally exempt from property taxes are schools, churches and hospitals (S/C/H).
Some provinces and territories provide detailed breakdowns of S/C/H in their assessment data. For these provinces and territories, the exact proportion of S/C/H is removed from the final estimates.
For provinces and territories where the S/C/H breakdowns are not available, the proportion of the S/C/H assessment values relative to total assessment values for non-residential properties is estimated by calculating and applying the proportion of S/C/H property values from a similar reporting province or territory. It should be noted that values for engineering and mining properties are excluded from the total assessment value for non-residential properties used in the calculation of the S/C/H proportions.
The list of provinces and territories used in the calculation of estimated S/C/H proportion depends on data availability and can change from one year to the next as microdata is received.
d. Removal of properties subject to provincial-territorial and municipal payments-in-lieu of taxes
Instead of regular property taxes, federal and provincial governments usually remit a payment in lieu of taxes (PILT) for their exempt properties. However, only federal PILT property represents fiscal capacity for the consolidated provincial-territorial-municipal-local sector; provincial and territorial PILT properties and municipal institutional properties are excluded.
e. Adjustments in the Northwest Territories and Nunavut
Unlike in provinces and the Yukon, property assessments in the Northwest Territories and Nunavut do not consistently follow market value standards.
Land values within the municipal taxation areas (Iqaluit in Nunavut; Yellowknife, Fort Simpson, Fort Smith, Hay River, Norman Wells and Inuvik in NWT) reflect full market value, while land values in the remainder of the two territories (i.e. in the General Taxation Areas) are, according to the data provider, based on average regional development costs.
Improvements (i.e. buildings) in both territories are assessed based on depreciated Edmonton construction costs, using Alberta's depreciation schedule. The value so determined for Yellowknife is then multiplied by a factor of 1.35, which is set out in regulations. According to the assessment data provider, this was done to reflect Yellowknife's actual construction costs relative to Edmonton's. Yellowknife's assessed building values therefore approximately reflect market value. Footnote 15
Outside of Yellowknife, in the two territories, a discount factor of 0.666 has been applied to building values initially assessed at depreciated Edmonton construction costs. This factor is also set out in regulations and, according to the assessment data provider, was introduced to encourage development. Upon data entry, this embedded 0.666 scaling factor is removed from the building values in the Northwest Territories outside of Yellowknife and Nunavut.
f. Machinery and equipment values
Property values for machinery and equipment (M&E) components in the non-residential category are deemed to be out of scope.
g. Removal of personal property values in Manitoba
The assessment roll in Manitoba includes personal property, oil and gas at time of extraction is taxed, which are not considered real property. Such property values are excluded from the estimate.
h. Mixed-use properties
Some properties are used for both residential and non-residential purposes. In cases where no further breakdowns are available, the values of mixed-use properties are redistributed between residential and non-residential property types according to the existing distribution of total residential and non-residential property values by CSD. In cases where further breakdowns are available, mostly in jurisdictions where microdata was received, the values are assigned according to the exact breakdown. Mixed-use residential and non-residential properties that are redistributed represent 0.015% of the total valuation of properties in Canada.
One of the most common cases of mixed-use type properties are of a building consisting of ground level commercial with one or more floors of residential units above.
10. Quality control
Statistics Canada's quality assurance framework requires an assessment of data relevance, accuracy, timeliness, accessibility, interpretability and coherence. The quality of the raw input data collected from provincial, territorial and municipal assessment departments and agencies cannot be evaluated in this framework. However, confrontational analysis is performed to compare the source data to existing statistical programs and public information such as annual reports obtained from provincial websites and assessment agencies. Any irregularities identified are carefully reviewed and analyzed before the official release of the data.
Total adjusted residential estimates, for both taxable and exempt properties, are compared to Statistics Canada's Census of Population. The coherence of the values is examined by census coverage analysis, which compares the source data to private dwelling counts and values found in Statistics Canada's Census of Population.
Annex 1. List of CSD types representing First Nations and other Aboriginal Groups Footnote 16
The following are the list of CSD types representing First Nations and other Aboriginal groups presented by province and territory.
Annex 1. List of CSD types representing First Nations and other Aboriginal Groups
Province / Territory
CSD Type
CSD Type description
Legal Code
Legal Code description
Number of CSDs
Nova Scotia
IRI
Indian reserve
FL
Federally legislated
2
New Brunswick
IRI
Indian reserve
FL
Federally legislated
3
Ontario
IRI
Indian reserve
FL
Federally legislated
1
Manitoba
IRI
Indian reserve
FL
Federally legislated
9
Manitoba
S-É
Indian settlement
U
Not legal municipality - aboriginal geography
1
Saskatchewan
IRI
Indian reserve
FL
Federally legislated
3
Saskatchewan
S-É
Indian settlement
U
Not legal municipality - aboriginal geography
1
Alberta
IRI
Indian reserve
FL
Federally legislated
1
British Columbia
IGD
Indian government district
PL
Provincially legislated - legal municipality
2
British Columbia
IRI
Indian reserve
FL
Federally legislated
3
British Columbia
NL
Nisga'a land
FL
Federally legislated
1
Annex 2. List of provinces and territories with microdata in tax year 2023
Annex 2. List of provinces and territories with microdata in tax year 2023
Province / Territory
Tax year 2016
Tax year 2023
Newfoundland and Labrador
Yes
Yes
Prince Edward Island
No
Yes
Nova Scotia
Yes
Yes
New Brunswick
No
Yes
Quebec
No
No
Ontario
Yes
Yes
Manitoba
No
Yes
Saskatchewan (except Prince Albert)
No
Yes
Alberta
No
Yes
British Columbia
No
Yes
Yukon
Yes
Yes
Northwest Territories
Yes
Yes
Nunavut
No
Yes
Total number of provinces and territories with microdata