
Release date: May 8, 2024
Catalogue number: 45200003
ISSN: 2816-2250

Listen to "Eh Sayers" on:


Social media shareables
Social media shareables
Tag us in your social media posts
-
 StatisticsCanada
 -
 @statcan_eng
 -
 @StatCan_eng
 -
 StatCanada
 -
 StatisticsCanada
Visuals for social media
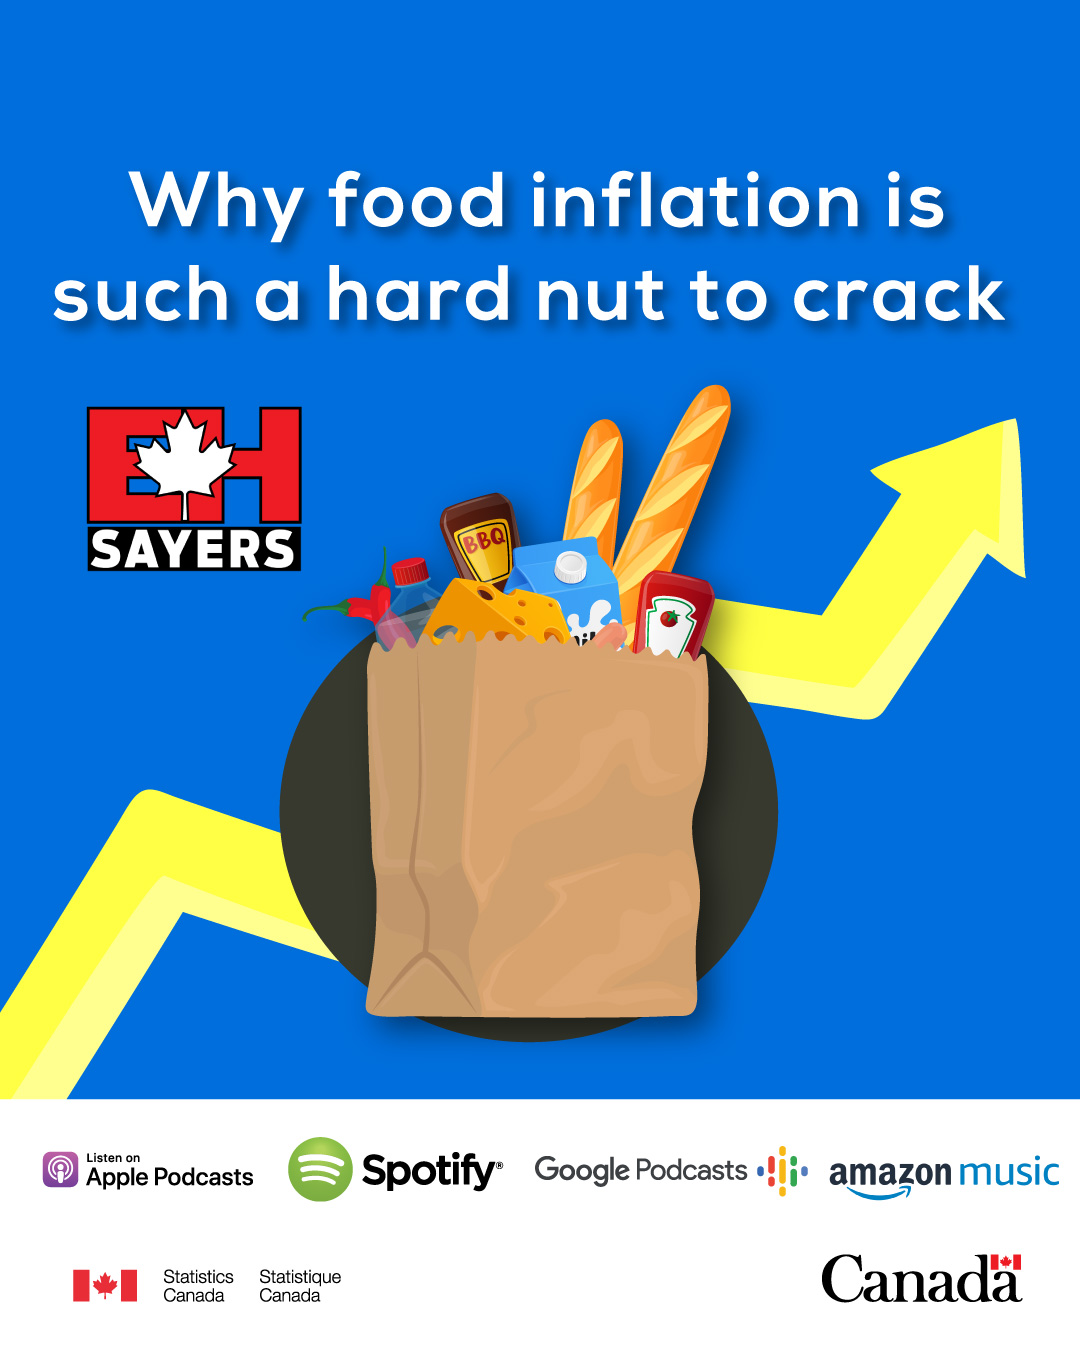
Download: Eh Sayers - Why Food Inflation Is Such A Hard Nut To Crack - Graphic 1
Are you feeling like it's a little bit harder to bring home the bacon... from the grocery store? The latest data indicate that food prices have mostly stabilized... but why does it feel like the cost of feeding your family is still going up? Today, we're talking food inflation with StatCan's resident smart cookie Taylor Mitchell.
Host
Tegan Bridge
Guest
Taylor Mitchell
Listen to audio
Eh Sayers Episode 18 - Why Food Inflation Is Such A Hard Nut To Crack - Transcript
Transcript
Tegan: Welcome to Eh Sayers, a podcast from Statistics Canada, where we meet the people behind the data and explore the stories behind the numbers. I'm your host, Tegan Bridge.
Let's talk about food. More specifically, let's talk about the price of food. My family likes to cook our own meals, and I used to be really glad about it because it meant that we were saving money by not going out to eat... But... have you seen what groceries cost nowadays? What happened?
We did an episode talking about inflation way back, but I think it's time we did another one, and this time, we're talking turkey. [Pause] Geddit? Because we're talking about food.
So welcome back Taylor.
Taylor: Thanks so much for having me.
Tegan: And remind us who you are?
Taylor: My name is Taylor Mitchell. I am the Program Manager for Analysis, Dissemination, and Communications for the Consumer Price Index here at Statistics Canada.
Tegan: So we're here to talk about food prices. And this is an actual anecdote from my actual life. My family budgets 50 percent more for our groceries than we did a few years ago.
Taylor: 50%?
Tegan: 50%.
Taylor: Okay.
Tegan: But the latest data are saying that food prices have stabilized. Well, not for me, they haven't. Can you make this make sense?
Taylor: So you're telling me that you budget 50 percent more.
Do you actually spend 50 percent more? Because I know that when I go to the grocery store, it can vary a lot from week to week. It can vary in terms of what I'm buying. It can vary in terms of whether, you know, I walked into a sale that maybe I wasn't expecting. It can vary in terms of the time of year because, you know, certain fruits and vegetables will be in season or will be out of season.
So I guess my question is, you know, just because you're expecting to spend more, are you actually spending that much more?
Tegan: You know, well, it's a little bit more complicated. Some months do spend more, some months do spend less. I would say overall it has increased, but I know for sure the budgeting has increased.
Taylor: Prices have definitely increased, so you're, you're not alone in feeling the pinch there
I always say I'm somebody that works on price data. I look at price data all day long at work, and yet I'm still a person that goes to the grocery store and I feel, I think the same, the same frustration that everybody else feels because it feels like prices have gone up so much in a relatively short amount of time. But with the CPI, we are looking at a specific time horizon. We're looking at the last 12 months.
So when we're talking about food inflation, we're talking about, uh, how Food prices or grocery prices have changed between March of 2024 and March of 2023, which is actually only 1.9%. But that feels pretty inconsistent with most of our experiences of the grocery store. Um, and that's because we're just looking at that 12 month period. But if we extend that period back a little bit, and we look at, let's say, from the beginning of the pandemic until now, uh, prices for groceries have actually risen about 23%. And that's going to be a little bit more, a little bit less, depending on how you spend your money. Someone that's a vegetarian is certainly going to be facing a different level of grocery inflation than somebody that eats a lot of meat.
If you're eating a lot of fish, it might be a little bit less because fish prices are only up about 10 percent during that time period. But it's other things like fresh fruit, we've seen higher grocery inflation for fruits than for vegetables. Bakery products are up a little bit so it comes down to preferences and consumer behavior as well.
Tegan: So maybe it's, I know you're not a psychologist, but maybe it's more of a psychology thing. I'm, I'm still left reeling then from these price increases and they haven't gone down and I'm still thinking, wow, everything's so expensive.
Taylor: Well, let's put it this way. I think that our perceptions of inflation are often shaped by things that we buy all the time. And we buy groceries all the time because we need to eat.
Tegan: So are they going to go back down eventually?
Taylor: Uh, well, historically speaking, food prices have not really meaningfully come down over time. Um, and that doesn't mean that you might not have a month where prices do fall a little bit. Food is very seasonal and often there are kind of temporary supply shocks.
You know, we've all, I'm sure we all remember, uh, a romaine lettuce situation where prices skyrocketed and then came back down. But for the most part, as a, as a longer term trend, prices typically have not historically fallen for food.
Tegan: So it's more of a new normal.
Taylor: It's, it's probably more of a level shift. I will note that, uh, you know, the COVID 19 pandemic, it really is a unique set of circumstances. And, uh, we're still seeing a situation where there are some still, there's still some supply chain considerations. It's really not clear how that's going to look moving forward. But historically speaking, um, prices tend to move upward for food.
Tegan: How do you know for a fact that your data are accurate? Are we shopping at the same grocery store?
Taylor: So we actually see food as a real point of strength for the CPI program. And that's because we have access to, to transaction data, which is collected from the point of sale. So You know, I go to the grocery store. I buy my groceries. The data from that transaction is aggregated. So it includes exactly what I paid, you know, whether I got something on sale, whether I paid full price. An aggregated form of that data is sent to Statistics Canada. And so our prices are actually based off of millions of grocery transactions from major grocery retailers, including all their subsidiaries. So the, the lower cost subsidiaries and the, the, the higher end chains, we receive those data and those form the basis for the majority of the food prices that we collect. So it really is the gold standard. It's, it's the best data that are available. It's, it's what Canadians are paying.
Tegan: Would it be possible, conceivably, to measure inflation in a way that's better, faster, and more accurate than what we're doing right now?
Taylor: Better, faster, and more accurate? As far as food goes, this method really is the gold standard. What we want to measure when we are looking at price change over time, we want to measure the prices that Canadians are actually paying.
And that in some cases might be different than what's on the shelf at the store. And so because we have this transaction data, we are capturing what Canadians are actually paying and we are receiving that data in a very timely fashion. So this is really a point of strength for us. And uh, and it's, it's, um, it's a situation where we really don't see much, much room for improvement because we're very satisfied that this is the best price data for food in Canada.
Tegan: What drives food inflation?
Taylor: All kinds of things. Um, so over the past, over the past few years, we've, we've seen a number of factors really influencing food inflation. Um, we've seen weather factors. We've seen droughts and we've seen rain. We've seen that impacting supply and shortening the growing season. In some cases, we've seen Russia's invasion of Ukraine, which had a very noticeable impact, especially if you're someone that likes to buy bread or pasta or anything that that contains wheat. You know, that's that's the world's breadbasket and we're still, we're still impacted by the invasion of Ukraine. It's resulted in higher prices for inputs along the supply chain. And we have trade embargoes with Russia that have reduced supplies for, for some other inputs.
Tegan: Are there any common misconceptions about food inflation that you'd like a chance, take the chance to address?
Taylor: So alongside the CPI, we publish average retail prices for a variety of food products, and we see these average food prices as being really a complimentary tool to the CPI. But one thing that they don't do is, is tell us how prices have changed over time. The CPI, it tracks the exact same jar of peanut butter every month from the exact same grocery store. And we look at how that price has changed over time.
Average retail prices, they look at what Canadians are actually purchasing. So, for instance, if Canadians are buying brand name peanut butter in January, but in February, they decide to buy, you know, the house brand peanut butter, you know, maybe the house brand's gone on sale, the average retail price table might actually show a lower price in February than it did in January because that consumer preference has changed. But that's not really a price change. That's it's not really telling us anything about inflation. So when it comes to looking at price change over time, we always like to remind our users to use the CPI first and foremost, and that other tables like the average retail prices table are are complimentary tools and they're not a replacement.
Tegan: So comparing with the CPI is comparing apples to apples and using the average price is apples to oranges.
Taylor: Exactly. It's, uh, it might show you a price change, but not what we call a pure price change. And it hasn't, it's not accounting for, for things like quality changes as well, which is another, another thing that the CPI holds constant. Because as anyone that's bought groceries lately knows, uh, you know, shrinkflation is a real, a real topic of conversation.
And, and the CPI holds quantities for products standard, so if you know that jar of peanut butter has gotten smaller in size over the years, all else equal, that's going to be considered a price increase for the CPI.
Tegan: Gotcha. I understand that.
If someone would like to learn more about food inflation, the CPI, and how StatCan measures it, where should they go?
Taylor: We've got so many great tools, uh, for Canadians to explore inflation and learn more about, you know, inflation more broadly, but food inflation specifically. We have a data visualization tool, the Consumer Price Index Data Visualization Tool. It has a neat little subtool called Price Trends 1914 to Today. Uh, consumers can explore food inflation for, for all different types of commodities, going down to a pretty low level of detail. Explore how prices have changed over time. We also have a new, a new hub, the Food Price Data Hub, which contains, you know, a multitude of information all about food prices, uh, including CPI data, including average retail price data uh, and it also includes information along the supply chain, so Canadians can see how prices are, are changing really from farm to fork.
Tegan: You've been listening to Eh Sayers. Thank you to our guest, Taylor Mitchell.
You can subscribe to this show wherever you get your podcasts. There, you can also find the French version of our show, called Hé-coutez bien! If you liked this show, please rate, review, and subscribe. And thanks for listening!