
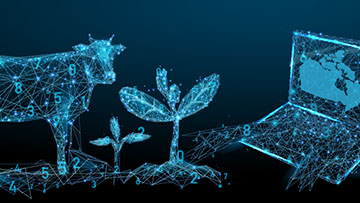
Agriculture and Food Statistics

 Animal production
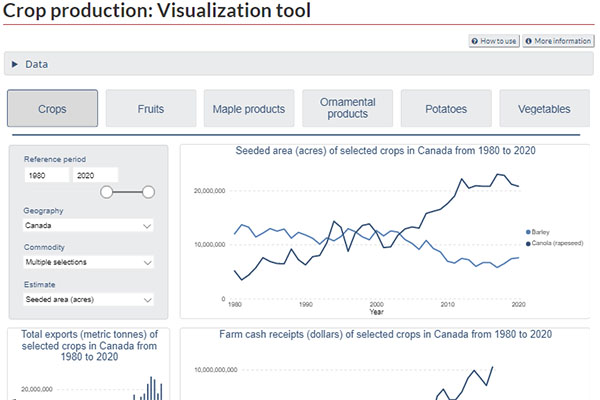
 Crop production
 Farm business
 Farm population
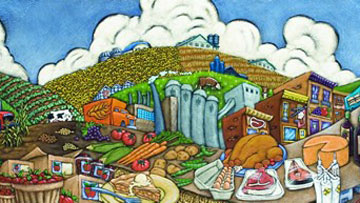
 Food
Food Land use
Features


Indicators
Selected geographical area: ~ ' ' ~ Canada ~ ''; ?>
-
21.8 million acres1.0%
 (annual change)
 -
21.8 million tonnes13.3%
(annual change)
More key indicators
Selected geographical area: ~ ' ' ~ Canada ~ ''; ?>
-
10.0 million tonnes27.4%
(year-over-year change)
-
11.1 million2.5%
(year-over-year change)
-
3.8 million acres1.7%
(annual change)
-
14.9 million tonnes-3.1%
 (annual change)
 -
$102.2 billion4.7%
(annual change)
-
$83.0 billion5.1%
(annual change)
-
$888.9 billion6.5%
(annual change)
-
$2.4 billion7.0%
(annual change)
-
$3.1 billion10.0%
(annual change)
-
13.9 million0.8%
(year-over-year change)
-
$852.7 million1.8%
(annual change)
-
$8.3 billion-0.3%
(annual change)
-
$241.3 million14.8%
(annual change)
-
$831 million7.4%
(annual change)
-
833,0003.0%
(year-over-year change)
-
5.9 million acres1.9%
(annual change)
-
6.8 million tonnes-10.2%
(annual change)
-
$12.7 billion$4.3 billion
(annual change)
-
$1.6 billion16.8%
(annual change)
-
$1.8 billion7.1%
(annual change)
-
26.7 million acres-1.1%
(annual change)
-
40.0 million tonnes11.2%
(annual change)
-
19.5 million tonnes12.0%
(year-over-year change)

Analytical articles
Census of Agriculture
The Census of Agriculture provides a statistical portrait of Canada's agriculture industry and its farm operators and families.
Food Statistics

The Food Statistics portal offers access to a centralized collection of information on food for human consumption in Canada by bringing together data, tools and reports.
Food Price Data Hub
The Food Price Data Hub features a variety of food price related statistics, articles and tools.
Geography

Custom services

A variety of data products can be personalized to meet clients' special requirements. Contact us by filling out an online form or by email or telephone.
Partners
Learn more about the partners who support our Agriculture and food statistics.
Transparency
Feedback
What do you want to see on this page? Email infostats@statcan.gc.ca to let us know.