
Food Price Data Hub

This data hub offers access to a centralized collection of information on food prices in Canada.
Consumer Price Index (CPI): Statistics Canada's primary measure of inflation
Consumer Price Index for food purchased from stores
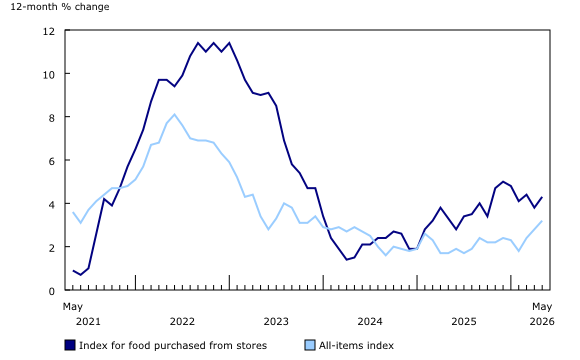
Description: Consumer Price Index for food purchased from stores, 12-month percentage change
| Index for food purchased from stores | All-items index | |
|---|---|---|
| May 2021 | 0.9 | 3.6 |
| June 2021 | 0.7 | 3.1 |
| July 2021 | 1.0 | 3.7 |
| August 2021 | 2.6 | 4.1 |
| September 2021 | 4.2 | 4.4 |
| October 2021 | 3.9 | 4.7 |
| November 2021 | 4.7 | 4.7 |
| December 2021 | 5.7 | 4.8 |
| January 2022 | 6.5 | 5.1 |
| February 2022 | 7.4 | 5.7 |
| March 2022 | 8.7 | 6.7 |
| April 2022 | 9.7 | 6.8 |
| May 2022 | 9.7 | 7.7 |
| June 2022 | 9.4 | 8.1 |
| July 2022 | 9.9 | 7.6 |
| August 2022 | 10.8 | 7.0 |
| September 2022 | 11.4 | 6.9 |
| October 2022 | 11.0 | 6.9 |
| November 2022 | 11.4 | 6.8 |
| December 2022 | 11.0 | 6.3 |
| January 2023 | 11.4 | 5.9 |
| February 2023 | 10.6 | 5.2 |
| March 2023 | 9.7 | 4.3 |
| April 2023 | 9.1 | 4.4 |
| May 2023 | 9.0 | 3.4 |
| June 2023 | 9.1 | 2.8 |
| July 2023 | 8.5 | 3.3 |
| August 2023 | 6.9 | 4.0 |
| September 2023 | 5.8 | 3.8 |
| October 2023 | 5.4 | 3.1 |
| November 2023 | 4.7 | 3.1 |
| December 2023 | 4.7 | 3.4 |
| January 2024 | 3.4 | 2.9 |
| February 2024 | 2.4 | 2.8 |
| March 2024 | 1.9 | 2.9 |
| April 2024 | 1.4 | 2.7 |
| May 2024 | 1.5 | 2.9 |
| June 2024 | 2.1 | 2.7 |
| July 2024 | 2.1 | 2.5 |
| August 2024 | 2.4 | 2.0 |
| September 2024 | 2.4 | 1.6 |
| October 2024 | 2.7 | 2.0 |
| November 2024 | 2.6 | 1.9 |
| December 2024 | 1.9 | 1.8 |
| January 2025 | 1.9 | 1.9 |
| February 2025 | 2.8 | 2.6 |
| March 2025 | 3.2 | 2.3 |
| April 2025 | 3.8 | 1.7 |
| May 2025 | 3.3 | 1.7 |
| June 2025 | 2.8 | 1.9 |
| July 2025 | 3.4 | 1.7 |
| August 2025 | 3.5 | 1.9 |
| September 2025 | 4.0 | 2.4 |
| October 2025 | 3.4 | 2.2 |
| November 2025 | 4.7 | 2.2 |
| December 2025 | 5.0 | 2.4 |
| January 2026 | 4.8 | 2.3 |
| February 2026 | 4.1 | 1.8 |
| March 2026 | 4.4 | 2.4 |
| April 2026 | 3.8 | 2.8 |
| May 2026 | 4.3 | 3.2 |
Notes:
- Stores include grocery stores, which comprise major grocery retailers and independent grocery stores.
- See Representative Products of the Consumer Price Index for the list of products that make up the Consumer Price Index's basket of goods and services.
Source: Table 18-10-0004-03
Consumer Price Index data visualization tool

The Consumer Price Index (CPI) data visualization tool provides dynamic and customizable access to current and historical CPI data.
Average Retail Food Prices Data Visualization Tool
The Average Retail Food Prices Data Visualization Tool allows users to explore average prices by building their own grocery basket.
Find data on
 Diet and nutrition
 Food manufacturing
 Food prices
 Food production and availability
Monthly Canadian average retail price of selected food items
Milk, 2 litres
$5.44
(April 2026)
White bread, 675 grams
$3.58
(April 2026)
White rice, 2 kilograms
$9.60
(April 2026)
Butter, 454 grams
$5.99
(April 2026)
Ground beef, per kilogram
$15.59
(April 2026)
Chicken breasts, per kilogram
$14.39
(April 2026)
Eggs, 1 dozen
$4.80
(April 2026)
Apples, per kilogram
$5.76
(April 2026)
Bananas, per kilogram
$1.87
(April 2026)
Potatoes, per kilogram
$5.16
(April 2026)
Tomatoes, per kilogram
$6.18
(April 2026)
Vegetable oil, 3 litres
$8.68
(April 2026)
Notes:
- Users should exercise caution when comparing average prices over time. Factors such as product rotation, quality and quantity changes, and shifting consumer preferences can contribute to price differences from one month to another. Users should also use caution when comparing average prices across different provinces, because of variations in brands, quality and size among geographic areas.
- Average retail prices are available by province in Table 18-10-0245-01 (Monthly average retail prices for selected products).
- The Methodological Supplement for the Monthly Average Retail Prices Table provides more information on the collection and interpretation of these data.
Source: Table 18-10-0245-01
International price indexes

Find inflation data for Organisation for Economic Co-operation and Development (OECD) countries.
Food supply chain prices, 12-month change
Production

Crops
(December 2025)
-3.3% decrease
Livestock and animal products
(December 2025)
8.3% increase
Farm input: Machinery fuel
(Fourth quarter 2025)
1.6% increase
Farm input: Fertilizer
(Fourth quarter 2025)
12.8% increase
Farm input: Animal feed
(Fourth quarter 2025)
-2.8% decrease

Crop products
(April 2026)
-4.6% decrease
Animals and animal products
(April 2026)
7.8% decrease
Plastic bags
(April 2026)
2.7% increase
Plastic bottles
(April 2026)
0.7% increase
Paperboard containers
(April 2026)
0.2% decrease
Transportation, wholesale and retail
Truck transportation
(December 2025)
0.0% decrease
Motor gasoline
(April 2026)
38.4% increase
Diesel fuel
(April 2026)
58.0%
increase
Food wholesale markup
(December 2025)
6.8% decrease
Grocery stores markup
(December 2025)
14.9% increase
Personal Inflation Calculator

The Personal Inflation Calculator is an interactive tool that allows you to estimate your personal inflation rate based on your household expenses.
Features


An Overview of Canada's Consumer Price Index

The video An Overview of Canada's Consumer Price Index (CPI) defines the CPI and looks at what it measures and how it is used.
Agriculture and Food Statistics

Agriculture and Food Statistics is a one-stop shop for statistical information on agriculture and food.
Eh Sayers podcast

Why food inflation is such a hard nut to crack. The latest data indicate that food prices have mostly stabilized... but why does it feel like the cost of feeding your family is still going up? Listen to the podcast to learn more!
Agriculture and Agri-Food Canada
Agriculture and Agri-Food Canada supports the Canadian agriculture and agri-food sector through initiatives that promote innovation and competitiveness.
Feedback
What do you want to see on this page? Email infostats@statcan.gc.ca to let us know.