
Description: Labour shortage trends in Canada
Labour shortage trends in Canada
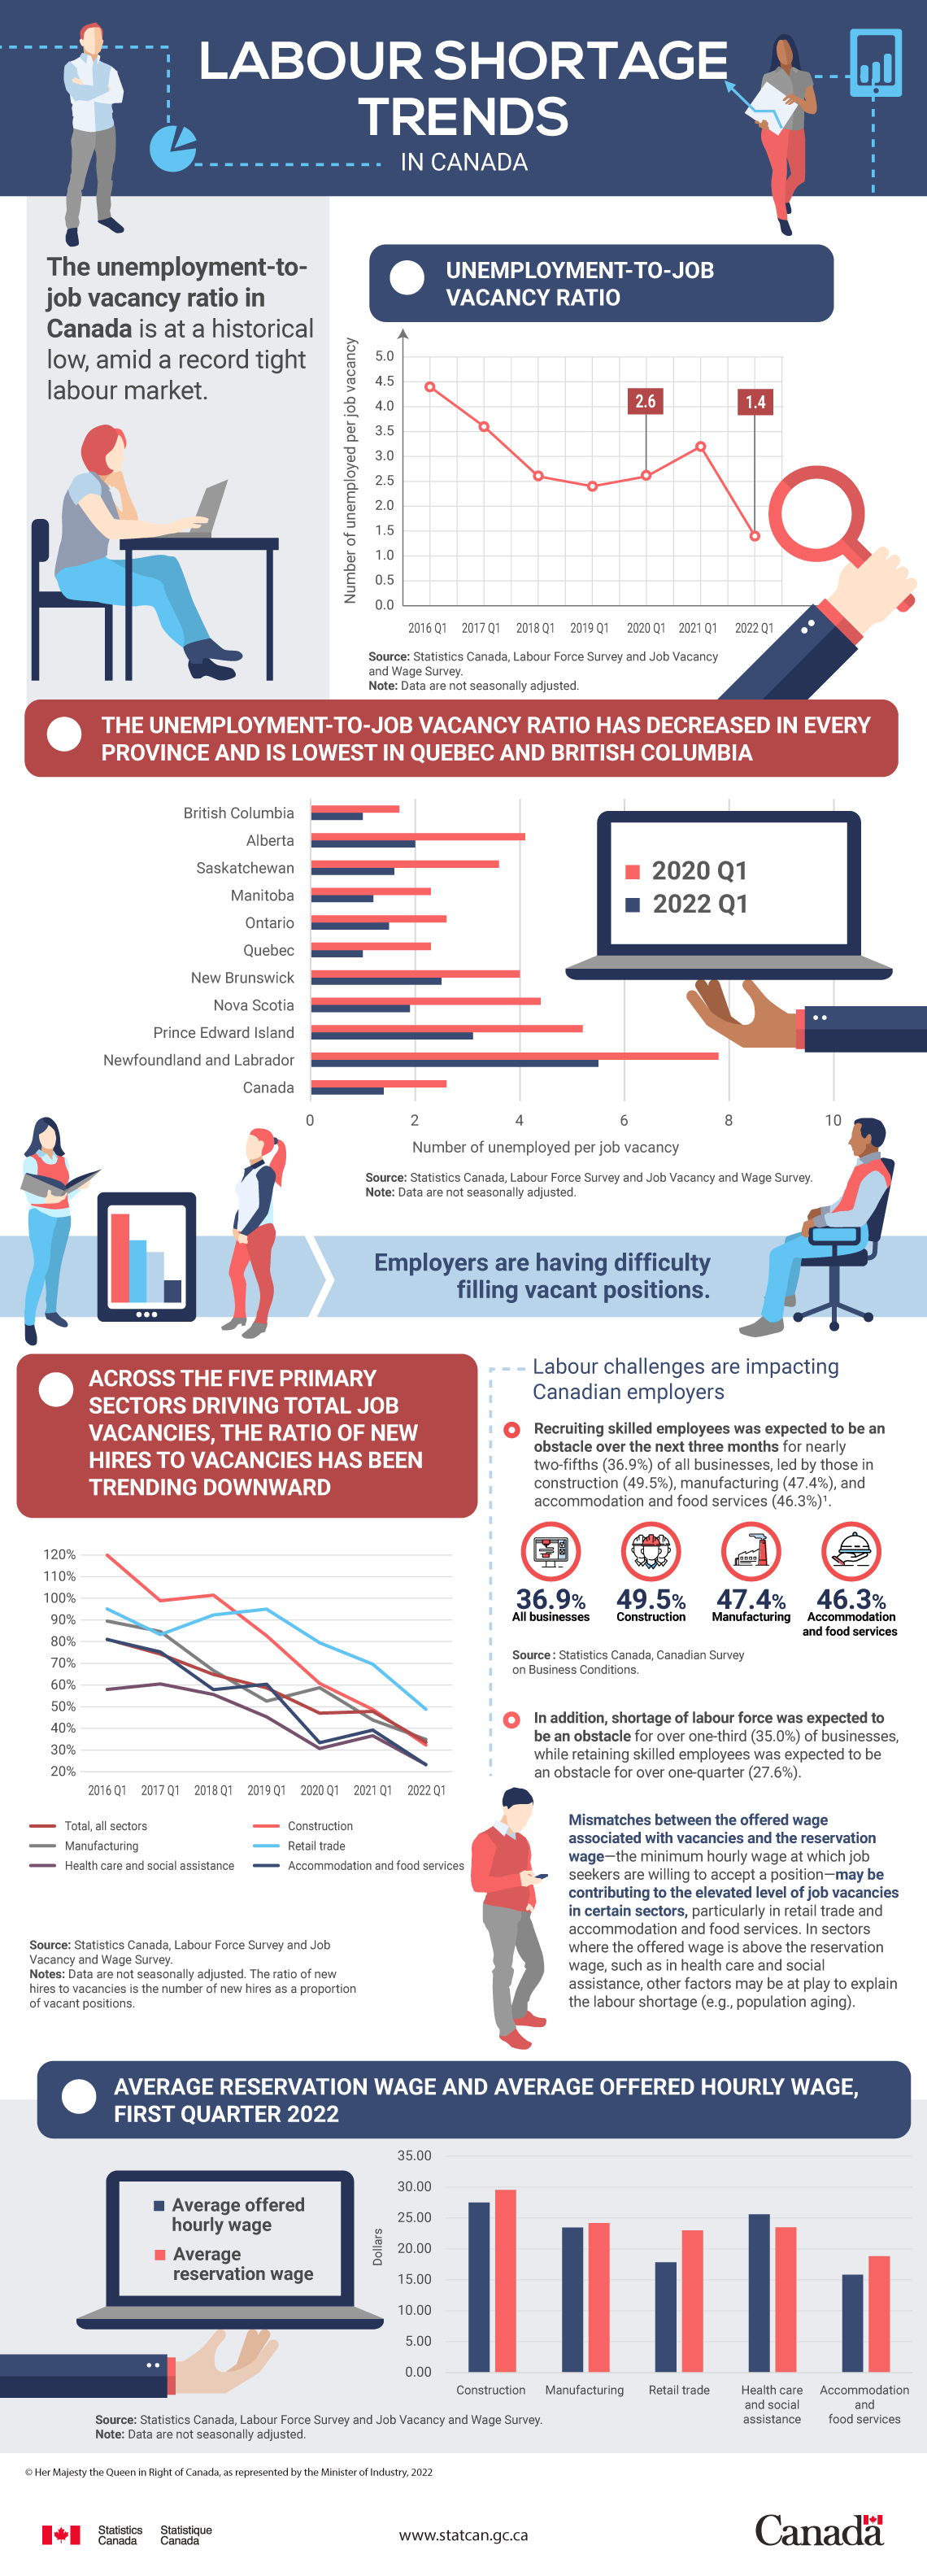
The unemployment-to-job vacancy ratio in Canada is at a historical low, amid a record tight labour market.
| Number of unemployed per job vacancy | |
|---|---|
| First quarter 2016 | 4.4 |
| First quarter 2017 | 3.6 |
| First quarter 2018 | 2.6 |
| First quarter 2019 | 2.4 |
| First quarter 2020 | 2.6 |
| First quarter 2021 | 3.2 |
| First quarter 2022 | 1.4 |
| Source: Statistics Canada, Labour Force Survey and Job Vacancy and Wage Survey. Note: Data are not seasonally adjusted. |
|
The unemployment-to-job vacancy ratio has decreased in every province and is the lowest in Quebec and British Columbia.
| Number of unemployed per job vacancy | ||
|---|---|---|
| First quarter 2020 | First quarter 2022 | |
| British Columbia | 1.7 | 1.0 |
| Alberta | 4.1 | 2.0 |
| Saskatchewan | 3.6 | 1.6 |
| Manitoba | 2.3 | 1.2 |
| Ontario | 2.6 | 1.5 |
| Quebec | 2.3 | 1.0 |
| New Brunswick | 4.0 | 2.5 |
| Nova Scotia | 4.4 | 1.9 |
| Prince Edward Island | 5.2 | 3.1 |
| Newfoundland and Labrador | 7.8 | 5.5 |
| Canada | 2.6 | 1.4 |
| Source: Statistics Canada, Labour Force Survey and Job Vacancy and Wage Survey. Note: Data are not seasonally adjusted. |
||
Employers are having difficulty filling vacant positions.
Across the five primary sectors driving total job vacancies, the ratio of new hires to vacancies has been trending downward
| First quarter 2016 | First quarter 2017 | First quarter 2018 | First quarter 2019 | First quarter 2020 | First quarter 2021 | First quarter 2022 | |
|---|---|---|---|---|---|---|---|
| Total, all sectors | 81.1% | 74.3% | 64.9% | 58.7% | 47.0% | 47.8% | 33.6% |
| Construction | 119.9% | 98.9% | 101.5% | 82.7% | 60.7% | 48.7% | 32.3% |
| Manufacturing | 89.5% | 84.7% | 66.7% | 52.6% | 58.8% | 43.9% | 34.9% |
| Retail Trade | 95.1% | 83.3% | 92.3% | 95.0% | 79.5% | 69.6% | 48.8% |
| Health care and social assistance | 58.0% | 60.5% | 55.6% | 45.3% | 30.7% | 36.6% | 23.3% |
| Accommodation and food services | 81.0% | 75.3% | 57.9% | 60.4% | 33.4% | 39.2% | 23.2% |
| Source: Statistics Canada, Labour Force Survey and Job Vacancy and Wage Survey. Note: Data are not seasonally adjusted. The ratio of new hires to vacancies is the number of new hires as a proportion of vacant positions. |
|||||||
Labour challenges are impacting Canadian employers:
- Recruiting skilled employees was expected to be an obstacle over the next three months for nearly two-fifths (36.9%) of all businesses, led by those in construction (49.5%), manufacturing (47.4%), and accommodation and food services (46.3%).
- In addition, shortage of labour force was expected to be an obstacle for over one-third (35.0%) of businesses, while retaining skilled employees was expected to be an obstacle for over one-quarter (27.6%).
Source: Statistics Canada, Canadian Survey on Business Conditions.
Mismatches between the offered wage associated with vacancies and the reservation wage—the minimum hourly wage at which job seekers are willing to accept a position—may be contributing to the elevated level of job vacancies in certain sectors, particularly in retail trade and accommodation and food services. In sectors where the offered wage is above the reservation wage, such as in health care and social assistance, other factors may be at play to explain the labour shortage (e.g. population aging).
| Average offered hourly wage | Average reservation wage | |
|---|---|---|
| Dollars | ||
| Construction | 27.50 | 29.55 |
| Manufacturing | 23.45 | 24.20 |
| Retail trade | 17.85 | 23.00 |
| Health care and social assistance | 25.60 | 23.50 |
| Accommodation and food services | 15.85 | 18.85 |
| Source: Statistics Canada, Labour Force Survey and Job Vacancy and Wage Survey. Note: Data are not seasonally adjusted. |
||