
This section provides an overview of the department's planned spending and human resources for the next three consecutive fiscal years, and compares planned spending for the upcoming year with the current and previous years' actual spending.
Planned spending
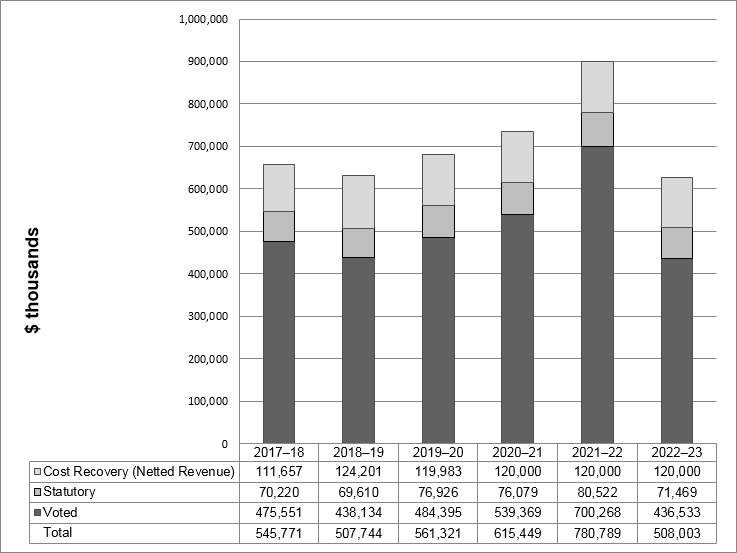
Departmental spending 2017–18 to 2022–23
The following graph presents planned (voted and statutory) spending over time.
Description - Departmental spending graph
| 2017–18 | 2018–19 | 2019–20 | 2020–21 | 2021–22 | 2022–23 | |
|---|---|---|---|---|---|---|
| Cost Recovery (Netted Revenue) | 111,657 | 124,201 | 119,983 | 120,000 | 120,000 | 120,000 |
| Statutory | 70,220 | 69,610 | 76,926 | 76,079 | 80,522 | 71,469 |
| Voted | 475,551 | 438,134 | 484,395 | 539,369 | 700,268 | 436,533 |
| Total | 545,771 | 507,744 | 561,321 | 615,449 | 780,789 | 508,003 |
| Note: Main Estimates, planned spending and full-time equivalent figures do not include Budget 2020 announcements. More information will be provided in the 2020–21 Supplementary Estimates and Departmental Results Report, as applicable. | ||||||
Statistics Canada's statutory spending, as indicated in the graph above, relates to the Employee Benefit Plan, which is a function of planned salary spending. Therefore, it fluctuates along with voted spending.
Budgetary planning summary for core responsibilities and Internal Services
The following table shows actual, forecast and planned spending for each of Statistics Canada's core responsibilities and to Internal Services for the years relevant to the current planning year.
| Core responsibilities and Internal Services | 2017–18 expenditures | 2018–19 expenditures | 2019–20 forecast spending | 2020–21 budgetary spending (as indicated in Main Estimates) | 2020–21 planned spending | 2021–22 planned spending | 2022–23 planned spending |
|---|---|---|---|---|---|---|---|
| Statistical Information | 585,363,802 | 559,559,344 | 603,165,156 | 661,506,812 | 661,506,812 | 833,218,102 | 560,266,271 |
| Internal Services | 72,064,636 | 72,385,465 | 78,138,770 | 73,941,885 | 73,941,885 | 67,571,191 | 67,736,536 |
| Total gross expenditures | 657,428,438 | 631,944,809 | 681,303,926 | 735,448,697 | 735,448,697 | 900,789,293 | 628,002,807 |
| Respendable revenue | -111,657,283 | -124,200,719 | -119,982,728 | -120,000,000 | -120,000,000 | -120,000,000 | -120,000,000 |
| Total net expenditures | 545,771,155 | 507,744,090 | 561,321,198 | 615,448,697 | 615,448,697 | 780,789,293 | 508,002,807 |
| Note: Main Estimates, planned spending and full-time equivalent figures do not include Budget 2020 announcements. More information will be provided in the 2020–21 Supplementary Estimates and Departmental Results Report, as applicable. | |||||||
Statistics Canada is funded by two sources: direct parliamentary appropriations and cost-recovery activities. Statistics Canada has the authority to generate $120 million annually in respendable revenue, related to two streams: statistical surveys and related services, and custom requests and workshops. If exceeded, a request can be made to increase authority as was the case in 2018-19.
In recent years, respendable cost-recovery revenue has contributed between $112 million and $124 million annually to the agency's total resources. A large portion of this respendable revenue comes from federal departments to fund specific statistical projects.
Spending fluctuations between the years shown in the graph and table above were mainly caused by the Census Program. Voted spending decreased in 2017–18 and 2018–19 as the 2016 Census of Population and 2016 Census of Agriculture were winding down. This pattern is typical for the agency because of the cyclical nature of the Census Program. Spending will begin to ramp up and peak again in 2021–22 when the 2021 Census of Population and 2021 Census of Agriculture are conducted.
Internal Services' spending from 2018–19 to 2020–21 includes planned resources from temporary funding related to a new initiative approved in 2018–19 to migrate the agency's workload to the cloud.
For additional details on year-over-year variances between 2017–18 and 2018–19 expenditures, see the 2018–19 Departmental Results Report available on our Reports web page.
2020–21 Budgetary planned gross spending summary
The following table reconciles gross planned spending with net planned spending for 2020–21.
| Core responsibilities and Internal Services | 2020–21 planned gross spending | 2020–21 planned gross spending for specified purpose accounts | 2020–21 planned revenues netted against expenditures | 2020–21 planned net spending |
|---|---|---|---|---|
| Statistical Information | 661,506,812 | 0 | -120,000,000 | 541,506,812 |
| Internal Services | 73,941,885 | 0 | 0 | 73,941,885 |
| Total | 735,448,697 | 0 | -120,000,000 | 615,448,697 |
| Note: Main Estimates, planned spending and full-time equivalent figures do not include Budget 2020 announcements. More information will be provided in the 2020–21 Supplementary Estimates and Departmental Results Report, as applicable. | ||||
Statistics Canada has the authority to generate $120 million annually in respendable revenue, which is reflected in the 2020–21 planned revenues netted against expenditures.
Planned human resources
The following table shows actual, forecast and planned full-time equivalents (FTEs) for each core responsibility in Statistics Canada's departmental results framework and to Internal Services for the years relevant to the current planning year.
| Core responsibilities and Internal Services | 2017–18 actual full-time equivalents | 2018–19 actual full-time equivalents | 2019–20 forecast full-time equivalents | 2020–21 planned full-time equivalents | 2021–22 planned full-time equivalents | 2022–23 planned full-time equivalents |
|---|---|---|---|---|---|---|
| Statistical Information | 5,417 | 5,498 | 5,799 | 5,800 | 6,102 | 5,255 |
| Internal Services | 607 | 645 | 651 | 585 | 580 | 580 |
| Total gross FTEs | 6,024 | 6,143 | 6,450 | 6,385 | 6,682 | 5,835 |
| Respendable revenue | -1,251 | -1,380 | -1,455 | -1,251 | -1,251 | -1,261 |
| Total net FTEs | 4,773 | 4,763 | 4,995 | 5,134 | 5,431 | 4,574 |
| Note: Main Estimates, planned spending and full-time equivalent figures do not include Budget 2020 announcements. More information will be provided in the 2020–21 Supplementary Estimates and Departmental Results Report, as applicable. | ||||||
Similar to trends seen in planned spending, FTE changes from year to year are largely explained by the cyclical nature of the Census Program. Activity decreased in 2017–18 and 2018–19 as the 2016 Census of Population and 2016 Census of Agriculture were winding down. Activity will begin to ramp up and peak again in 2021–22 when the 2021 Census of Population and 2021 Census of Agriculture are conducted.
Included in net expenditure FTEs are approximately 210 public servant FTEs based across Canada outside the National Capital Region (NCR). Also included are approximately 950 interviewer FTEs (representing approximately 1,800 interviewers) outside the NCR. These interviewers are part-time workers whose assigned workweeks are determined by the volume of collection work available; they are hired under the Statistics Act, by the authority of the Minister of Innovation, Science and Industry. Interviewers are covered by two separate collective agreements and are employed through Statistical Survey Operations. Many of Statistics Canada's main outputs rely heavily on data collection and the administration of these activities, which takes place in the regions.
Estimates by vote
Information on the Statistics Canada's organizational appropriations is available in the 2019–20 Main Estimates.
Condensed future-oriented statement of operations
The condensed future-oriented statement of operations provides an overview of the Statistics Canada's operations for 2019–20 to 2020–21.
The amounts for forecast and planned results in this statement of operations were prepared on an accrual basis. The amounts for forecast and planned spending presented in other sections of the Departmental Plan were prepared on an expenditure basis. Amounts may therefore differ.
A more detailed future-oriented statement of operations and associated notes, including a reconciliation of the net cost of operations to the requested authorities, are available on the Statistics Canada's website.
| Financial information | 2019–20 forecast results | 2020–21 planned results | Difference (2020–21 planned results minus 2019–20 forecast results) |
|---|---|---|---|
| Total expenses | 763,525,982 | 848,569,377 | 85,043,395 |
| Total revenues | 119,982,728 | 120,000,000 | 17,272 |
| Net cost of operations before government funding and transfers | 643,543,254 | 728,569,377 | 85,026,123 |
The increase in planned expenses for 2020–21 is mainly explained by the funding received for the 2021 Census of Population and 2021 Census of Agriculture.
Statistics Canada is expecting to maintain its capacity in future years for the delivery of cost-recovered statistical services, with no significant shifts in resources.