
This section provides an overview of the department's planned spending and human resources for the next three fiscal years and compares planned spending for 2022–23 with actual spending for the current year and the previous year.
Planned spending
Departmental spending 2019–20 to 2024–25
The following graph presents planned (voted and statutory) spending over time.
Departmental spending graph
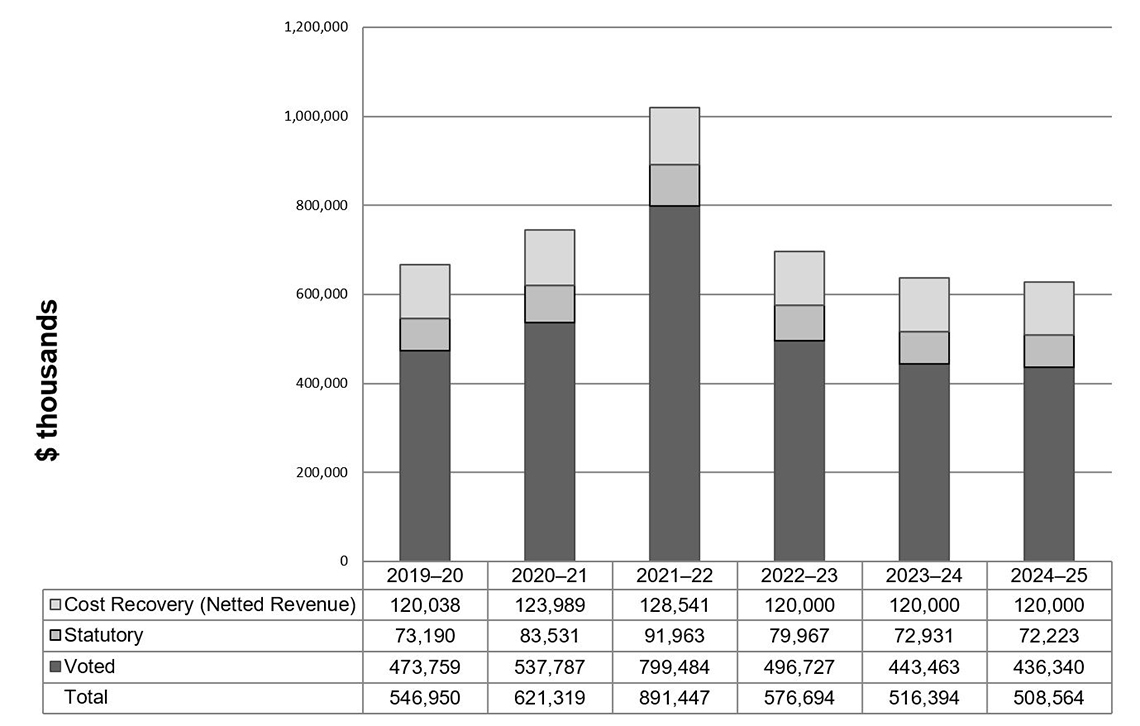
Description - Departmental spending graph
| Fiscal year | Total | Voted | Statutory | Cost Recovery (Netted Revenue) |
|---|---|---|---|---|
| 2019–20 | 546,950 | 473,759 | 73,190 | 120,038 |
| 2020–21 | 621,319 | 537,787 | 83,531 | 123,989 |
| 2021–22 | 891,447 | 799,484 | 91,963 | 128,541 |
| 2022–23 | 576,694 | 496,727 | 79,967 | 120,000 |
| 2023–24 | 516,394 | 443,463 | 72,931 | 120,000 |
| 2024–25 | 508,564 | 436,340 | 72,223 | 120,000 |
| Core responsibilities and internal services | 2019–20 actual expenditures | 2020–21 actual expenditures | 2021–22 forecast spending | 2022–23 budgetary spending (as indicated in Main Estimates) | 2022–23 planned spending | 2023–24 planned spending | 2024–25 planned spending |
|---|---|---|---|---|---|---|---|
| Statistical information | 584,770,894 | 666,463,788 | 916,348,261 | 616,663,357 | 616,663,357 | 560,200,355 | 555,042,606 |
| Internal services | 82,217,225 | 78,844,148 | 103,639,261 | 80,030,892 | 80,030,892 | 76,193,902 | 73,521,068 |
| Total gross expenditures | 666,988,119 | 745,307,936 | 1,019,987,522 | 696,694,249 | 696,694,249 | 636,394,257 | 628,563,674 |
| Respendable revenue | -120,038,495 | -123,989,068 | -128,540,649 | -120,000,000 | -120,000,000 | -120,000,000 | -120,000,000 |
| Total net expenditures | 546,949,624 | 621,318,868 | 891,446,873 | 576,694,249 | 576,694,249 | 516,394,257 | 508,563,674 |
Statistics Canada is funded by two sources: direct parliamentary appropriations and cost-recovery activities. It has the authority to generate $120 million annually in respendable revenue, related to two streams: statistical surveys and related services, and custom requests and workshops. If exceeded, a request can be made to increase the authority, as was the case in the last few years.
In recent years, respendable cost-recovery revenue has contributed between $120 million and $128 million annually to the agency's total resources. A large portion of this respendable revenue comes from federal departments to fund specific statistical projects.
Spending fluctuations between the years shown in the graph and table above were mainly caused by the Census Program. Voted spending peaked in 2021–22, when the 2021 Census of Population and 2021 Census of Agriculture were conducted, and decreases sharply thereafter as these activities wind down. This pattern is typical for the agency because of the cyclical nature of the Census Program. Funding for the 2026 Census of Population and the 2026 Census of Agriculture has not yet been approved, amplifying the decrease in the overall Census Program funding.
In addition, funding received for several new initiatives from Budget 2021 decreases from 2022–23 to 2023–24 and remains relatively the same in 2024–25.
Internal services spending from 2018–19 to 2021–22 includes planned resources from temporary funding related to a new initiative approved in 2018–19 to migrate the agency's infrastructure to the cloud. The decrease in funding for outer years is largely attributable to how the agency strategically manages its investments. They are managed centrally, by priority, within the statistical information core responsibility. Investment funding from past years will come to an end in future years, while new investment decisions will be finalized only later in the year.
| Core responsibilities and internal services | 2022–23 gross planned spending | 2022–23 planned revenues netted against spending | 2022–23 planned net spending |
|---|---|---|---|
| Statistical information | 616,663,357 | -120,000,000 | 496,663,357 |
| Internal services | 80,030,892 | 0 | 80,030,892 |
| Total | 696,694,249 | -120,000,000 | 576,694,249 |
Statistics Canada has the authority to generate $120 million annually in respendable revenue, which is reflected in the 2022–23 planned revenues netted against expenditures.
Planned human resources
The following table shows information on human resources, in full-time equivalents (FTEs), for each of Statistics Canada's core responsibilities and for its internal services for 2022–23 and the other relevant years.
| Core responsibilities and internal services | 2019–20 actual full-time equivalents | 2020–21 actual full-time equivalents | 2021–22 forecast full-time equivalents | 2022–23 planned full-time equivalents | 2023–24 planned full-time equivalents | 2024–25 planned full-time equivalents |
|---|---|---|---|---|---|---|
| Statistical information | 5,595 | 6,099 | 7,398 | 5,889 | 5,387 | 5,367 |
| Internal services | 626 | 684 | 684 | 659 | 642 | 615 |
| Total gross full-time equivalents | 6,221 | 6,783 | 8,082 | 6,548 | 6,029 | 5,982 |
| Respendable revenue | -1,366 | -1,340 | -1,554 | -1,181 | -1,181 | -1,181 |
| Total net full-time equivalents | 4,856 | 5,443 | 6,528 | 5,367 | 4,848 | 4,801 |
Similar to trends seen in planned spending, changes in full-time equivalents from year to year are largely explained by the cyclical nature of the Census Program. Activity peaked in 2021–22, when the 2021 Census of Population and 2021 Census of Agriculture were conducted, and decreases sharply thereafter as these activities wind down.
Estimates by vote
Information on Statistics Canada's organizational appropriations is available in the 2022–23 Main Estimates.
Future-oriented condensed statement of operations
The future oriented condensed statement of operations provides an overview of Statistics Canada's operations for 2021–22 to 2022–23.
The forecast and planned amounts in this statement of operations were prepared on an accrual basis. The forecast and planned amounts presented in other sections of the Departmental Plan were prepared on an expenditure basis. Amounts may therefore differ.
A more future oriented statement of operations and associated notes, including a reconciliation of the net cost of operations with the requested authorities, are available on Statistics Canada's website.
| Financial information | 2021–22 forecast results | 2022–23 planned results | Difference (2022–23 planned results minus 2021–22 forecast results) |
|---|---|---|---|
| Total expenses | 1,145,859,783 | 830,619,454 | -315,240,329 |
| Total revenues | 128,540,649 | 120,000,000 | -8,540,649 |
| Net cost of operations before government funding and transfers | 1,017,319,134 | 710,619,454 | -306,699,680 |
The decrease in planned expenditures for 2022–23 is primarily due to the planned reduction in spending on the Census Program, which is cyclical in nature and for which collection activities were completed in 2021–22.
Statistics Canada expects to maintain its capacity in future years for the delivery of cost-recovered statistical services, with no significant shifts in resources.