
Evaluation Report
June 2019
- The report in short
- What is covered
- 1.1 The client service delivery environment at Statistics Canada
- 1.2 Evaluation
- What we learned
- 2.1 A portrait of Statistics Canada's clients
- 2.2 The Client Relationship Management System
- 2.3 Other factors affecting efficiency and effectiveness
- How to improve client service delivery
- Management response and action plan
- Appendix 1: Statistics Canada's client services delivery
- Appendix 2: Standards of Service to the Public
- Appendix 3: Gender-based Analysis Plus
Initialisms
- ACS
- Assistant Chief Statistician
- CRMS
- Client Relationship Management System
- DG
- Director General
- INEGI
- National Institute of Statistics and Geography (Mexico)
- LOA
- Letter of agreement
- RDC
- Research data centre
- SIS
- Statistical Information Service
- SMA
- Subject-matter area
- SN
- Statistics Netherlands
- TBS
- Treasury Board Secretariat
- WG
- Working group
The report in short
Client service delivery at Statistics Canada (the agency) takes place through a network of units that respond to client requests for products and services. The main units in the network are the central contact centre, regional offices, subject-matter divisions, the media line and the microdata access network. These units are responsible for managing enquiries and providing services according to the agency's service standards.
The Client Relationship Management System (CRMS) is the corporate system in which client information can be stored and shared throughout the agency. It also performs several other functions, including invoicing, performing credit checks and creating letters of agreement.
The Evaluation of Client Service Delivery was conducted in accordance with the Treasury Board Secretariat's Policy on Results (2016) and Statistics Canada's Risk-Based Audit and Evaluation Plan (2018/2019 to 2022/2023). The primary objective of the evaluation was to provide a neutral, evidence-based analysis of the relevance and performance of the agency's client service delivery environment in support of decision making, accountability and improvement. This was the first cross-functional evaluation for Statistics Canada.
The evaluation methodology consisted of a document review, a review of administrative data from the CRMS, key informant (external client) interviews, an online survey of external clients, an internal survey of CRMS users and managers and an international scan. The triangulation of these data collection methods was used to arrive at the overall evaluation findings. An international scan of client service delivery practices of selected statistical agencies was also conducted.
Efficiency and effectiveness
The evaluation found that clients of Statistics Canada want fast, reliable, consistent, transparent and professional service at a reasonable cost. Clients reported that they were satisfied with the professionalism of staff and the quality of the information and services provided. Staff were recognized as knowledgeable, competent and courteous.
Clients were generally satisfied with the handling of simple requests; however, more complex requests (including those for customized products and expert advice) were sometimes difficult. Consistency, transparency, timeliness, communication and cost of services were all areas that needed to be improved.
These areas of dissatisfaction could mostly be traced to fundamental gaps in the agency: a lack of clarity around roles and responsibilities for client service delivery, inconsistent processes and alternative systems resulting in a fragmented delivery of services, and gaps in corporate governance and leadership with respect to client service delivery.
Recommendation 1
The Assistant Chief Statistician (ACS) of Strategic Engagement and Communications, in collaboration with the ACS of Census, Regional Services and Operations and the ACS of Corporate Services, should ensure that an agency-wide client service delivery strategy or plan is developed that covers governance and leadership, agency-level objectives, standards including targets, performance measures, roles and responsibilities, and communications. The strategy should focus on creating a more holistic and consistent approach that addresses the various issues highlighted during the evaluation, such as timeliness, transparency, consistency and costs.
Client Relationship Management System
The CRMS is the client service delivery solution for the agency. Users reported that while it handled simple requests and billing well, complex requests were a challenge. The evaluation found that business processes varied across the agency, leading to an inconsistent use of the system; that the use of alternative systems or software was widespread; that managers had generally low awareness of the CRMS; and that no one was accountable for ensuring the full adoption of the system.
Recommendation 2
The ACS of Strategic Engagement and Communications, in collaboration with the ACS of Census, Regional Services and Operations and the ACS of Corporate Services, should ensure that the agency's new CRMS is aligned to the strategy in Recommendation 1 and thus supports a more holistic and consistent approach.
Recommendation 3
The ACS of Strategic Engagement and Communications, in collaboration with the ACS of Census, Regional Services and Operations and the ACS of Corporate Services, should ensure that the quality and coverage of information in the CRMS are improved, and the awareness among managers about the CRMS is increased.
What is covered
The evaluation was conducted in accordance with the Treasury Board Secretariat's Policy on Results (2016) and Statistics Canada's Risk-Based Audit and Evaluation Plan (2018/2019 to 2022/2023). The primary objective of the evaluation was to provide a neutral, evidence-based analysis of the relevance and performance of the agency's client service delivery environment in support of decision making, accountability and improvement. This was the first cross-functional evaluation for the agency.
1.1 The client service delivery environment at Statistics Canada
The client service delivery environment at Statistics Canada is composed of two main parts: the client service delivery network and the Client Relationship Management System (CRMS).
1.1.1 The client service delivery network
The agency is organized based on a professional services model with multiple customer service pathways delivered by service entities with functional or portfolio-based service delivery responsibilities. The main organizational units at Statistics Canada are the contact centre, regional offices, subject-matter areas (SMAs) in Ottawa, the media line, and the microdata access network. These organizational units are responsible for managing enquiries and providing services according to the agency's service standards.
Classification of requests
- Tier 1: A request for information that is readily available from Statistics Canada's website or that requires minimal research.
- Tier 2: A request that requires research, extraction or customization of data.
- Tier 3: Complex methodological questions or custom tabulations that can be responded to only by a SMA.
Within this decentralized structure, each function (subject-matter divisions and regional offices) has its own or shared client service unit. Each one is responsible for organizing itself according to the resources available, the volume of requests, the expertise required to respond to requests and the level of knowledge of client service representatives (generalists or experts). The structure requires extensive information exchange between functions to coordinate and route requests based on the required level of expertise (see Figure 1). For the 2017/2018 fiscal year, revenues from custom requests and workshops were approximately $3.4 million.Footnote 1
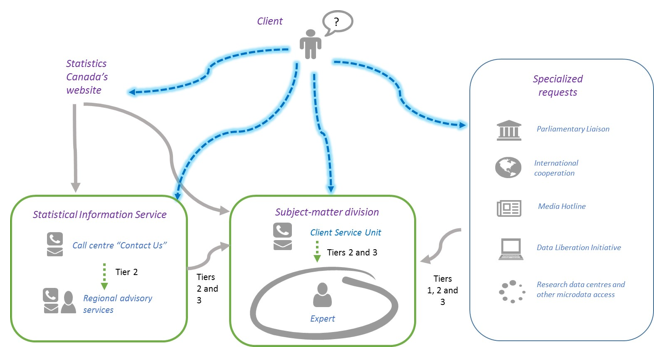
Description for Figure 1 - Statistics Canada's Current Client Service Delivery Network
The figure depicts the client service delivery network for Statistics Canada and how various units are intertwined. The figure includes four main delivery units through which a client request can flow through Statistics Canada. The units are: Statistics Canada's website, the Statistical Information Service, the subject matter division, and finally a grouping serving specific users.
The figure shows the client at the top and four separate paths through which a request can be submitted.
One path goes to the Statistics Canada Website. From there arrows go to the Statistical Information Service which includes the call centre ('Contact Us') and Regional Advisory Services for tier 2 requests and subject matter divisions which include client service units and experts for tier 2 and tier 3 requests. There is also an arrow from the Statistical Information Service to the subject matter divisions as tier 2 and tier 3 requests originally sent to the Statistical Information Service may be referred to a subject matter division.
Two other paths are that clients can also send requests directly to the Statistical Information Service or subject matter divisions without first going through the website.
For the final path, specific users can also go to units serving specialized audiences. This includes: the Parliamentary Liaison unit, the International Cooperation unit, the Media Hot Line, the Data Liberation Initiative, the Research Data Centre and other microdata access group. These units send their requests to subject matter divisions for response.
Planned changes
During the planning phase of the evaluation, the agency announced it would be making changes to its client service delivery model. Regional offices would be rebranded as data service centres, which would provide services and expertise in close proximity to clients. The centres would offer a fully integrated client service program of data access, learning and outreach services. In addition, all Tier 2 requests would eventually be handled within the regional organizational structure. This change would allow subject-matter divisions to concentrate their efforts on data production, management of their respective programs and Tier 3 requests. The model aligns with a main pillar of the agency's modernization initiative—user-centric service delivery—where "users have the information and data they need, when they need it, in the way they want to access it, with the tools and knowledge to make full use of it."
1.1.2 The Client Relationship Management System
In 2007, the CRMS was launched to manage and record day-to-day client service activities in real time. The system was to be the organizational tool for managing all client information, eliminating inefficiencies and duplication arising from the many systems (approximately 15) that were in place prior to the CRMS. When it was implemented, the CRMS included only the client services module and was expected to
- promote the sharing of client information across divisions to eliminate existing silos
- improve employee productivity and service quality
- ensure client satisfaction and adherence to client service policies
- produce consistent performance indicators for all sectors involved in client service delivery
- promote information gathering to support management and decision making.
Over time, the CRMS has been modified and customized with over 1,500 new configurations, including the addition of five modules with and without links to client service delivery (see Figure 2). In 2010, two new modules were added: one to help research data centres manage information about external researchers with access to microdata, and another to manage respondent relations issues and complaints related to business survey respondents. In 2015, a module was added to manage cost-recovery activities, letters of agreement (LOAs) and memorandums of understanding. The system is used by subject-matter division staff; the Statistical Information Service (SIS); regional offices; the Finance, Planning and Procurement Branch; the Media Relations Unit; the Microdata Access and CDER Division; and the ombudsman for business surveys. The system falls under the responsibility of the Strategic Communications and Outreach Division. For fiscal year 2018/2019, approximately $385,000 was spent for the management and maintenance of the system through the CRMS team.Footnote 2 The system is currently under review as it is built on an outdated PeopleSoft platform.
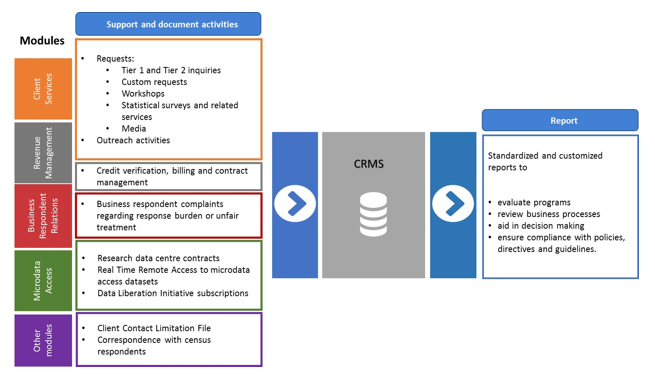
Description for Figure 2 - Client Relationship Management System functionalities
The figure depicts the modules and activities for the client relationship management system (CRMS). The figure begins on the left with the 5 modules of CRMS, next is a column listing the support and document activities related to the modules, these activities then feed into the CRMS system which can then produce reports.
The 5 modules are: client services, revenue management, business respondent relations, microdata access, other modules.
Support and document activities includes: related to client services - requests (tier 1 and tier 2 enquiries, custom requests, workshops, statistical surveys and related services, media) and outreach activities; related to revenue management – credit verification, billing and contract management; related to business respondent relations – business respondent complaints regarding response burden and/or unfair treatment; related to microdata access – Research Data Centre contracts, Real Time Remote Access to datasets; Data Liberation Initiative subscriptions; related to other modules – Client Contract Limitation File, correspondence with census respondents.
CRMS can produce standardized and customized reports which can be used to evaluate programs, review business processes, aid in decision making, and ensure compliance with policies, directives and guidelines.
1.2 Evaluation
In designing the evaluation, several factors were taken into consideration, such as the nature of the client service delivery model and the changing context. A hybrid approach based on the principles of developmental evaluation and utilization-focused evaluation was ultimately used.Footnote 3
A discussion with senior management identified three issues to be addressed in the evaluation (see Issues and evaluation questions). To answer these questions, several methods were used to ensure the reliability of the findings and to mitigate any limitations (see Collection tools, limitations and mitigation measures).
Issues and evaluation questions
- Issue 1: The needs, expectations and level of satisfaction of clients regarding the delivery of services
- What are the needs, expectations and level of satisfaction with client services?
- What is the level of interest in data service centres and the delivery of in-person services?
- Issue 2: The Client Relationship Management System
- How well does the CRMS respond to the needs of users?
- What are the barriers and challenges that have an impact on the utilization of the system?
- Issue 3: The factors contributing to the effectiveness of the client service delivery program
- What are the factors that have an impact on the effectiveness of service delivery?
Collection tools, limitations and mitigation measures
Administrative reviews
Administrative data from the CRMS, the 2017 client survey conducted by Statistics Canada, and results from the consultation week activities that took place in November 2018.
Literature review
Published reports, peer-reviewed journal articles, grey literature, websites and periodicals relating to concepts and theories about service delivery, and client experiences and satisfaction.
International scan
Analysis of client service delivery models in other national statistical organizations. Countries included
- Mexico
- Australia
- the United Kingdom
- the Netherlands.
Service delivery survey 1,294 respondents
Electronic survey with clients who contacted the agency for enquiries in 2018 (based on the CRMS). The survey took place between November 13 and December 3, 2018. The response rate was 28.3%.
- Federal government (n=313)
- Provincial and territorial governments (n=234)
- Municipalities (n=120)
- Private sector (including the media) (n=273)
- Non-governmental organizations (n=139)
- Academic sector (n=193)
- Union associations and groups (n=4)
- General public (n=18)
This group will be referred to as "respondents."
Key informant interviews 67 interviewees
Individual and semi-structured group interviews
External (n=29)
- Federal government (n=3)
- Provincial and territorial governments (n=7)
- Municipalities (n=5)
- Private sector (n=6)
- Non-governmental organizations (n=5)
- Academic sector (n=3)
Internal (n=38)
This group will be referred to as "interviewees."
Document review
Internal strategic documents.
Internal survey 25 respondents
Two internal surveys on the CRMS were conducted between February 5 and February 12, 2019, via email and online. Survey of CRMS operational users
- 14 respondents for a response rate of 26.9%
Survey of directors
- 11 respondents for a response rate of 35.5%
This group will be referred to as "users" and "managers."
| Limitations | Mitigation Strategies |
|---|---|
| CRMS data quality The CRMS provides only a partial picture. This is due to functionality limitations and inconsistent use of the system. |
External survey An external survey and linkage were used to validate the CRMS data quality. |
| External survey response rate The response rate for typical external surveys is relatively low (between 10% and 15%). |
Survey design The sample size was increased and supporting materials were adjusted. The final response rate was 28.3%. |
| Internal interviews The degree of familiarity with the CRMS varied according to the experience of the respondent and the nature of the tasks. This may have impacted the views of respondents. |
Internal survey and document review Interview results were triangulated with the results of an internal survey and a document review on the CRMS to ensure adequate representation and substantiate the views provided by interviewees. From a total of 37 divisions that are using the CRMS, respondents from 25 divisions provided their perspectives on the CRMS. |
What we learned
2.1 A portrait of Statistics Canada's clients
Evaluation questions
What are the needs, expectations and level of satisfaction with client services?
What is the level of interest in data service centres and the delivery of in-person services?
A client-centric organization must first and foremost have a clear understanding of the needs and expectations of clients.Footnote 4 A lack of understanding of client needs and expectations can result in clients being dissatisfied, the loss of clients, and wasted expenditures on products and services that are not relevant. Therefore, as part of the evaluation and given the context around modernization and user-centric service delivery, it was essential to first understand the needs and expectations of clients.
2.1.1 Statistics Canada's clientele and service requests
In 2018, 34,743 external requests were recorded in the CRMS.Footnote 5 Statistics Canada has a diverse client base with a wide range of technical skills. According to the service delivery survey, a large portion are from the public sector (60.0%) and can be found in Ontario (Toronto), Quebec (Montréal and the city of Québec) and the National Capital Region (Ottawa–Gatineau). The client base contacted the agency, on average, two to five times over a 12-month period. The main points of entry were the call centre ("Contact Us") (46.2%), subject-matter divisions (22.0%) and the regional offices (14.4%). The most frequent requests were for help finding data on the website and using online tools (16.7%), paid customized data (16.3%), and expert advice (15.4%).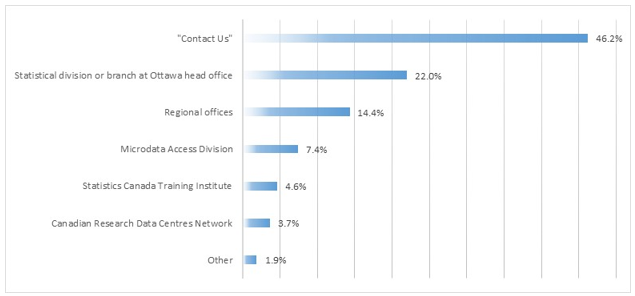
Description for Figure 3 - Entry points for data or service requests
The bars show the proportion of requests arising from the listed entry points.
| Entry points | percentage |
|---|---|
| "Contact Us" | 46.2 |
| Statistical division or branch at Ottawa head office | 22.0 |
| Regional offices | 14.4 |
| Microdata Access Division | 7.4 |
| Statistics Canada Training Institute | 4.6 |
| Canadian Research Data Centres Network | 3.7 |
| Other | 1.9 |
Figure 4 Types of requests
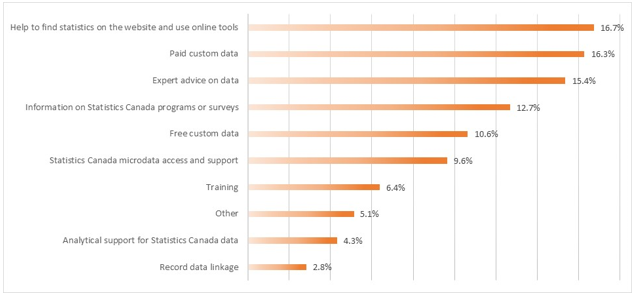
Description for Figure 4 - Types of requests
The bars show the types of request received as a percentage of the total requests.
Data for Figure 4:
| Types of Requests | percentage |
|---|---|
| Help to find statistics on the website and use online tools | 16.7 |
| Paid custom data | 16.3 |
| Expert advice on data | 15.4 |
| Information on Statistics Canada programs or surveys | 12.7 |
| Free custom data | 10.6 |
| Statistics Canada microdata access and support | 9.6 |
| Training | 6.4 |
| Other | 5.1 |
| Analytical support for Statistics Canada data | 4.3 |
| Record data linkage | 2.8 |
2.1.2 Client expectations around service delivery
Clients expect service that is expedient, easy to access, reliable, transparent, consistent, professional and reasonably priced. The evaluation found that Statistics Canada met the needs of clients in terms of being reliable, professional and, to a certain degree, easy to access. On the other hand, cost (value), transparency, consistency and expediency were all found to be lacking.Footnote 6
Staff are professional and courteous
The majority of respondents and interviewees were satisfied with the skills and professionalism of staff, as well as their dedication to and courtesy in providing services. According to the client survey conducted by the agency in 2018, 95.5% of respondents were satisfied with the courteous and respectful attitude of staff, and 88.4% were satisfied with the staff's understanding of their requirements.Footnote 7 Respondents to the service delivery survey noted that if and when an issue arose, it was the professionalism demonstrated by staff in resolving the issue that contributed to maintaining trust. Even respondents who were frustrated with some of their experiences made a clear distinction between the service they received and the person or people providing the service. Problems were rarely attributed to a person, but rather to the processes in place. Respondents and interviewees highlighted the value they placed on the service provided by the person with whom they did business and their preference in having the same person to work with on a consistent basis, allowing them to build a professional relationship.
Finding the right person is not always easy; customized products take too long
Respondents and interviewees reported the need to access data, including customized data, expeditiously, both through the website and through client services staff. Their expectations for delivery timelines varied based on their level of urgency and their familiarity with the client services process. It was clear from the evaluation that the higher the number of client service touchpoints required, the lower the level of satisfaction.
According to the client service delivery survey, 88.4% of respondents were satisfied with the level of access to services, and nearly 80.2% reported that they were satisfied with response times for their requests. Among the points of dissatisfaction noted by respondents and interviewees, however, was the amount of time it took to arrive at the right point of contact who could answer their query, especially when trying to access a subject-matter expert. When asked about the published service standards, interviewees indicated that they were satisfied with the service standards around timeliness and that the agency generally met them.Footnote 8 Only a few cases of non-compliance were raised, usually related to phone calls.
Several respondents and interviewees expressed dissatisfaction with the amount of time taken between the submission of a request for customized data and receipt of the final product. Interviewees indicated that they understood time was needed to process and clarify specifications for the initial request and to determine its feasibility; however, some found this phase rather onerous. The evaluation found that this time period could take anywhere from a few days to many months, depending on the complexity of the request and the number of areas involved. The time required tended to be much shorter for a simple renewal, if variables had been predetermined, or in cases where the client had a deep knowledge of the data. The requests reported as being unsatisfactory the most by respondents and interviewees were those for the Census of Population, where some indicated that they still had not received their tabulations after waiting six months. They noted that the delay had significantly impacted their projects.
Internal interviewees indicated that once a purchase confirmation was received, the usual delivery time was four to six weeks, depending on the complexity of the request and the size of the production queue. Delivery times could vary, however, because of resource constraints (e.g., employee absences), changes in priorities and delays caused by other requests. They indicated that the ability to accelerate things even at additional cost was not possible.
The more people involved, the longer it takes
Speed of service and ease of access are closely linked. As mentioned previously, the amount of time it takes to fulfill a service request increases with the number of points of contact—the more people the request goes through, the longer it takes.
Some requests pass through an intermediary (for example, a regional office) that then serves as the primary contact point throughout the process until the service or product is delivered. The intermediary takes on a coordination function and facilitates communication between the requester and the end provider. Interviewees generally appreciated their interactions with intermediaries; however, they found at times that it added unnecessary steps and increased the response time. For example, some interviewees were able to communicate with experts only indirectly through the intermediary. This added an extra step and wait time, while often providing little or no value added. Some interviewees indicated that they sometimes prematurely terminated exchanges despite still having questions because it was taking too long or they no longer had the patience to wait for a response. Others indicated that they located contact information for experts on their own to avoid going through an intermediary.
Internal interviewees noted that delays can vary depending on the availability of experts, the timing of the request, the amount of time and effort required to respond to the request, and the impact on other activities of the division. In cases where the experts were unable to respond to the request in the timeframe required, they simply referred the client to information available on the website.
More than half of internal interviewees indicated that there are opportunities to improve the speed of services and the ability to respond to requests. Aside from adding resources, suggestions included greater access to up-to-date methodological documents, more detailed documentation of available variables for surveys, a repository of past requests and a question-and-answer-style (knowledge management) document that would help service units respond to cases without burdening subject-matter experts.
Some interviewees, including some frequent data users, were unaware of the various options available for accessing services and for making data requests. Some indicated that they believed the "Contact Us" module on the website was the only point of entry for all requests; they did not realize that they could contact a regional office advisor directly.
Lack of consistency with pricing and spotty updates
According to the 2017 client survey, 30.6% of respondents who had purchased products and services for less than $20,000 were dissatisfied with the cost (purchases between $1 and $1,000, 27.2%; purchases between $1,000 and $20,000, 33.3%). During the interviews, while several interviewees recognized the efforts Statistics Canada had made over time to increase the number of products available for no charge, there remained a strong desire for even more free data.
A lack of consistency in the pricing of customized products was raised as an issue by respondents and interviewees. Some examples included unexplained increases or decreases for identical requests from one year to the next, and a lack of consistency in pricing between client types and from one division to another within Statistics Canada. These led to a perception among some interviewees that there is a lack of fairness in the pricing of customized tabulations.
For respondents and interviewees who had purchased customized tabulations, several indicated that they were provided with little information about the progress of their order and were not informed of delays unless they took the initiative to follow up. Some interviewees mentioned there was a lack of consistency between the divisions they dealt with: some divisions were more responsive and client-focused than others.
Consistency and transparency are vital for managing the expectations of clients. Interviewees indicated that they wanted to be informed of what to expect from the agency, before and during service delivery. However, other than the standards of service published on the Statistics Canada website, no evidence was found of any other standards. In addition, potential purchasers of custom tabulations received little information on estimated delivery dates prior to the agreement phase.
Satisfied with quality
According to the 2017 client survey, the majority of respondents were satisfied overall with the quality of the products and services they received. Based on the client service delivery survey and interviews, in cases where there was dissatisfaction, the most common issues involved instances of not receiving timely responses to initial requests, errors in customized tables, products that were late and incomplete products or answers.
Client profiles to better understand users
Statistics Canada serves a broad spectrum of users, ranging from highly sophisticated technical users to users with little statistical knowledge and expertise. The needs of these users from a client service delivery point can vary greatly. For example, clients who are data experts or key stakeholders require direct access to subject-matter experts. Service units, such as regional offices or the SIS, can provide some level of service to these clients, but regular and direct access to SMAs is imperative. In contrast, clients who only occasionally use the Statistics Canada website to find information and have a limited knowledge of the available data holdings can benefit from interacting with a representative who can help them navigate through the various options available.
To better respond to their users, the Office for National Statistics (United Kingdom) and the National Institute of Statistics and Geography (INEGI, Mexico) developed client profiles to better understand their clients and ensure that the design of their services meets the needs and expectations of various user types. In January 2019, Statistics Canada's Communications and Dissemination Branch developed client profiles based on purchasing habits, level of knowledge and understanding, and website experience. These profiles could be extended to include client service delivery.
2.1.3 Data service centres and service expectations
A key objective of the evaluation was to assess interest in alternative modes of access to data and services, including the creation of data service centres. The majority of clients interviewed for the evaluation indicated that the current service channels, including the website, were adequate and that available resources would be better spent on improving existing services rather than adding new ones.
When respondents were asked about the types of service delivery mechanisms they preferred, 20.7% indicated that their preference included the offering of services at a dedicated Statistics Canada data service centre. A far greater percentage preferred access using remote services only (77.8%), such as phone, email or other technologies. This pattern was consistent regardless of the respondent's city of residence. As explained during interviews, proximity and convenience were key factors for clients. For example, interviewees in the Toronto area mentioned that they would rarely use a Toronto data centre given the inconveniences related to travel and parking. Other municipal interviewees indicated that data service centres would need to be located within one hour of their location for them to even consider making a trip. One exception to this, however, is training—especially if it could not be obtained online or via video conference. Of further note, however, interviewees in some smaller municipalities indicated interest in having a Statistics Canada representative visit them occasionally over the course of a year.
| Service delivery mechanism | Number of respondents | |
|---|---|---|
| number | percentage | |
| Data service centres only | 143 | 11.1 |
| Data service centres and remote services | 110 | 8.5 |
| Data service centres and other | 14 | 1.1 |
| Remote services only | 1,004 | 77.8 |
| Other | 19 | 1.5 |
| Total | 1,290 | 100.0 |
In terms of specific services, respondents and interviewees indicated that they would consider using data service centres if they provided access to experts or access to microdata. If such services were available, these clients indicated that they would potentially use the centres two to five times per year. Respondents and interviewees also positively viewed the provision of statistical training and an advisory service by statistical experts who could help them navigate the myriads of data available, as well as statistical concepts and methods.
Interviewees responded positively to the idea of having a dedicated account manager who would be familiar with their needs and who could efficiently and effectively address all their requests, regardless of subject matter. Many interviewees, in fact, had already developed such a relationship with a regional consulting analyst or a subject-matter expert.
New technologies—hit and miss
When asked about whether or not Statistics Canada should invest in new client service options based on new technologies such as mobile apps, text messaging, social media and artificial intelligence, many respondents and interviewees expressed ambivalence about the utility of these types of tools. This did not vary by age group. Respondents and interviewees noted that it would be difficult to view data tables and charts on a mobile device, and conducting data searches online is also somewhat restricted by screen size.
One potential type of new technology that was viewed relatively more positively (16.1% positive) was an online chat functionality. Respondents and interviewees indicated such a service would be beneficial as long as they could receive faster responses compared with traditional modes, and as long as the chat service included the ability to chat directly with an expert.Footnote 9
The tools that received the highest level of interest were self-service data access tools and remote access to training. Respondents and interviewees wanted access to existing customized tables via the website for free, as well as the ability to create their own customized and semi-customized tables online. Interviewees believed a period of six months after the initial delivery of a customized table was appropriate before it was made available for free. They were generally open to the idea of sharing customized requests after a given period of time. Respondents and interviewees also wanted tools that would allow them to create their own visualizations. These last several items demonstrate that satisfaction with the delivery of client services is tied in many respects to the types of tools and information available to users.Footnote 10
2.1.4 Client service delivery and client needs
For most of these clients, dissatisfaction was centred on two key areas: lack of detailed data for specific topics,Footnote 11 for certain levels of geography and for historical time series; and limited microdata access. They also noted that greater efforts could be made around promoting the agency's products and services to raise awareness of the depth and breadth of information that is available. They commented that it was sometimes challenging to figure out whether something was available or not. This resulted in wasted effort searching for data and the submission of requests for things that simply did not exist—essentially, a waste of their time.
The Statistics Canada website, most notably the search engine, was identified as a significant source of irritation. Respondents and interviewees reported that they often chose to use other search engines such as Google or saved links to avoid using the Statistics Canada engine. For the most part, interviewees were unaware of the new functionalities offered by the website, nor were they aware of products such as My StatCan. Respondents and interviewees also noted difficulties downloading and manipulating tables from the "new CANSIM" and lamented the loss of Beyond 20/20. Several respondents and interviewees requested that Statistics Canada reintroduce some of the features that were lost.
Focus – International analysis
Management of client accounts: The Netherlands
Statistics Netherlands (SN) established an account management program in 2007 with the goal of optimizing contacts with government departments and large organizations. Currently the program includes about 60 accounts. The goals of the initiative included professionalizing account management, shifting from the delivery of standard statistics to statistics tailored to an organization's operational or strategic requirements, and expanding the range of services offered by SN. A more long-term objective is to establish SN as a partner in the innovation and co-creation of information.
Account managers coordinate the overall relationship with an organization and act as the primary contact. They proactively reach out to the organization to learn about its information needs and its expectations of SN. They often meet with a range of staff to learn about the needs of the various units. The account manager keeps the organization informed of SN initiatives that might be beneficial to it, including new releases of data, progress on work that has been contracted and training opportunities. The account manager also has the authority to enter into agreements and assist in preparing contracts.
Customer service delivery Online chat: Mexico
The National Institute of Statistics and Geography (INEGI) has provided an online chat service for several years. It is the most popular response channel for level 1 requests to the INEGI. Since its implementation, usage has increased dramatically and the service now accounts for 57% of enquiries. Fifteen employees work on responding to chats, and it is not uncommon for an employee to handle three conversations at the same time, with no limit to the length of discussions. When an enquiry requires more specific expertise, the client is redirected to the appropriate department by way of a service ticket.
The call centre is the focal point where all requests are coordinated and tracked throughout the organization. Strict monitoring of enquiries is carried out, including after referral to the expert level.
The INEGI is currently implementing Microsoft Dynamics software as a customer management system to ensure customer service efficiency and case management.
2.2 The Client Relationship Management System
Evaluation questions
How well does the CRMS respond to users' needs?
What are the barriers and challenges that have an impact on the utilization of the system?
According to program documentation, there are 884 CRMS users, and the system captures about 600,000 entries and processes 65,000 transactions per year.Footnote 12 Roughly 60% of CRMS users work with the client service module.
According to the internal survey of CRMS users, opinions were divided on whether or not the client service module met operational needs—50% of users believed that the system met their needs, while the other 50% did not. Users recognized that the CRMS handled simple transactions and billing well. The most positive feedback came from the regional offices and the SIS call centre, where the CRMS was used for all client interactions and the focus was primarily on managing requests and maintaining relationships. As the organizational tool for verifying credit and billing, the CRMS revenue management module was used across the agency to process cost-recovery requests.
The CRMS was less effective at handling certain other activities. For example, users pointed out that database searches of historical transactions were difficult to conduct and often did not yield the expected result. In addition, the monitoring of the in-progress status of Tier 2 or Tier 3 data requests was challenging given that it was difficult to keep track of email exchanges and to record detailed notes about specific transactions in the CRMS. This was particularly true for cost-recovery projects, which could have complex specifications and often require several weeks or months to complete. The CRMS was simply not equipped to contain the granularity of information needed.Footnote 13
As mentioned previously, the CRMS has been modified many times since its initial implementation. These cumulative changes have contributed to the complexity of the CRMS, its functionalities, the maintenance requirements and how divisions have integrated the CRMS into their activities.
2.2.1 Factors impacting the use of the CRMS
While the CRMS was used by most divisions to support business processes and operations, use was neither systematic nor consistent. The evaluation found that depending on the division, the percentage of data requests received by subject-matter divisions that were captured in the client service module ranged between 5% and 90%. Some users noted that simple requests requiring only an exchange of emails or no provision of cost-recovery services were not necessarily recorded. Regional offices and the SIS, on the other hand, reported that they used the system consistently and believed that the vast majority of their requests were captured in the CRMS.
A cumbersome system
Users reported that the main reasons for not using the system were that they did not find the system to be user-friendly and that the data entry process was especially onerous. Just over half of users (56%) reported that they believed the data entry process was far more time-consuming and complicated than it needed to be. Some reported that, in complex cases, the recording of a client service request in the system could take up to 10 minutes and the registration of an LOA half a day.
A frequent response from subject-matter divisions was that production staff and data analysts were busy with tasks focused on the production of publications and data releases. Compared with client requests, the production and delivery of products were considered priorities, while registering transactions in the CRMS was not considered to be as important.
Infrequent CRMS users, such as those who used it once or twice a year for creating LOAs, commented that the system was not intuitive and that they had difficulty remembering the steps involved, resulting in an inefficient use of their time and creating a great deal of frustration. Some divisions have centralized the management of LOAs to one experienced CRMS user or unit to cope with this issue.
The majority of client service units reported using alternative systems (or software) to manage elements of their processes rather than the client service module in the CRMS. These alternatives included Outlook, Excel, GCdocs, JIRA and OneNote. They reported that the alternatives were more effective at processing, researching and case tracking. All divisions mentioned that they used email as their primary communication tool between work units when managing and transferring client requests rather than assigning cases and tasks through the CRMS—this practice increased the risk of errors.
Finally, changes in divisional operations or processes related to client services were not systematically shared with the CRMS team. This limited the system's capacity to meet users' needs in a timely fashion.
Benefits not well understood
Many subject-matter division users did not believe that there was a strong benefit to their operations from using the CRMS, with the exception of generating invoices for clients—a mandatory function. Few reported that their management requested reports or monitored service delivery. Regional offices were the exception, as the use of the CRMS was included as part of employee performance agreements. They used the system extensively and made use of CRMS information and reports regularly.
The ability to provide intelligence to monitor and control a client service program is an important objective of a CRMS. Other than a few examples in the regional offices, there was little evidence that performance indicators based on CRMS data were being broadly used to monitor and manage service delivery at Statistics Canada, either at the divisional or at the organizational level. There was also no evidence that metrics had been developed to assess the performance of the CRMS and its use.
Satisfied with support and training
Users reported that the learning curve for the system was long and that knowledge of how to use the system was primarily acquired through experience and repeated use. In terms of formal training, two in-class sessions had been offered in the past by the CRMS team; however, they were replaced by an online tool.Footnote 14 The majority of users were satisfied with the support and training provided by the CRMS team. Users suggested that more customized tools and methods could be developed to fit their needs, including the availability of local power users to support other users who are less familiar with the system.
Suggestions for improving the system
Several suggestions were made on how to improve the CRMS and increase its use. To reduce the time required to process a case, some users suggested merging or simplifying the processing steps to create opportunitiesFootnote 15. Users said that the steps in the operational processes need to be clearer and that the system should offer more help functions to guide users through the steps.
It was also suggested that the CRMS be integrated with other systems and programs, especially Outlook, so that emails could be automatically recorded in the CRMS by file number. Other suggestions included
- incorporating a time and cost estimator for cost-recovery requests
- adding alerts and notifications for pending requests
- improving the search engine
- updating the list of products (including by theme)
- allowing for customization of the system
- adding dashboards
- offering more reporting options
- having messages and notices to users incorporated into the CRMS rather than sending them by email
2.2.2 Quality of CRMS data
The fact that the CRMS is not systematically used to record all client requests creates deficiencies in the reliability of the data. Simply, the agency does not have a complete picture of all its interactions with clients.
As mentioned previously, the use of the CRMS in subject-matter divisions is inconsistent. In addition to the number of enquiries registered in the CRMS being inaccurate, a review of a sample of CRMS transactions revealed that a significant number of transactions have the client name recorded as "anonymous".Footnote 16 Numerous other records were found to have blank fields, indicating that a significant number of cases were only partially documented.
Entry errors and duplicate records also appeared to be a concern. A number of users mentioned that, because the CRMS search function did not always yield the desired result when searching for a client, they sometimes created a new record for an existing client, leading to duplicate client records. This duplication could be exacerbated when multiple divisions were involved in serving a client. In addition, some subject-matter divisions adopted a practice of creating a brand new client record whenever they received a request from a regional office to ensure that the level of effort undertaken by the division was recognized. The by-product of this practice, however, was the duplication of transactions in the CRMS.
A system-imposed restriction (CRMS users do not have the permission to delete certain entries, presumably to ensure the integrity of the system) also contributed to duplicates. Rather than working with the CRMS team to correct an error, some users reported that they sometimes just created another record as a workaround. Again, this created duplication of records and residual erroneous data.
Efforts to resolve these types of issues place a significant burden on the CRMS team.Footnote 17 There is a full-time resource dedicated to routinely reviewing and cleaning the system of errors and duplicates. The team of 3.5 full-time equivalents also responds to approximately 2,500 user queries for technical issues or questions each year. This support is provided in collaboration with the SIS team. Frequent informational emails are sent to users and an annual meeting is also held with super users and representatives of the various divisions to raise awareness and stress the importance of maintaining the quality of data.
2.2.3 Using the CRMS for strategic purposes
Only a small proportion of managers, primarily in the regional offices, reported that they used the CRMS as a source of information for strategic decision making. Concerns related to the completeness and accuracy of the CRMS data, plus a general lack of awareness about the data available, were stated as the main reasons for not using it.
All managers interviewed indicated that client information was important; however, more than half stated that they did not use CRMS information for decision making. Instead, they depended on other mechanisms such as staff meetings, client consultations, committees and working groups, and reports from other systems used to track transactional activities. Managers who said that they used reports from the CRMS indicated that they found the information useful, but limited. They noted that while there were some standardized reports available, their specific data requirements could often be met only via a customized report produced by the CRMS team—increasing the complexity and decreasing timeliness since the turnaround time for customized reports was roughly two weeks.
Finally, it was clear that at the management level there was a lack of knowledge of the system's capabilities and the information available.
Managers indicated their primary information needs included
- information about clients requesting data (received by the SIS)
- data needs of clients
- the nature of the requests for products and services
- most frequently requested products, at both the survey and the thematic levels
- requests that could not be answered because of data gapsFootnote 18.
Quarterly reports, dashboards and a system to quickly identify data gaps were suggested as potential useful improvements to the CRMS.
The implementation of the CRMS at Statistics Canada has encountered problems that are commonly associated with the rollout of information systems. The implementation of a new system affects the established processes, roles and tasks of employees and divisions. Resistance to change or avoidance can occur when the adoption of the system is, or is perceived to be, onerous and requires effort and training. The solution does not necessarily lie in simply obligating all staff to use the system. This can compound the problem if the resistance concerns are not resolved. Strategies for overcoming resistance typically include fostering engagement with user participation in the implementation process, education, training, management direction, the use of incentives and efforts to make the user experience as intuitive as possible.
Ensuring that staff understand the benefits of a CRMS that relies on accurate and complete data, as well as demonstrating how to use the data strategically, will allow an organization to better understand and serve each client. Effective operational and strategic decision making become possible.
2.3 Other factors affecting efficiency and effectiveness
Evaluation question
What are the factors impacting the efficiency of client service delivery?
As noted previously, clients identified a number of issues with service delivery. The evaluation found that governance and non-standardized processes were key contributors.
2.3.1 Strategic direction and governance
Besides documentation from 2011,Footnote 19 the evaluation found little evidence of an overarching strategy for client service delivery at the agency level and of a corporate lead. The only recent strategic plan found (modernization of the SIS) addressed a very specific aspect of service delivery: the creation of data service centres and the amalgamation of Tier 2 requests.Footnote 20 In terms of a corporate lead, several individuals were responsible for specific pieces of client service delivery; however, there was no one individual that oversees it for the agency. The Director General (DG) of Communications and Dissemination was responsible for the CRMS, the DG of Collection and Regional Services was responsible for the SIS and the regions, and individual subject-matter units fell under the responsibility of their director or DG.
In October 2014, the Treasury Board Secretariat (TBS) introduced the Policy on Service and the Guideline on Service Management. According to these instruments, as of 2017, every organization was to have a multi-year departmental service management strategy. At the time of the evaluation, while there were some elements identified, no organizational strategy existed. The TBS examined 11 departments for compliance with the policy through the Management Accountability Framework. Starting in 2019, coverage will be expanded to other Government of Canada institutions, including Statistics Canada.
In terms of governance, while parts of client service delivery appeared to fall under committees such as the Communications and Dissemination Committee, there was little evidence of any type of governance structure overseeing activities at the agency level. Rather, it appeared that service delivery units, for the most part, operated independently. The only agency-level guidance found was the Standards of Service to the Public, which outline commitments around availability, promptness, fees and meeting needs. The standards are published on the website along with contact information should a client believe that the agency has not met any of the requirements. The evaluation found no information on how well the agency was meeting these standards.
Other than an annual CRMS-based session, the evaluation found no evidence of an agency-wide mechanism through which client service units could share best practices and information. Internal interviewees noted that this would be useful and that in the past there was a client services forum.
2.3.2 Roles and responsibilities, and inconsistent processes
The evaluation found little documentation outlining the roles and responsibilities of the various client service units across the agency. Individual client service units had a good understanding of their own role and responsibilities within the context of their division; however, they indicated they did not fully understand the roles and responsibilities of other client service delivery units across the agency. For example, several subject-matter divisions noted they were not fully aware of how requests were handled in the regions and vice versa.Footnote 21 The overall lack of awareness contributed to challenges in responding to complex or multidivisional requests.
As noted previously, client service delivery processes generally differed across the agency. For example, some service delivery units were structured to serve only a triage function, while others provided a broader range of services including responding to complex questions and completing cost-recovery requests. Differences in their responsibilities meant that the underlying processes were often different as well. This lack of consistency across the agency was noted by clients who were treated differently depending on where they went. It also meant that multidivisional requests could be challenging to coordinate and that the provision of basic information to a client (such as a status update) was unnecessarily complicated and lengthy. Suggestions provided during internal interviews included the establishment of internal standards and the development of a common database of custom tabulations.
The lack of consistency also had an impact on the adoption of the CRMS. As noted previously, users found the system to be heavy and onerous. This can be partially attributed to the fact that since processes vary, they may not align with the CRMS. The regions were among the few units whose processes were mostly aligned with the CRMS. Most others operated in a hybrid environment where the CRMS was used for some things and alternative solutions for other things. Decisions on where to use the CRMS appeared to be based on history and alignment with processes.
The evaluation found that gaps existed concerning accountability for the adoption of the CRMS. While the CRMS team played a key supporting role, it did not have authority over the various client service processes, nor did it have a monitoring role. Thus, although the system was mandatory, no one (committee or person) was found to be responsible for ensuring its full adoption.
How to improve client service delivery
Recommendation 1
The Assistant Chief Statistician (ACS) of Strategic Engagement and Communications, in collaboration with the ACS of Census, Regional Services and Operations and the ACS of Corporate Services, should ensure that an agency-wide client service delivery strategy or plan is developed that covers governance and leadership, agency-level objectives, standards including targets, performance measures, roles and responsibilities, and communications. The strategy should focus on creating a more holistic and consistent approach that addresses the various issues highlighted during the evaluation, such as timeliness, transparency, consistency and costs.
Recommendation 2
The Assistant Chief Statistician (ACS) of Strategic Engagement and Communications, in collaboration with the ACS of Census, Regional Services and Operations and the ACS of Corporate Services, should ensure that the agency's new CRMS is aligned to the strategy in Recommendation 1 and thus supports a more holistic and consistent approach.
Recommendation 3
The Assistant Chief Statistician (ACS) of Strategic Engagement and Communications, in collaboration with the ACS of Census, Regional Services and Operations and the ACS of Corporate Services, should ensure that the quality and coverage of information in the CRMS are improved, and the awareness among managers about the CRMS is increased.
Management response and action plan
Recommendation 1
An agency-wide client service delivery strategy or plan is developed that covers governance and leadership, agency-level objectives, standards including targets, performance measures, roles and responsibilities, and communications. The strategy should focus on creating a more holistic and consistent approach that addresses the various issues highlighted during the evaluation, such as timeliness, transparency, consistency and costs.
Management response
Management agrees with the recommendation.
A working group will be established to develop an agency-wide strategy and action plan to enhance the existing service design in order to improve client relations.
Deliverables and timelines
The ACS of Strategic Engagement and Communications and the ACS of Census, Regional Services and Operations co-lead to
- establish the Service Design Working Group (WG) for the (re)design of a client service delivery model (November 2019)
- with the assistance of an external advisor/consultant, develop an agency-wide client service delivery strategy or plan (preliminary report in August 2020) that covers:
- governance and leadership
- agency-level objectives
- standards including targets
- performance measures
- roles and responsibilities
- branding and communications
- implement a strategy with executive oversight and guidance to ensure that an agency-wide client service delivery strategy or plan is implemented and used consistently throughout the agency (final report and commencement of implementation in September 2020).
Recommendation 2
The agency's new CRMS is aligned to the strategy in Recommendation 1 and thus supports a more holistic and consistent approach.
Management response
Management agrees with the recommendation.
The development of the new CRMS platform will be aligned to the new client relations and service design strategy and processes.
Deliverables and timelines
The ACS of Strategic Engagement and Communications, with the support of the ACS of Census, Regional Services and Operations, the ACS of Corporate Services and the ACS of Digital Solutions, will ensure
- the WG on the new CRMS will work with a consultant to develop requirements for the new CRMS platform, which will align with the service design strategy (platform definition for August 2020).
- the WG will present the platform requirement to the modernization committee prior to going to the marketplace (September 2020).
Recommendation 3
The quality and coverage of information in the CRMS are improved, and the awareness among managers about the CRMS is increased.
Management response
Management agrees with the recommendation.
A change management approach involving various communications channels (individualized team communications, agency-wide communications) and the training of personnel in key roles will be developed and delivered in order for employees in key roles to understand the processes of the existing CRMS and the value of contributing to the process. This will also set the stage for the implementation of the new CRMS technology.
Deliverables and timelines
The ACS of Strategic Engagement and Communications, with the support of the ACS of Census, Regional Services and Operations, the ACS of Corporate Services and the ACS of Digital Solutions, will ensure
- a communication strategy is developed focusing on user adoption by sharing the corporate vision of the CRMS and how it fits into the overall direction and strategy of the agency (December 2019)
- training to ensure that users and managers understand their roles in client service delivery, the expectations for the CRMS, and the importance of inputting consistent, accurate information (March 2020)
- the creation of a network of users within fields to share best practices (March 2020).
Appendix 1: Statistics Canada's client services delivery
Statistics Canada clients access products and services through different entry points depending on the nature of their enquiry, the complexity of the enquiry and whether there is a dedicated point of entry for their type of enquiry:
- The Statistics Canada website is a self-service access point for statistical information and data.
- The Media Hotline is the first point of contact for journalists. The line operates from Monday to Friday, from 8:30 a.m. to 5:00 p.m. (Eastern time). After-hours service is also available for urgent media enquiries.
- The Statistical Information Service located in Montréal is a centre for general enquiries, operating Monday through Friday, from 8:30 a.m. to 4:30 p.m. (for all time zones in Canada). Twenty information officers answer questions from the public via telephone, email, TTY and, soon, online chat. The officers are responsible for answering basic questions and Tier 1 data requests in relation to already-published statistical information. For more complex enquiries, agents route requests to consulting analysts located in the closest regional offices to the client or to subject-matter specialists. Officers are also responsible for handling requests for technical assistance and providing support to survey respondents.
- The consulting services offered through the network of regional offices are another access point for clients. These consulting analysts located in service centres across Canada provide training services, coordinate data requests, and provide statistical information based on their knowledge and the nature of the enquiries. Regional office consulting analysts offer Tier 2 data services (complex data tabulations and other fee-based products and services).
- Subject-matter divisions in Ottawa also provide services directly to clients. These are typically requests from larger users, Tier 2 and Tier 3 requests (complex data tabulations or methodological support) that only experts can answer, or any questions that could not be answered by other client service units. Subject-matter divisions are also systematically involved in the management of cost-recovery projects costing more than $20,000 since this type of contract requires a high level of expertise. Many subject-matter divisions have dedicated client service staff.
- The Aboriginal Liaison Program provides a point of access to a variety of services for First Nations, Métis and Inuit communities and organizations.
In addition to the access points available to the public, there are three specialized access points for microdata:
- The Data Liberation Initiative provides Canada's postsecondary educational institutions access to key Canadian data and microdata and ongoing training and support services.
- Research data centres and the Federal Research Data Centre provide authorized researchers with direct access to microdata in secure premises located at Canadian universities, which are supervised and managed by Statistics Canada staff.
- The Real Time Remote Access system provides a computerized data access service to authorized users.
Finally, Members of Parliament and international organizations receive data products through the parliamentary office and the international coordination office.
Appendix 2: Standards of Service to the Public
Statistics Canada is committed to serving its clients in a prompt, reliable, courteous and fair manner. To this end, we make the following commitment.
Availability
Making information available is an important part of our business. Accordingly, Statistics Canada will
- communicate in the official language of the client's choice
- provide service during regular business hours, from 8:30 a.m. to 4:30 p.m. in all Canadian time zones, through the Statistical Information Service 1-800 toll-free service and email address
- provide information, upon request, in multiple formats such as audio, Braille, e-text and large print to accommodate persons with disabilities.
Promptness
Depending on the nature of the enquiry, response times will vary. To ensure prompt service, Statistics Canada will
- return a client's phone call within one business day of receipt
- acknowledge receipt or answer an email within two business days of receipt and a letter received by mail or fax within five business days of receipt
- fill basic information requests and orders for readily available products within two business days of receipt
- fill requests for custom products or services on a contractual basis within a mutually agreed upon time
- advise clients of any change in delivery time and clearly explain the reason for the change.
Fees
Statistics Canada provides information of broad interest to the public free of charge via its website and libraries throughout Canada.
Statistics Canada recovers the costs of providing specialized products and services to various groups and individuals. For these products and services, we will:
- always inform clients of the cost of the product or service prior to undertaking the work
- advise the client immediately of any change in cost and explain the reason
Fees are based on factors such as complexity of the request, time required to conduct the work, technology requirements and data transmission cost.
Meeting clients' needs
To meet the information needs of clients, Statistics Canada will:
- consult with the client to fully understand their needs
- advise the client immediately in the event of differences between the request and the product to be delivered and explain the reason
- provide a solution free of charge if the product delivered does not conform to the client's request and this is due to our misunderstanding.
If you, as a client, have reason to believe that these standards have not been adhered to in your dealings with Statistics Canada, you are encouraged to contact
Director General
Collection and Regional Services
Statistics Canada
170 Tunney's Pasture Driveway
Jean Talon Building, 7-D5
Ottawa, Ontario
K1A 0T6
Telephone: 613-951-5077
Facsimile: 613-951-2105
Email: infostats@statcan.gc.ca attention DG Collection and Regional Services
Appendix 3: Gender-based Analysis Plus
Gender-based Analysis Plus (GBA+) is used to assess how diverse groups may experience policies, programs and initiatives. In addition to sex and gender, GBA+ considers other factors, such as disability, age, ethnicity, race, religion, sexual orientation, income, geography, education and culture.
Statistics Canada offers some of its services specifically to meet the needs of certain segments of its clientele. For example, through the Aboriginal Liaison Program and its regional offices, the agency offers several types of services and information specific to Indigenous peoples, including training, data and presentations.
The agency meets accessibility standards for persons with disabilities. Examples of specific services include a TTY system in the call centre to communicate with persons with a hearing or speech impairment and a website that meets federal accessibility requirements.