
Using data science and cloud-based tools to assess the economic impact of COVID-19
By: Razieh Pourhasan, Statistics Canada
As COVID-19 continues to impact the economy at a rapid pace, it is more important than ever for Canadians and businesses to have reliable information to understand these changes. A team of data scientists and analysts at Statistics Canada are working hard to meet this information need by automating the extraction and near real-time analysis of text data from a variety of sources. These sources include Government of Canada (GoC) NewsDesk, corporate websites, and potentially corporate Twitter and LinkedIn accounts. However, the inclusion of social media is subject to obtaining required permissions. The project focuses on the economic impacts of significant social or political events, such as the COVID-19 pandemic, on the lives of Canadians.

The rapid spread of the virus and the impact of the pandemic created the need for timely, high-quality data at an unprecedented pace to inform Canadians and support decision-making. The COVID-19 events completely changed the way work is conducted and have set different expectations in a new digital reality. Timeliness is more important than ever and Statistics Canada is using data science tools to respond quickly to the changing situation and better understand the impacts on our country and economy.
To produce different types of analytical products for decision makers and Canadians, analysts are interested in different types of information. For instance, those who are carrying out COVID-19 analyses look to detect relevant news such as:
- which companies are most involved in or affected by the pandemic?
- did these companies have a branch closure?
- are these companies involved in the production of personal protective equipment?
- how many job losses have been reported?
The project has two phases based on the extraction source and the available permission for web scraping. In phase one, the extraction is limited to the GoC NewsDesk and a handful of companies’ news websites. In phase two, the extraction will potentially include more Canadian companies, as well as Twitter and LinkedIn data—conditional on obtaining the approvals to access and use these data sources.
Meeting the needs of analysts
To better meet the varying needs of analysts in their effort to provide timely information to Canadians, the data science team optimizes the extraction procedure and real-time analyses to include as much information as possible from different sources. The team establishes their workflow using a robust infrastructure that is accessible through the designated Statistics Canada platform on the Microsoft Azure Cloud. Next, Kubeflow is used to create python-based Jupyter notebooks, Elasticsearch (ES) is used for data ingestion and integration and Kibana dashboards are used to build dashboards and visualizations to present the results to the analysts.
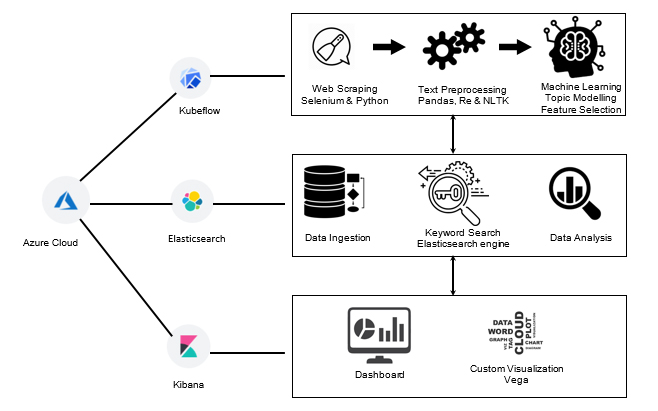
Description - Azure cloud
Chart showing icons for Azure cloud, Kubeflow, Elasticsearch and Kibana.
- The Kubeflow steps are: web scraping, Selenium and Python; text processing, Pandas, Re et NLTK; machine learning, topic modelling and feature selection.
- The Elasticsearch steps are: data ingestion; keyword search, Elasticsearch engine; data analysis.
- The Kibana steps are: dashboard; custom visualization, Vega.
The next step is to develop a Kubeflow pipeline to automatically extract text data by scraping companies’ news website using Selenium and Python modules, pre-process and clean the data with Pandas, Regular Expression and Natural Language Toolkit, and finally, ingest the extracted data into ES for further analysis. The data scientists then perform the exploratory data analysis, which can be as simple as word count or keyword search using an ES search engine, or as sophisticated as a machine learning algorithm such as topic modelling for document clustering applied through integrated python code.
The results of analyses are then visualized on Kibana dashboard using bar or pie charts, word clouds, scatter plots or customized combinatory graphs using Vega interface on Kibana. These dashboards are the final products which are delivered to analysts, either by providing them with a URL link that they can access through their cloud account or by setting an email notification so that they receive the desired products in their inbox.
Looking ahead
Currently the project is focused on corporate data, however, it could be scaled up to include other web-based information sources. It could also be adapted to include different units of analysis such as products, employment, financial data, health and social behaviours, sentiments, etc.
An analyst usually allocates 5 to 30 hours per month to search the web, find useful information, extract and compile it. This project can potentially reduce this time by a factor of three or even more, making it a very efficient option for analysts.
With the automated data extraction, the application of machine learning algorithms and the cloud-delivery model, it is easier to perform real-time analyses in a broader sense and to provide results to decision-makers in a timely manner. Both businesses and individual Canadians benefit from this timely information as our society seeks to better understand the impact of COVID-19 on our economy and our society.
Team members
Data scientists: Chatana Mandava, Razieh Pourhasan, Christian Ritter
Analysts: Tracey Capuano, Lisa Fleury, David Glanville, Francois Lavoie, Joanne Moreau, Anthony Peluso
- Date modified: