
Family Matters: Couples who live apart
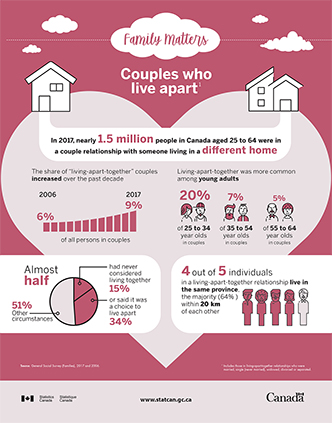
This infographic presents results from the 2017 General Social Survey on families; more specifically people aged 25 -64 years old and who reported being in a couple relationship with someone not living in their household.
Family Matters – Under the same roof: Living with my parents!
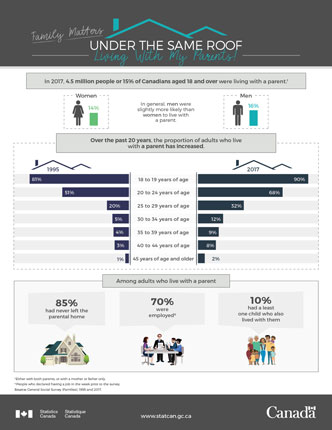
This infographic depicts a comparison between two years of the GSS: 1995 and 2017. It also shows the co-residence of parents and children by different characteristics such as sex, age and other socio-demographic variables.
Young people not working, in school or training: What were they doing?
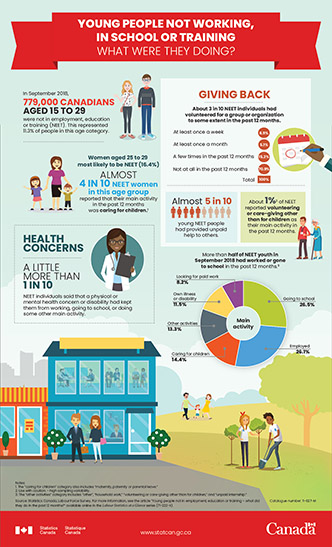
This infographic examines the activities during the 12 months prior to September 2018 for 15- to 29-year-olds who were NEET in that month. The analysis is based on the one-time addition of questions on this topic to the Labour Force Survey in September 2018. At that time, 11.3% of young Canadians between 15 and 29 were NEET.
Mental health-related disabilities in Canada, 2017
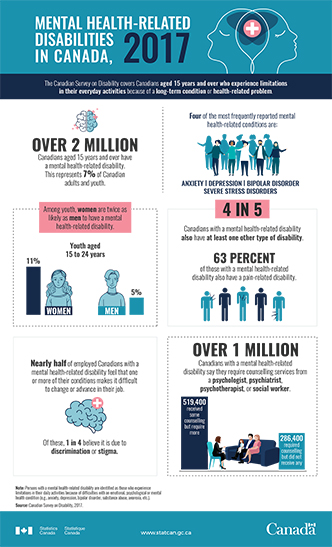
Mental Health-Related Disabilities in Canada from the 2017 Canadian Survey on Disability.
Canadian youth: hopeful, resilient and hard-working
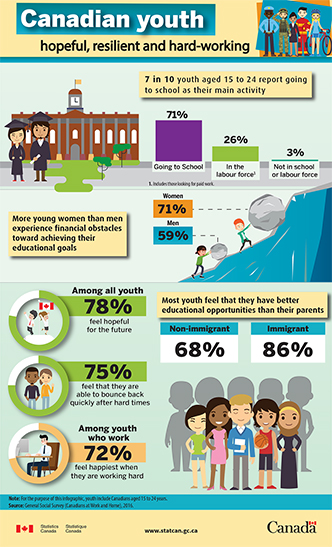
Both in school and in the work place, youth in Canada are hopeful for the future but aware of the obstacles that lay ahead. This infographic uses data from the 2016 Canadians at Work and Home Survey to capture some ways in which youth experience and navigate these domains. Despite the real-world challenges that Canadian youth may experience, they prove to be resilient, hopeful and aware of the opportunities ahead.
How Canadians spent their money in 2016
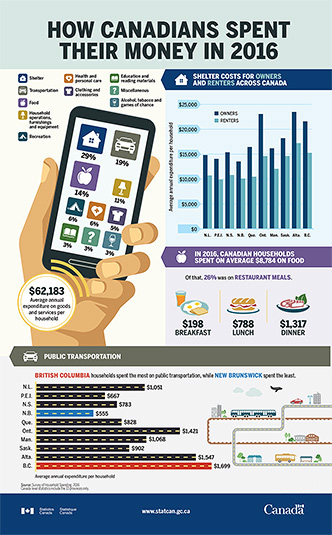
Based on the data from the 2016 Survey of Household Spending, this infographic presents a glimpse into how Canadian households spent their money.
Cyberstalking in Canada
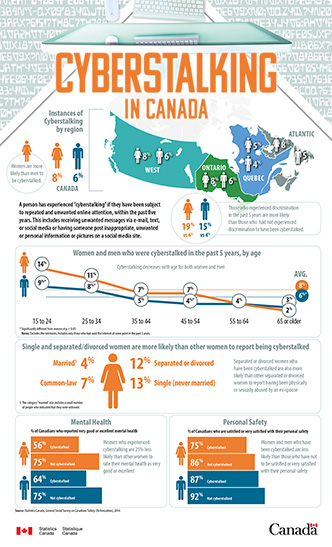
Based on data from the General Social Survey on Canadians' Safety, this infographics looks at instances of cyberstalking in Canada by region, age, sex and marital status.
Canadians in the workforce, 2016 Census of Population
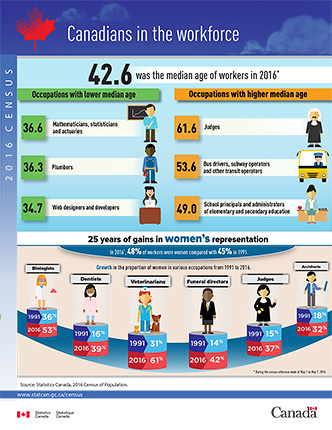
Based on 2016 Census data, the following infographic looks at occupations with lower and higher median age, and the proportion of women employed in various occupations.
Canada's educational portrait, 2016 Census of Population
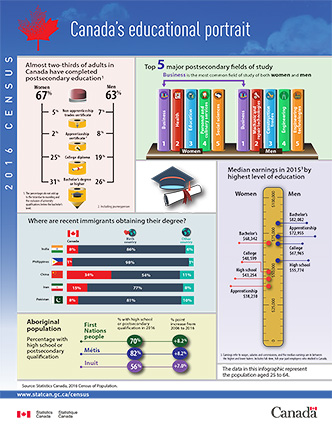
Based on 2016 Census data, the following infographic provides a portrait of education in Canada, including the educational attainment of the working-age population, as well as highlights on Aboriginal peoples and where newcomers to Canada are earning their credentials. The infographic also looks at fields of study and the earnings of Canadians at different levels of education.
Mental Health Disorders and Life Satisfaction in Canada
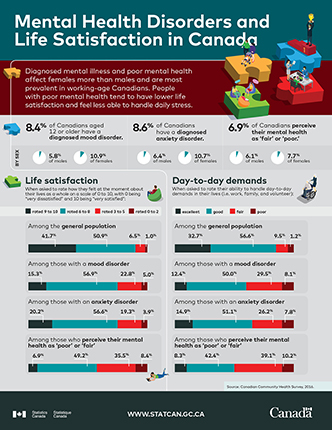
Using data from the 2016 Canadian Community Health Survey, this infographic looks at how Canadians perceive their mental health, with emphasis on life satisfaction and day-to-day demands.