
Accessing Gender, Diversity and Inclusion Data
This info sheet provides practical guidance on how to find, filter, and explore gender, diversity, and inclusion (GDI) data using the Gender, Diversity, and Inclusion Statistics Hub (GDIS Hub). The GDIS Hub is the central location to access disaggregated data by gender and other sociodemographic characteristics, enabling users to examine outcomes for diverse people in Canada.
The purpose of this information sheet is to show how the key features of the GDIS Hub can help users analyse disaggregated data by gender and other characteristics to better understand how different groups experience social and economic outcomes.
One example of how these data can be used in the federal government is through the application of Gender-based Analysis Plus (GBA Plus). For more information on GBA Plus and its role within the federal government, visit Women and Gender Equality Canada.
Using Dashboard Features to Support Gender-Based Analysis Plus
Disaggregated data analysis involves examining how outcomes vary by gender and other sociodemographic characteristics, such as age, disability, education, Indigenous identity, ethnicity, economic status, geography (including rurality), language, race, religion, gender diversity, and sexual orientation.
Statistics Canada provides disaggregated data that allow users to compare outcomes across gender and other identity and social factors. The dashboards enable users to view, compare, and explore data across multiple dimensions.
Using the GRF Dashboard: Features and Functions
Data in the GDIS Hub are organized under pillars aligned with Canada's Gender Results Framework (GRF):


Each pillar includes interactive dashboards presenting indicators aligned with GRF outcomes. The data are refreshed regularly and drawn from official Statistics Canada data sources. Government analysts can use this disaggregated data to track progress, evaluate the effectiveness of programs, and support evidence-informed policy decisions, such as improving educational supports for young women in Indigenous communities.
In addition to the GRF dashboards, users can explore other gender indicators, by clicking on the "Other Statistics Canada gender indicators", which provide additional disaggregated data not captured under the GRF pillars.
Understanding GRF Indicators and Data Tables
Each dashboard indicator represents a specific GRF outcome. Indicators are displayed using charts and tables, often with filters that allow users to explore how outcomes vary across population groups and over time.
By adjusting filters such as reference period, geography, or population group, users can see differences that may be masked in overall averages. Charts provide a visual comparison, while tables display the underlying values, allowing users to:
- Compare outcomes across population groups for a specific reference period
- Examine differences by gender and other characteristics
- Identify groups that experience higher or lower prevalence of an outcome
This functionality supports disaggregated data analysis by helping users explore differences across multiple sociodemographic characteristics.
Key Dashboard Features
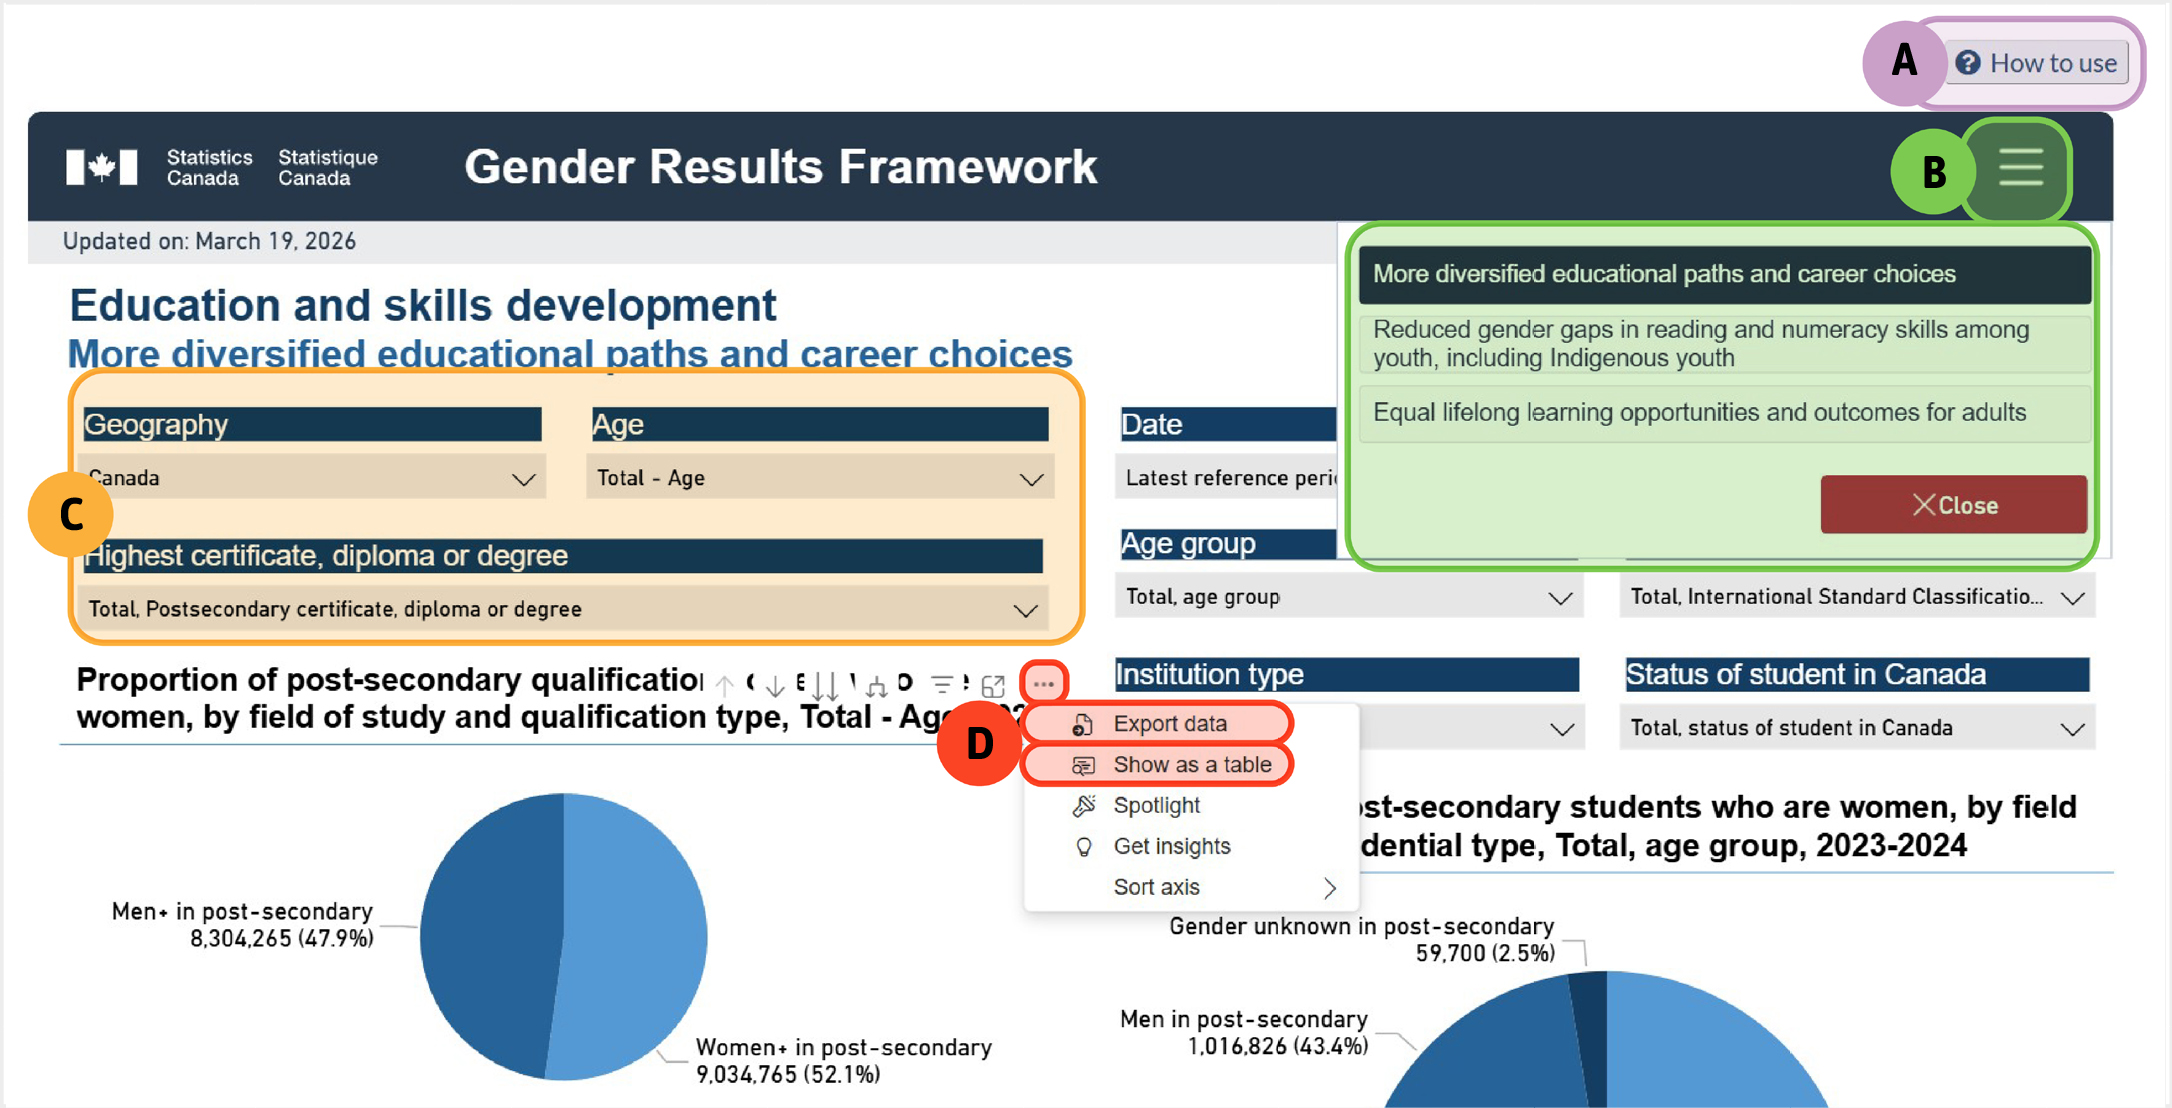
Figure 1 - The key dashboard features
The key dashboard features found on the Education and skills development pillar. The graphics highlights different sections of the page:
A shows the 'How to use' help text, B shows the hamburger menu, C shows the dropdown menus where users can filter by different characteristics such as geography, age group and education level, D shows two options users can select, 'Show data in a table' and 'Export data'.
- "How to use" help text: Guidance on navigating the dashboard.
- "Hamburger" menu (three horizontal lines in the top right of the dashboard): Access more indicators and dashboards within the same pillar.
- Dropdown menus: Filter by geography, age group, education level, reference period, and other characteristics.
- Show data in a table: Hover over the chart or title, select "More options" → "Show in a table."
Export data: Hover over the chart icons, select "More options" → "Export data", then select CSV.
Using Dashboard Filters to View Disaggregated Data
Filters allow users to examine outcomes for specific population groups, revealing differences hidden in aggregate data. Available filter options vary by dashboard and reflect the source data. Where possible, dashboards support disaggregation by gender, age, racialized group (or visible minority), Indigenous identity, and immigrant status, enabling exploration across multiple identity and social factors. This allows policymakers to identify groups that may experience barriers to programs or services. It can support the development of targeted initiatives, such as improving access to employment programs for women in underrepresented fields.
Case study: Poverty Reduction, Health and Well-Being Dashboard
The "Poverty reduction, health and well-being" dashboard illustrates how GDIS data can be used to examine differences across multiple characteristics.
By default, the dashboard displays the indicator "Fewer vulnerable individuals living in poverty" using the most recent reference period available.
Under this indicator, the leftmost data visualization shows the prevalence of low-income households by type of economic family, broken down by province.
To examine data for a different year, users can use the "Date" dropdown to select an earlier reference period. Keeping "All persons" selected under Economic family type shows that in 2020, 6.8% of people in Ontario were living in low-income households. Changing the selection to "Persons not in an economic family" increases the prevalence to 23.2% in Ontario.
On the right-hand side of the dashboard, users can examine poverty and low-income levels across a range of demographic characteristics or population groups. By adjusting the "Date" and "Geography" filters, users can see how the proportion of those living in poverty and low-income households varies considerably across population groups by reference period and geography. These insights can inform program design, tailoring poverty reduction initiatives to communities or groups disproportionately affected, such as new immigrant women or specific racialized populations. For example, in 2023 in British Columbia, 7.2% of Filipinos were living in poverty and low-income households, compared with 21.0% of Arabs.
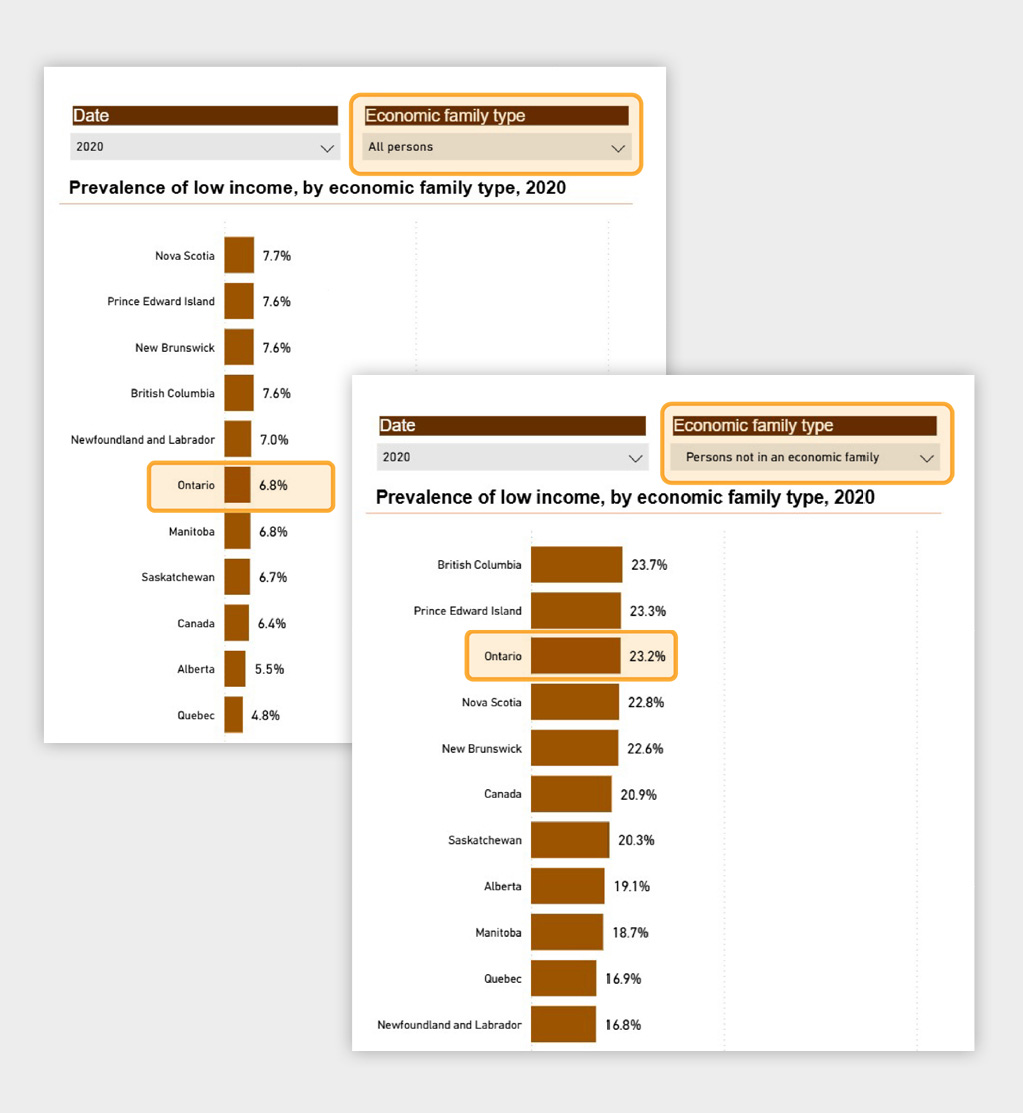
Figure 2 - The prevalence of low income
The prevalence of low income for all persons in 2020 for those in Ontario was 6.8%.
The prevalence of low income for persons not in an economic family in 2020 for those Ontario is 23.2%.
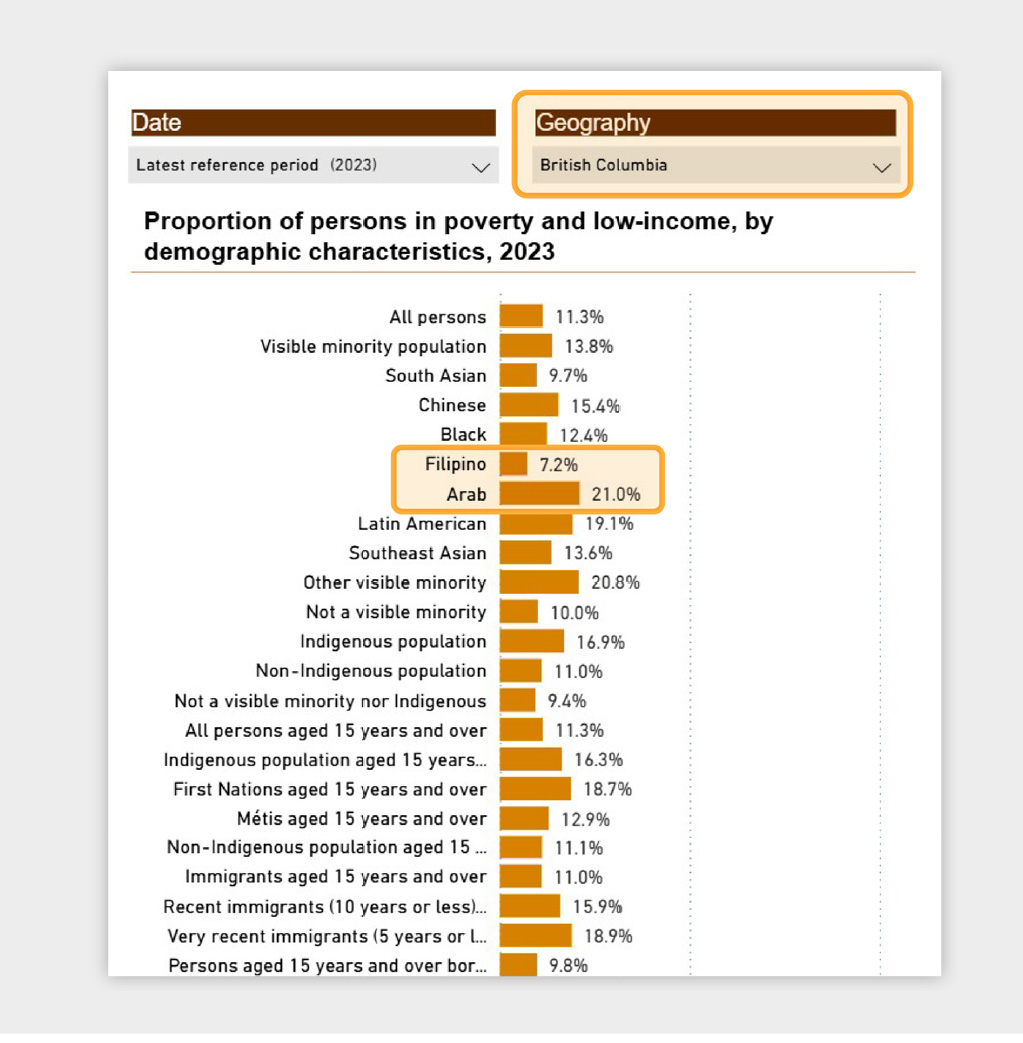
Figure 3 - The proportion of persons in poverty and low-income
The proportion of persons in poverty and low-income for the year 2023 for British Columbia shows a list of sociodemographic characteristics. Two groups are highlighted: Filipino shows 7.2% and Arab shows 21.0%.
Data Sources and Additional Information
The "Data" section under each dashboard lists sources for all indicators available under the hamburger menu.
The "Additional information" section provides guidance on "Balancing confidentiality and gender data dissemination", explaining how the gender variable is created and how gender data are handled to protect respondent confidentiality. Because the number of non-binary respondents is relatively small, Statistics Canada applies confidentiality measures that incorporate their responses into broader gender categories (men+ and women+).
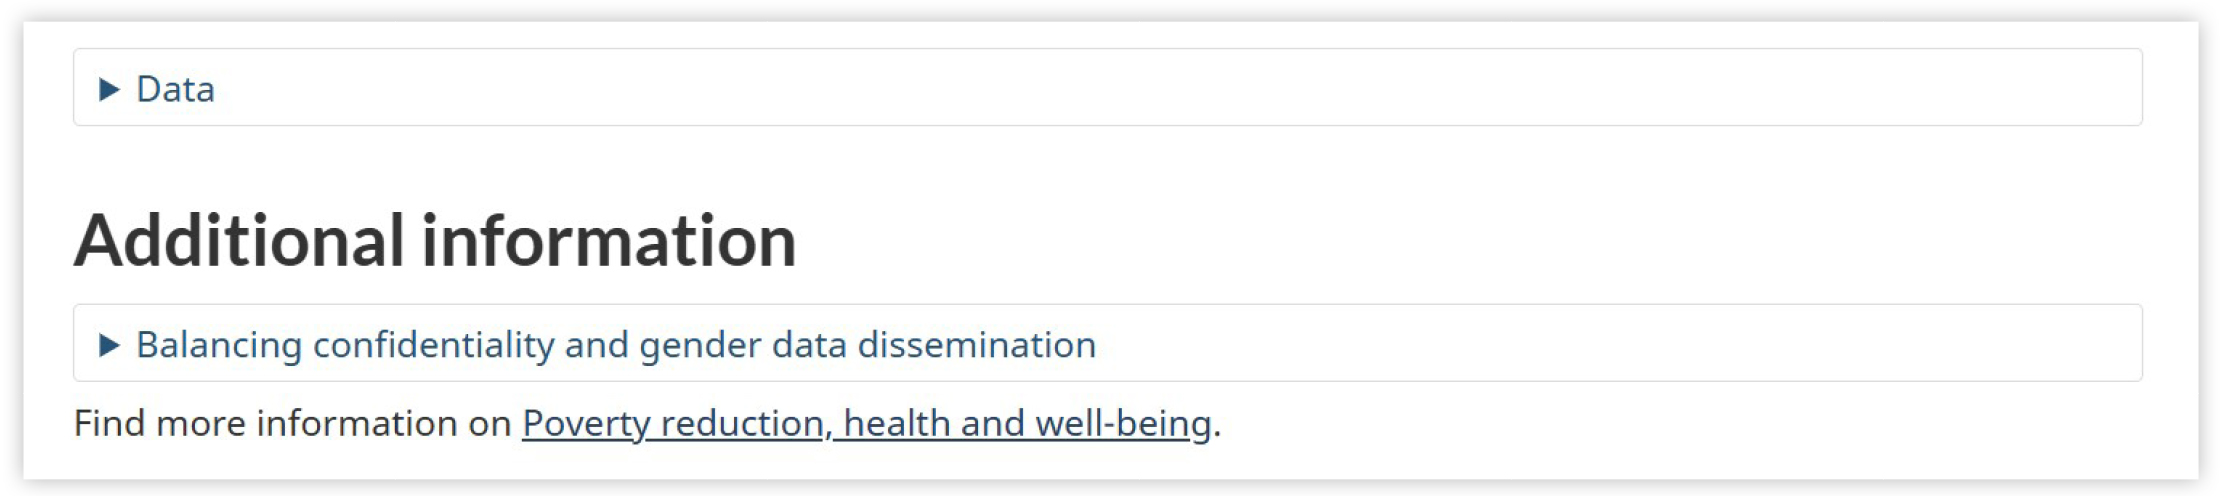
Figure 4 - Additional information
'Additional information' highlights how users can access guidance on 'Balancing confidentiality and gender data dissemination'.
Related Data and Additional Information:
The "Related data" section at the bottom of each dashboard links to additional data tables, including tables not used in the dashboards. In contrast, "Find more information on (pillar name)", leads to a broader collection of resources for that pillar, including both data tables and analytical products beyond the specific indicator.
Example: Using "Related data" tables to explore gender, diversity, and inclusion related data.
The data tables listed under the "Related data" section often include many sociodemographic and economic characteristics that allow users to explore outcomes across multiple characteristics beyond what is shown in the dashboard.
For example, in the Poverty Reduction, Health and Well-Being pillar, Table 13-10-0880-01 Health indicators by visible minority and selected sociodemographic characteristics: Canada excluding territories, annual estimates includes health indicators such as perceived mental health by characteristics including gender, age group, visible minority group, immigrant status and period of immigration. Users can click "Add/Remove data" to choose which characteristics to include in the display and explore how perceived mental health varies not only between women and men but also across visible minority groups or between immigrants and non-immigrants within the same view. This allows users to examine how mental health outcomes vary across combinations of gender and other sociodemographic characteristics.
When using the Add/Remove data feature, users can:
- Narrow the table to focus on specific population groups of interest, such as by gender and visible minority group.
- Compare outcomes across gender and other diversity-relevant characteristics.
- Create customized views that support in-depth disaggregated analysis.
Searching for Gender Diversity and Inclusion Data Not Shown in the Dashboards
Users can find additional GDI data through the GDIS statistics catalogue.
From the GDIS Hub homepage, scroll down to the "Explore the data", and use the "Browse the GDIS catalogue" box. This will return a page with hundreds of GDI-related products, each displaying the title, type of product, and release date.
The filters refine results by keyword, population identity group, social and economic characteristics, and type of product. Results can be sorted by date, alphabetically, or in reverse order.
For example:
- Select "Immigrants and non-permanent residents" under population identity groups to view products related to immigrants.
- Add "Education" under social and economic characteristics to narrow to products that explore the intersection of immigration and educational outcomes.
- Select "Data tables" under "type of product" to limit the results to tables.
- Click "Clear filters" to reset the catalogue.
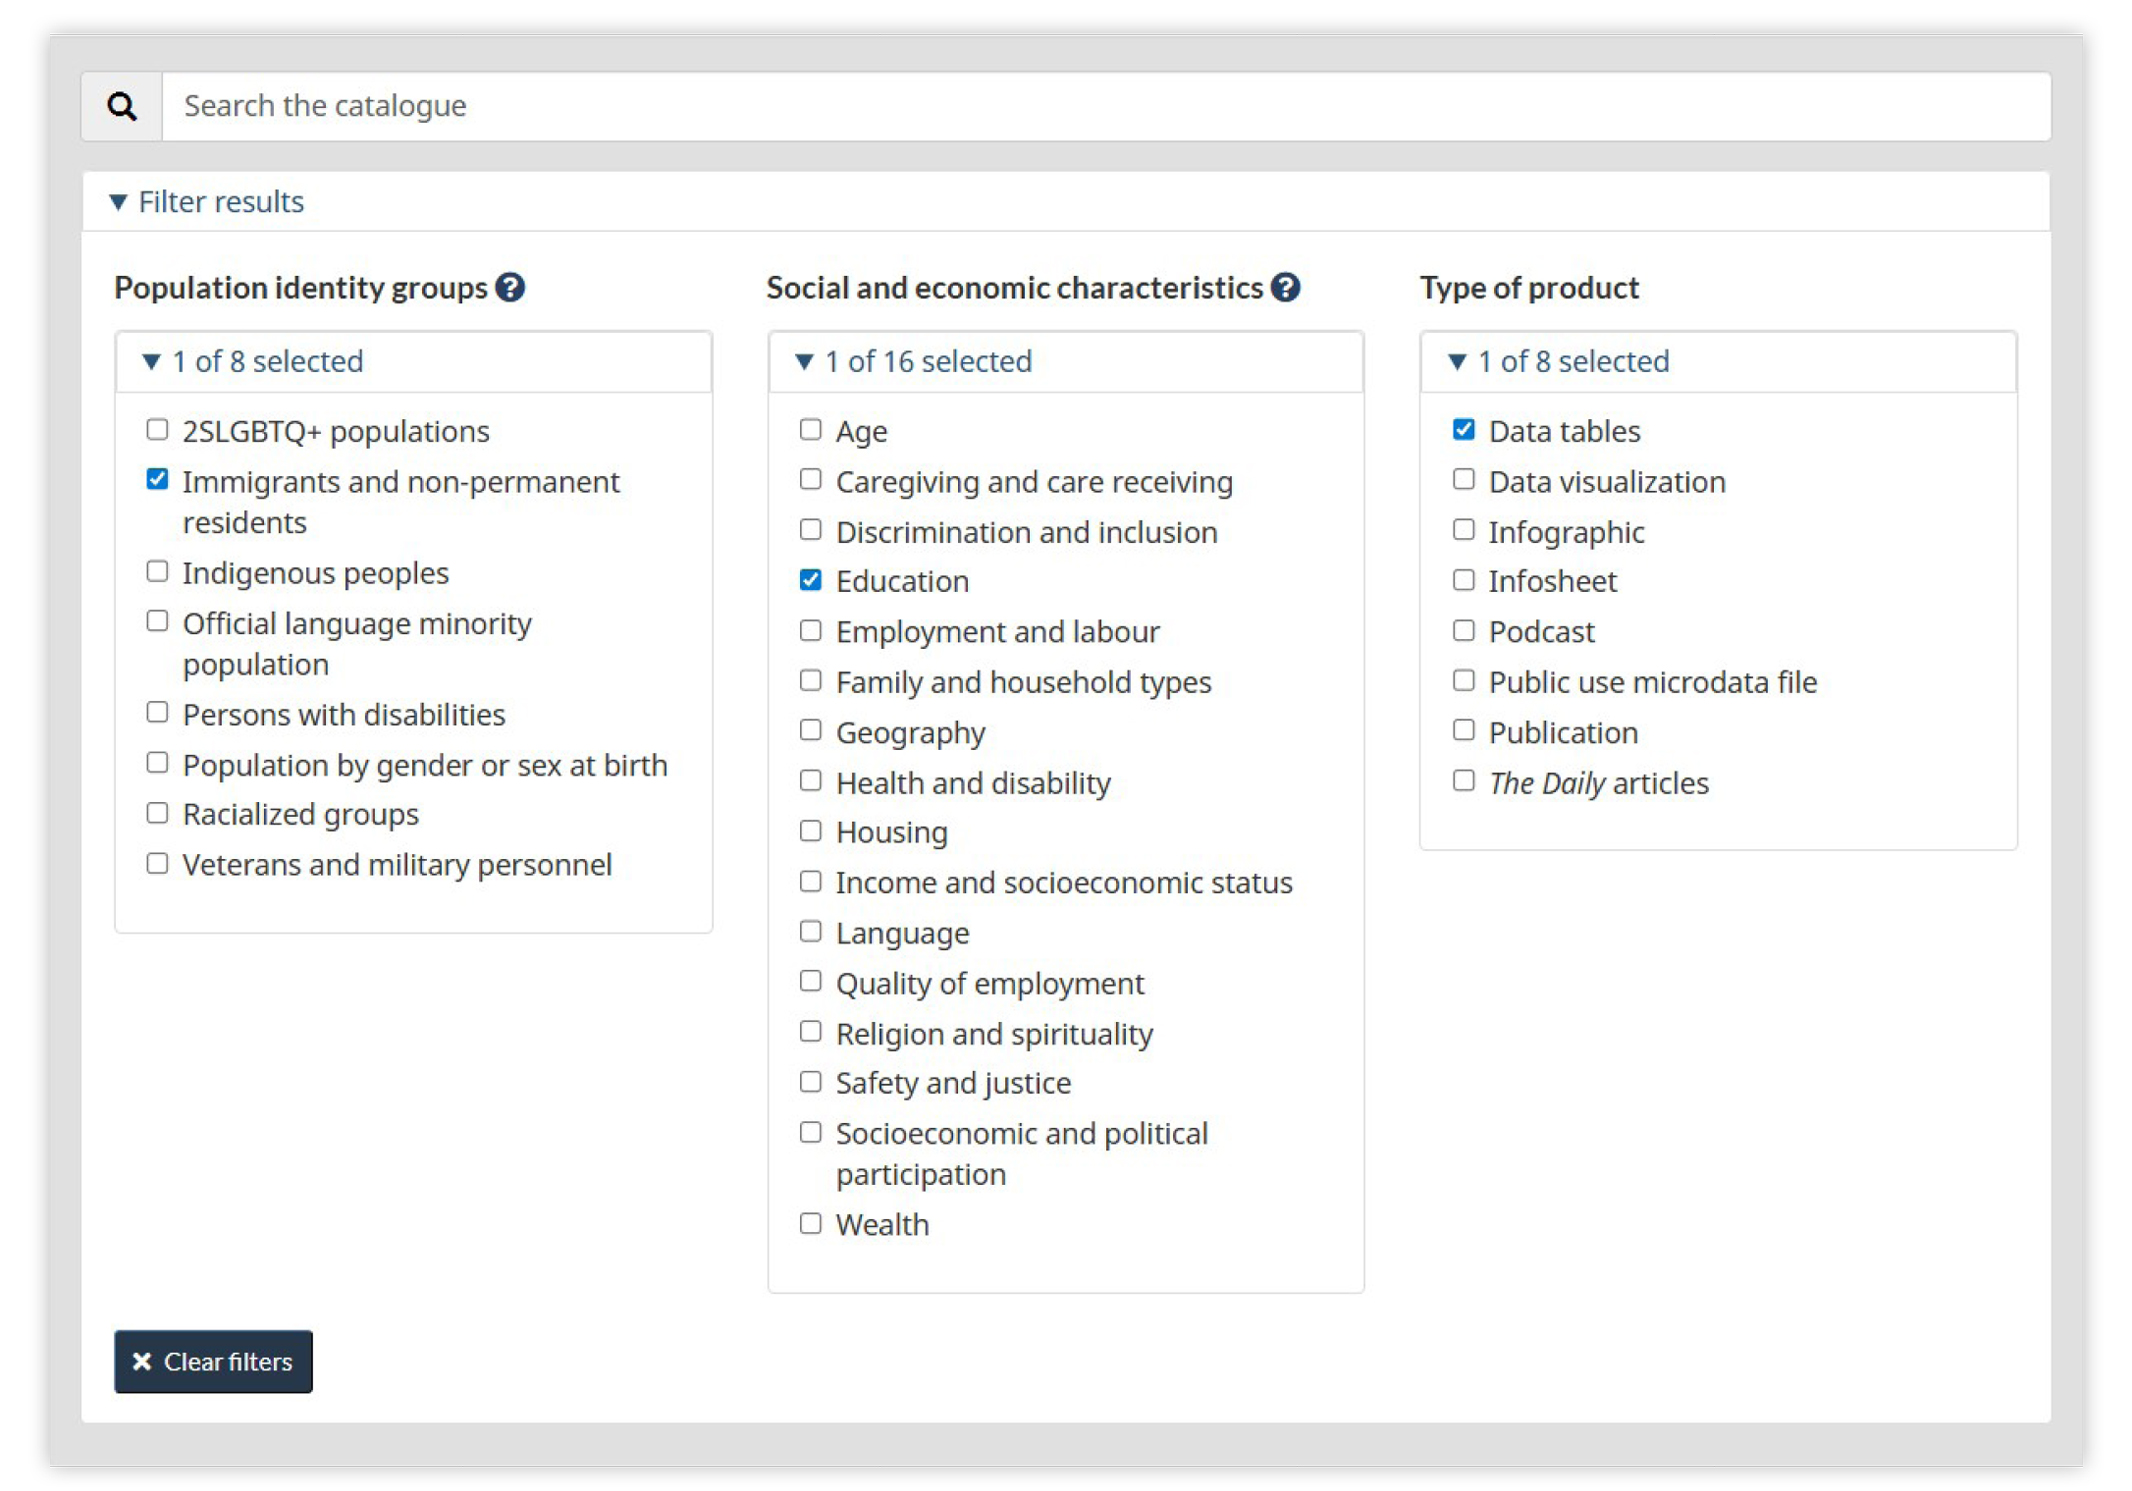
Figure 5 - Gender, Diversity and Inclusion Statistics catalogue filters
'Immigrants and non-permanent residents' is selected in the Population identity groups filter, 'Education' is selected in the social and economic characteristics filter and 'Data tables' is selected in the type of product filter.
Sign up to My StatCan to get updates in real-time.
- Date modified: