
Canada's Quality of Life Hub is currently in development. We need your help! If you have ideas or thoughts for what you'd like to see on the Hub, Statistics Canada would love to hear about it. Your input is invaluable as we continue to develop the Quality of Life Hub.

Future outlook
Indicator
Future outlook
Note: This indicator is a headline indicator. Headline indicators are intended to provide a high-level assessment of overall quality of life in Canada.
Description - Future outlook over time
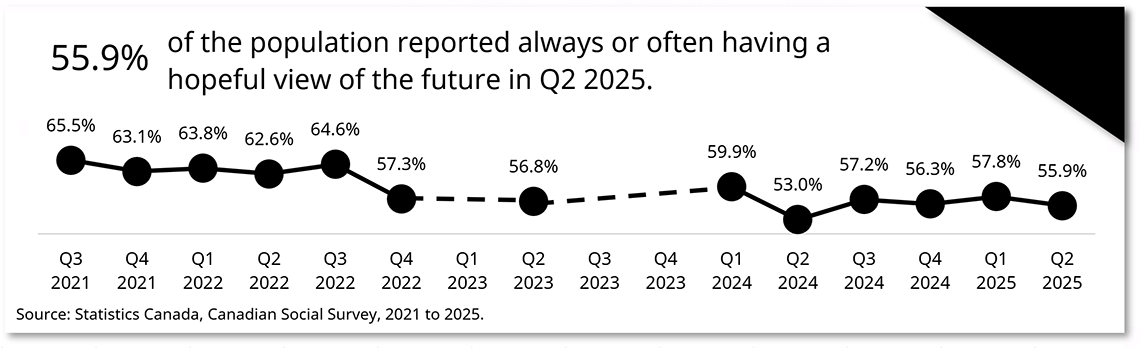
55.9% of the population reported always or often having a hopeful view of the future in Q2 2025.
| Always or often has a hopeful outlook | |
|---|---|
| Q3 2021 | 65.5% |
| Q4 2021 | 63.1% |
| Q1 2022 | 63.8% |
| Q2 2022 | 62.6% |
| Q3 2022 | 64.6% |
| Q4 2022 | 57.3% |
| Q1 2023 | .. |
| Q2 2023 | 56.8% |
| Q3 2023 | .. |
| Q4 2023 | .. |
| Q1 2024 | 59.9% |
| Q2 2024 | 53.0% |
| Q3 2024 | 57.2% |
| Q4 2024 | 56.3% |
| Q1 2025 | 57.8% |
| Q2 2025 | 55.9% |
| .. Not available for this reference period | |
Source: Statistics Canada, Canadian Social Survey, 2021 to 2025.
Definition
Proportion of the population by frequency of having a hopeful view of the future.
Measurement
This indicator is measured in the Canadian Social Survey (CSS), the Survey Series on People and their Communities (SSPC), Survey Series on First Nations People, Métis and Inuit (SSFNPMI) and in the General Social Survey (GSS) - Canadians at Work and Home.
In the CSS and SPCC, survey respondents are asked:
Thinking about your life in general, how often would you say you have a hopeful view of the future?
- Always
- Often
- Sometimes
- Rarely
- Never
In the GSS on Canadians at Work and Home, survey respondents are asked:
(How often would you say you:) have a hopeful view of the future?
- Always
- Often
- Sometimes
- Rarely
- Never
Data sources
Data tables and analysis
For products related to future outlook, including data tables, data visualizations, articles, and other product types see Analytical releases: Future outlook or view all analytical releases.
- Date modified: