
Canada's Quality of Life Hub is currently in development. We need your help! If you have ideas or thoughts for what you'd like to see on the Hub, Statistics Canada would love to hear about it. Your input is invaluable as we continue to develop the Quality of Life Hub.

Greenhouse gas emissions
Domain
Environment
Subdomain
Ecological integrity and environmental stewardship
Indicator
Greenhouse gas emissions
Note: This indicator is a headline indicator. Headline indicators are intended to provide a high-level assessment of overall quality of life in Canada.
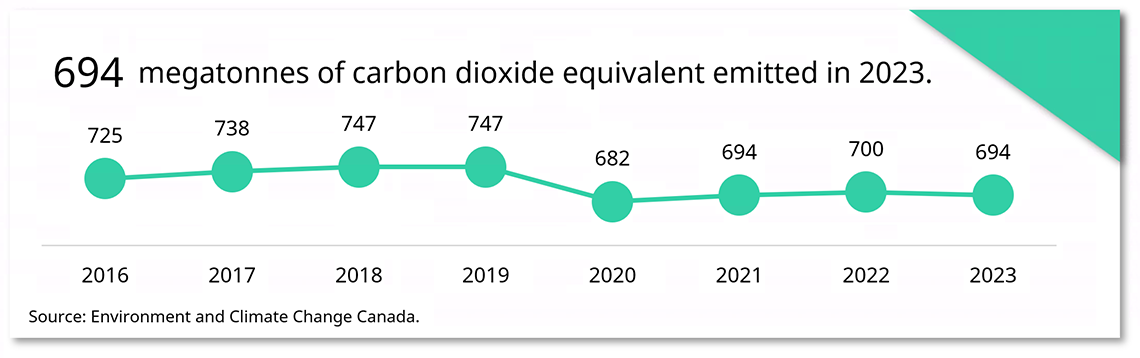
Description - Megatonnes of carbon dioxide equivalent emitted
| Megatonnes of carbon dioxide equivalent emitted | |
|---|---|
| 2016 | 727 |
| 2017 | 739 |
| 2018 | 749 |
| 2019 | 748 |
| 2020 | 681 |
| 2021 | 691 |
| 2022 | 696 |
| 2023 | 687 |
| 2024 | 685 |
Source: Environment and Climate Change Canada - Greenhouse gas emissions.
Definition
Historical greenhouse gas (GHG) emissions in megatonnes of carbon dioxide equivalent (CO2 eq) by region, by sector.
Measurement
This indicator shows trends in anthropogenic (human-made) greenhouse gas (GHG) emissions. Emissions are measured for 7 greenhouse gases (carbon dioxide, methane, nitrous oxide, sulphur hexafluoride, perfluorocarbons, hydrofluorocarbons and nitrogen trifluoride).
GHG emissions indicators are used to track the progress of Canada's efforts to lower emissions and reach environmental performance objectives. They also support decision making on sustainable development.
The emissions data are presented at the national level, at the provincial and territorial level, and by economic sector.
The indicators do not capture emissions from natural processes (for example, material decay, plant and animal respiration, volcanic and thermal venting), or the removal of emissions from the atmosphere by natural sinks (for example, forests, oceans).
For more information on this indicator, please refer to Greenhouse gas emissions from Environment and Climate Change Canada.
Data sources
For key results on greenhouse gas emissions at the national level, by economic sector, and by province and territory, please refer to Greenhouse gas emissions from Environment and Climate Change Canada.
Please also refer to Canada's official greenhouse gas inventory from Environment and Climate Change Canada.
Data tables and analysis
For products related to greenhouse gas emissions, including data tables, data visualizations, articles, and other product types see Analytical releases: Greenhouse gas emissions or view all analytical releases.
Frameworks
This indicator aligns with the following frameworks:
- Canadian Indicator Framework (CIF) for the Sustainable Development Goals
- Sustainable Development Goals (SDGs)
- SDG Goal 9 – Industry, innovation and infrastructure
- SDG Indicator 9.4.1 – Carbon dioxide (CO2) emission per unit of value added
- SDG Goal 13 – Climate action
- SDG Indicator 13.2.2 – Total greenhouse gas emissions per year
- SDG Goal 9 – Industry, innovation and infrastructure
- Federal Sustainable Development Strategy (FSDS)
- FSDS Goal 2 – Support a healthier and more sustainable food system
- FSDS Contextual Indicator – Greenhouse gas emissions from Canada's agriculture sector
- FSDS Goal 13 – Take action on climate change and its impacts
- FSDS Target Indicator – Greenhouse gas emissions
- FSDS Target Indicator – Greenhouse gas emissions projections
- FSDS Target Indicator – Percentage change in energy-related greenhouse gas emissions from facilities and conventional fleets relative to fiscal year 2005 to 2006
- FSDS Target Indicator – Percentage change in energy-related greenhouse gas emissions from national safety and security (NSS) fleets relative to fiscal year 2005 to 2006
- FSDS Contextual Indicator – Greenhouse gas concentrations
- FSDS Goal 2 – Support a healthier and more sustainable food system
- Canadian Environmental Sustainability Indicators (CESI)
Additional information
Greenhouse gases (GHGs) trap heat in the Earth's atmosphere, just as the glass of a greenhouse keeps warm air inside. Human activity increases the amount of GHGs in the atmosphere, contributing to a warming of the Earth's surface. This is called the enhanced greenhouse effect.
Over the past 200 years in particular, humans have released GHGs into the atmosphere primarily from burning fossil fuels. As a result, more heat is being trapped and the temperature of the planet is increasing. Sea levels are rising as the Arctic ice melts, and there are changes to the climate, such as more severe storms and heat waves. All of this impacts the environment, the economy and human health.
- Date modified: