
Canada's Quality of Life Hub is currently in development. We need your help! If you have ideas or thoughts for what you'd like to see on the Hub, Statistics Canada would love to hear about it. Your input is invaluable as we continue to develop the Quality of Life Hub.

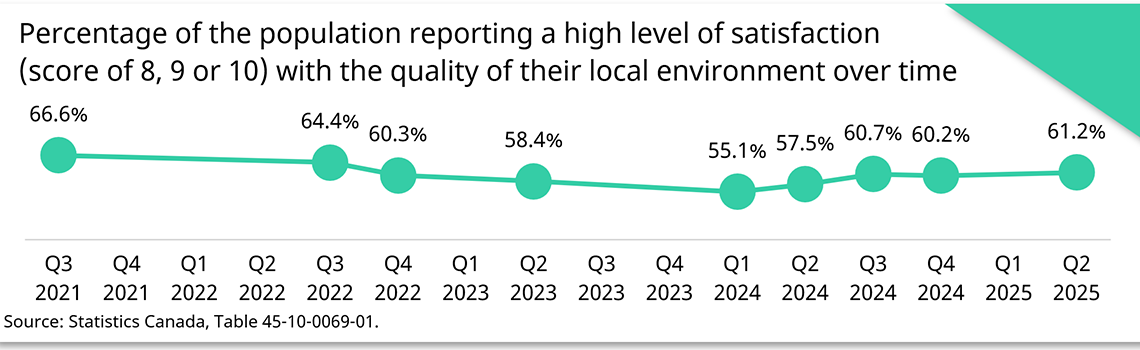
Satisfaction with local environment
Domain
Environment
Subdomain
Environment and people
Indicator
Satisfaction with local environment
Data table
| Percent | |
|---|---|
| Q3 2021 | 66.6% |
| Q4 2021 | .. |
| Q1 2022 | .. |
| Q2 2022 | .. |
| Q3 2022 | 64.4% |
| Q4 2022 | 60.3% |
| Q1 2023 | .. |
| Q2 2023 | 58.4% |
| Q3 2023 | .. |
| Q4 2023 | .. |
| Q1 2024 | 55.1% |
| Q2 2024 | 57.5% |
| Q3 2024 | 60.7% |
| Q4 2024 | 60.2% |
| Q1 2025 | .. |
| Q2 2025 | 61.2% |
.. Not available for this reference period
Source: Statistics Canada. Table 45-10-0069-01 Satisfaction with local environment, by gender and province
Definition
Proportion of the population by level of satisfaction with the quality of their local environment.
Measurement
This indicator is measured in selected iterations of the Canadian Social Survey (CSS) and the Survey Series on People and their Communities (SSPC). Survey respondents are asked:
On a scale from 0 to 10, where 0 means you feel "Not at all satisfied" and 10 means you are "Completely satisfied", how satisfied are you with the quality of your local environment such as access to green space, and air or water quality?
Data sources
Data tables and analysis
For products related to satisfaction with local environment, including data tables, data visualizations, articles, and other product types see Analytical releases: Satisfaction with local environment or view all analytical releases.
Frameworks
This indicator aligns with the following framework:
- Federal Sustainable Development Strategy (FSDS)
- FSDS Goal 11 – Improve access to affordable housing, clean air, transportation, parks, and green spaces, as well as cultural heritage in Canada
- FSDS Target Indicator – Number of visits at Parks Canada places
- FSDS Contextual Indicator – Visits to parks and public green spaces
- FSDS Goal 11 – Improve access to affordable housing, clean air, transportation, parks, and green spaces, as well as cultural heritage in Canada
- Date modified: