
Canada's Quality of Life Hub is currently in development. We need your help! If you have ideas or thoughts for what you'd like to see on the Hub, Statistics Canada would love to hear about it. Your input is invaluable as we continue to develop the Quality of Life Hub.

Incarceration rate
Domain
Good governance
Subdomain
Justice and human rights
Indicator
Incarceration rate
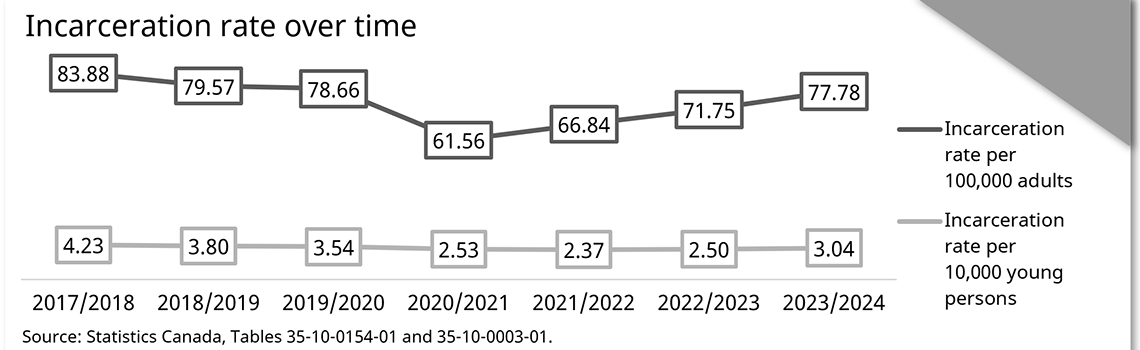
Description - Incarceration rate over time
| Incarceration rate per 100,000 adults | Incarceration rate per 10,000 young persons | |
|---|---|---|
| 2017/2018 | 83.88 | 4.23 |
| 2018/2019 | 79.57 | 3.80 |
| 2019/2020 | 78.66 | 3.54 |
| 2020/2021 | 61.56 | 2.53 |
| 2021/2022 | 66.84 | 2.37 |
| 2022/2023 | 71.75 | 2.50 |
| 2023/2024 | 77.78 | 3.04 |
Source: Statistics Canada. Table 35-10-0154-01 Average counts of adults in provincial and territorial correctional programs and Table 35-10-0003-01 Average counts of young persons in provincial and territorial correctional services
Definition
Incarceration rate per 100,000 adults and per 10,000 youth.
Measurement
Incarceration rates are based on total actual-in counts, as well as population estimates of adults (aged 18 years and older) and youth provided by Demography Division of Statistics Canada.
The total actual-in count represents persons held in custody under sentence, remand or who are otherwise legally required to be there and who are present at the time the count is taken.
Data sources
The following data sources also include adult or youth admissions to correctional services, though the data are the presented as the number of admissions and not as incarceration rates:
Data tables and analysis
For products related to incarceration rate, including data tables, data visualizations, articles, and other product types see Analytical releases: Incarceration rate or view all analytical releases.
Frameworks
This indicator aligns with the following frameworks:
- Date modified: