
Canada's Quality of Life Hub is currently in development. We need your help! If you have ideas or thoughts for what you'd like to see on the Hub, Statistics Canada would love to hear about it. Your input is invaluable as we continue to develop the Quality of Life Hub.

Perceived health
Domain
Health
Subdomain
Healthy people
Indicator
Perceived health
Note: This indicator is a headline indicator. Headline indicators are intended to provide a high-level assessment of overall quality of life in Canada.
Description - Perceived health over time
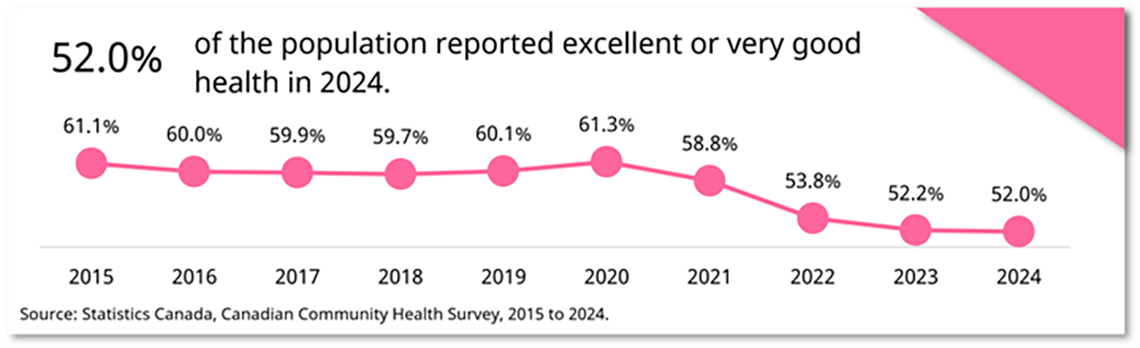
52.0% of the population reported excellent or very good health in 2024.
| Perceived health, very good or excellent | |
|---|---|
| 2015 | 61.1% |
| 2016 | 60.0% |
| 2017 | 59.9% |
| 2018 | 59.7% |
| 2019 | 60.1% |
| 2020 | 61.3% |
| 2021 | 58.8% |
| 2022 | 53.8% |
| 2023 | 52.2% |
| 2024 | 52.0% |
Source: Statistics Canada, Canadian Community Health Survey, 2015 to 2024.
Definition
Proportion of the population by perceived health.
Often reported as:
Proportion of the population reporting very good or excellent health.
Measurement
Perceived health is an indicator of overall health status. Perceived health refers to the perception of a person's health in general, either by the person themselves, or, in the case of proxy response, by the person responding to the survey questionnaire on behalf of the intended respondent. Health means not only the absence of disease or injury but also physical, mental and social well-being. Perceived health reflects aspects of health not captured in other measures, such as: incipient disease, disease severity, aspects of positive health status, physiological and psychological reserves and social and mental function.
This indicator is measured in a number of Statistics Canada surveys.
In the Canadian Community Health Survey – Annual Component (CCHS) and the Canadian Health Survey on Children and Youth (CHSCY), survey respondents are asked:
In general, how is your health?
- Excellent
- Very good
- Good
- Fair
- Poor
Data sources
This indicator is measured through multiple Statistics Canada surveys. Estimates can vary between data sources due to differences in reference periods, targeted or sampled populations, data collection and other methodology.
Surveys that measure this indicator include, but are not limited to:
- Canadian Community Health Survey - Annual Component (CCHS)
- Canadian Health Survey on Children and Youth (CHSCY)
- Canadian COVID-19 Antibody and Health Survey (CAHS)
- Canadian Health and COVID-19 Survey (CHCS)
- Canadian Health Measures Survey (CHMS)
- Canadian Housing Survey (CHS)
- Canadian Internet Use Survey (CIUS)
- Canadian Oral Health Survey (COHS)
- Canadian Sexual and Reproductive Health Survey (CSRHS)
- Canadian Social Survey (CSS)
- Canadian Survey on Disability (CSD)
- Canadian Veteran Health Survey (CVHS)
- General Social Survey (GSS) - Canadians at Work and Home
- General Social Survey (GSS) - Canadians' Safety (Victimization)
- General Social Survey (GSS) - Social Identity
- Impact of COVID-19 on Health Care Workers: Infection, Prevention, and Control (ICHCWIPC)
- Indigenous Peoples Survey (IPS)
- Mental Health and Access to Care Survey (MHACS)
- Survey of Safety in Public and Private Spaces (SSPPS)
- Survey on Health Care Access and Experiences – Primary and Specialist (SHCAE-PSC)
- Survey on Health Care Workers' Experiences During the Pandemic (SHCWEP)
- Survey on Access to Health Care and Pharmaceuticals During the Pandemic (SAHCPDP)
- Survey on Mental Health and Stressful Events (SMHSE)
- Survey Series on First Nations People, Métis and Inuit (SSFNPMI)
- Survey Series on People and their Communities (SSPC)
Data tables and analysis
For products related to perceived health, including data tables, data visualizations, articles, and other product types see Analytical releases: Perceived health or view all analytical releases.
Frameworks
This indicator aligns with the following frameworks:
- Canadian Indicator Framework (CIF) for the Sustainable Development Goals
- Social inclusion indicators for Canada's ethnocultural groups
- Health and well-being
- Perceived health, very good or excellent
- Perceived health, fair or poor
- Health and well-being
- Federal Sustainable Development Strategy (FSDS)
- FSDS Goal 3 – Support mental health and adopt healthy behaviours
- FSDS Contextual Indicator – Percentage of Canadians who perceived their overall health and social well-being as very good to excellent
- FSDS Goal 3 – Support mental health and adopt healthy behaviours
- Date modified: