
Canada's Quality of Life Hub is currently in development. We need your help! If you have ideas or thoughts for what you'd like to see on the Hub, Statistics Canada would love to hear about it. Your input is invaluable as we continue to develop the Quality of Life Hub.

Wages
Domain
Prosperity
Subdomain
Employment and job quality
Indicator
Wages
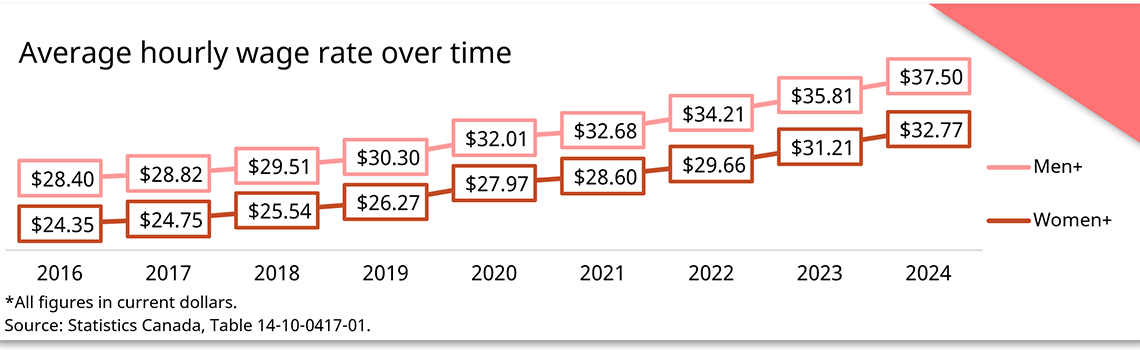
Description - Average hourly wage rate by gender
| Average hourly wage rate (current dollars) | ||
|---|---|---|
| Men+ | Women+ | |
| 2015 | $27.82 | $23.86 |
| 2016 | $28.40 | $24.35 |
| 2017 | $28.82 | $24.75 |
| 2018 | $29.51 | $25.54 |
| 2019 | $30.30 | $26.27 |
| 2020 | $32.01 | $27.97 |
| 2021 | $32.68 | $28.60 |
| 2022 | $34.21 | $29.66 |
| 2023 | $35.81 | $31.21 |
| 2024 | $37.50 | $32.77 |
| 2025 | $38.64 | $34.04 |
*All figures in current dollars.
Source: Statistics Canada, Table 14-10-0417-01 Employee wages by occupation, annual
Definition
Hourly wage rate.
Measurement
This indicator is measured in the Labour Force Survey (LFS).
Survey respondents are asked to report their wage/salary before taxes and other deductions, and include tips, commissions and bonuses. Hourly wages/salaries are calculated in conjunction with usual paid hours per week. Data on hourly wages are available on a monthly and annual basis through the LFS as well as by occupation and industry.
Data are based on employees only, and therefore earnings from self-employed workers are omitted.
For more information on measurement of this indicator in the LFS, please refer to Guide to the Labour Force Survey.
Data sources
Data tables and analysis
For products related to wages, including data tables, data visualizations, articles, and other product types see Analytical releases: Wages or view all analytical releases.
Frameworks
This indicator aligns with the following frameworks:
- Sustainable Development Goals (SDG)
- SDG Goal 8 – Decent work and economic growth
- SDG Indicator 8.5.1 – Average hourly earnings of employees, by sex, age, occupation and persons with disabilities
- SDG Goal 8 – Decent work and economic growth
- Social inclusion indicators for Canada's ethnocultural groups
- Income and wealth
- Average weekly earnings of full-time employees
- Income and wealth
- Gender Results Framework (GRF)
- Economic participation and prosperity
- GRF Indicator 2.2.1 – Gender gap in median hourly wages
- GRF Indicator 2.2.2 – Gender gap in average hourly wages
- Economic participation and prosperity
- Canadian Poverty Reduction Strategy
- Median hourly wage
- Date modified: