
Canada's Quality of Life Hub is currently in development. We need your help! If you have ideas or thoughts for what you'd like to see on the Hub, Statistics Canada would love to hear about it. Your input is invaluable as we continue to develop the Quality of Life Hub.

Someone to count on
Domain
Society
Subdomain
Social cohesion and connections
Indicator
Someone to count on
Note: This indicator is a headline indicator. Headline indicators are intended to provide a high-level assessment of overall quality of life in Canada.
Description - Someone to count on over time
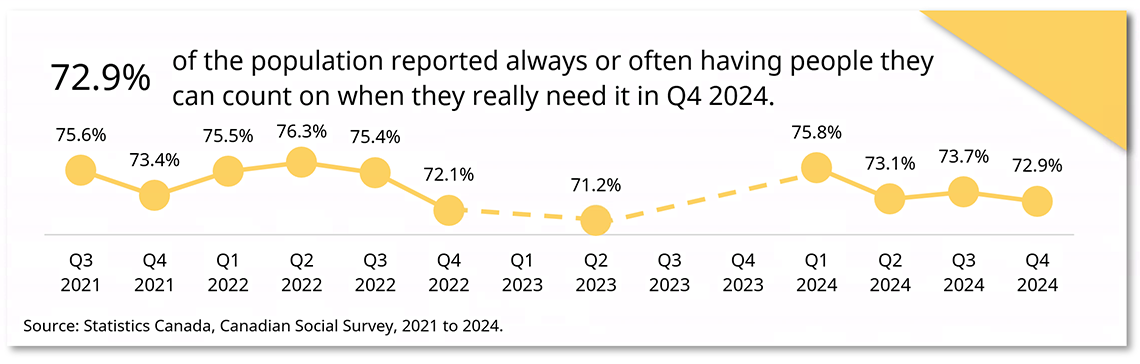
72.9% of the population reported that they often or always have people they can depend on when they really need it in Q4 2024.
| Often or always have people to depend on | |
|---|---|
| Q3 2021 | 75.6% |
| Q4 2021 | 73.4% |
| Q1 2022 | 75.5% |
| Q2 2022 | 76.3% |
| Q3 2022 | 75.4% |
| Q4 2022 | 72.1% |
| Q1 2023 | .. |
| Q2 2023 | 71.2% |
| Q3 2023 | .. |
| Q4 2023 | .. |
| Q1 2024 | 75.8% |
| Q2 2024 | 73.1% |
| Q3 2024 | 73.7% |
| Q4 2024 | 72.9% |
| .. Not available for this reference period | |
Source: Statistics Canada, Canadian Social Survey, 2021 to 2024.
Definition
Proportion of the population by frequency with which they have people they can depend on to help them when they really need it.
Measurement
This indicator is measured in the Canadian Social Survey (CSS), the Survey Series on People and their Communities (SSPC), and in the General Social Survey (GSS) - Canadians at Work and Home.
In the CSS and the SSPC, survey respondents are asked:
How often would you say you have people you can depend on to help you when you really need it?
- Always
- Often
- Sometimes
- Rarely
- Never
The Canadian Community Health Survey (CCHS) asks a similar question to determine whether or not respondents have someone they can count on in an emergency:
There are people I can count on in an emergency:
- Strongly agree
- Agree
- Disagree
- Strongly disagree
Data sources
This indicator is measured through multiple Statistics Canada surveys. Estimates can vary between data sources due to differences in reference periods, targeted or sampled populations, data collection and other methodology.
Data tables and analysis
For products related to someone to count on, including data tables, data visualizations, articles, and other product types see Analytical releases: Someone to count on or view all analytical releases.
Frameworks
This indicator aligns with the following framework:
- Social inclusion indicators for Canada's ethnocultural groups
- Social connections and personal networks
- Having no one in the local personal network (close relatives and close friends)
- Having 1 to 14 people in the local personal network (close relatives and close friends)
- Having 15 or more people in the local personal network (close relatives and close friends)
- Feeling close to 4 relatives or less
- Feeling close to 5 relatives or more
- Having 4 close friends or less
- Having 5 close friends or more
- Social connections and personal networks
- Date modified: