
Canada's Quality of Life Hub is currently in development. We need your help! If you have ideas or thoughts for what you'd like to see on the Hub, Statistics Canada would love to hear about it. Your input is invaluable as we continue to develop the Quality of Life Hub.

Loneliness
Domain
Society
Subdomain
Social cohesion and connections
Indicator
Loneliness
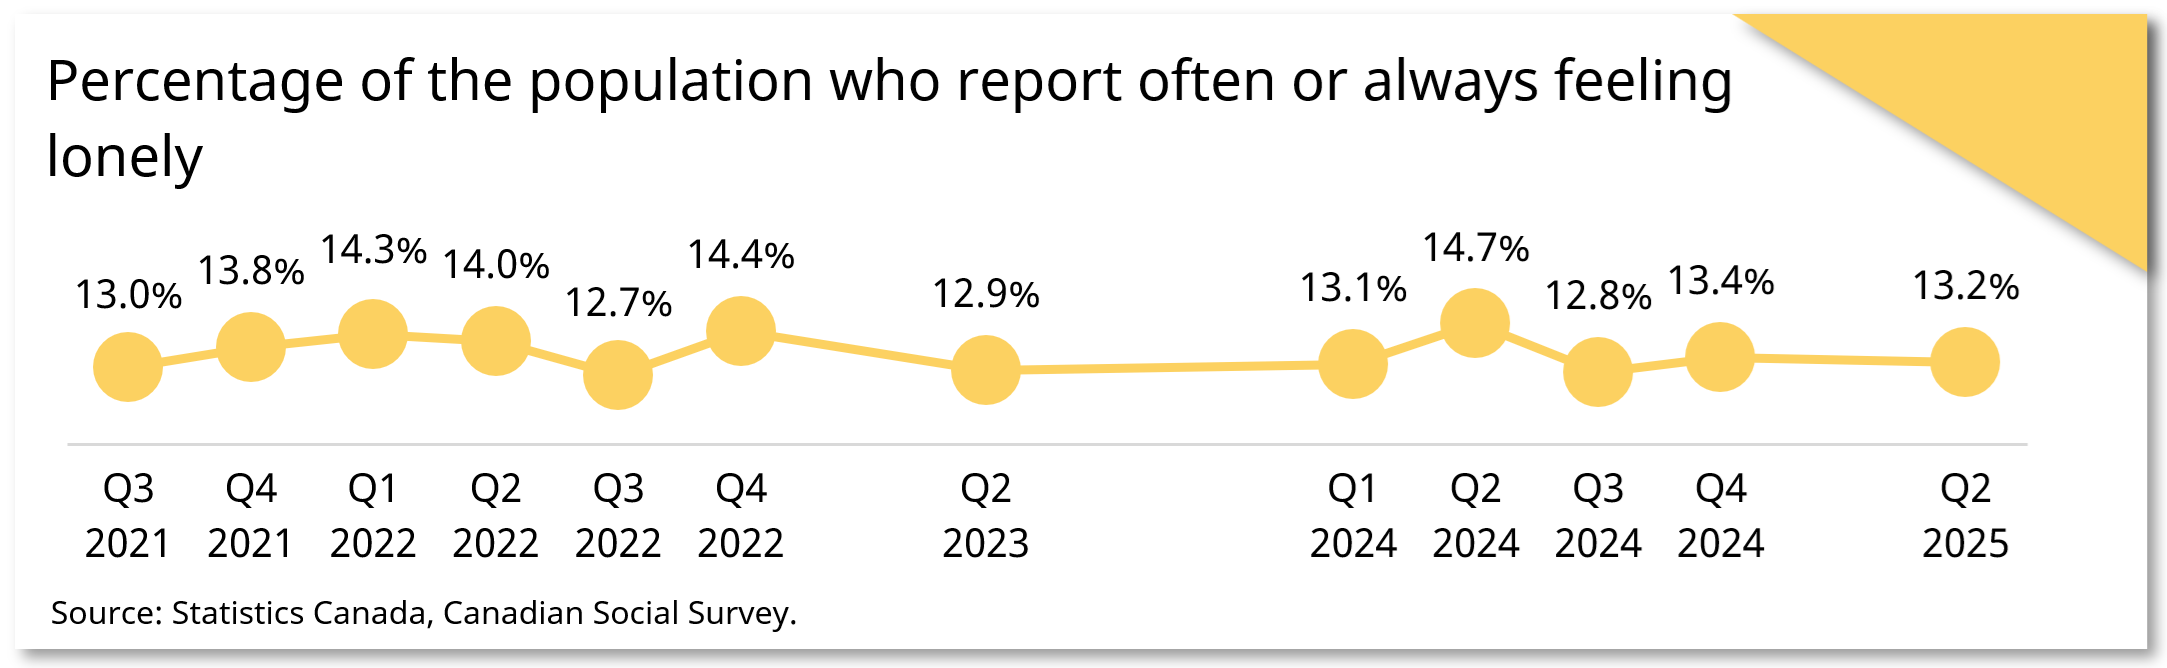
Data Table
| Percent | |
|---|---|
| Q3 2021 | 13.0% |
| Q4 2021 | 13.8% |
| Q1 2021 | 14.3% |
| Q2 2022 | 14.0% |
| Q3 2023 | 12.7% |
| Q4 2022 | 14.4% |
| Q1 2023 | .. |
| Q2 2023 | 12.9% |
| Q3 2023 | .. |
| Q4 2023 | .. |
| Q1 2024 | 13.1% |
| Q2 2024 | 14.7% |
| Q3 2024 | 12.8% |
| Q4 2024 | 13.4% |
| Q1 2025 | .. |
| Q2 2025 | 13.2% |
.. Not available for this reference period
Source: Statistics Canada, Canadian Social Survey.
Definition
Proportion of the population by frequency of feeling lonely.
Measurement
This indicator is measured in the Canadian Social Survey (CSS) and the Survey Series on People and their Communities (SSPC). Survey respondents are asked:
How often do you feel lonely?
- Always
- Often
- Sometimes
- Rarely
- Never
Data sources
Data tables and analysis
For products related to loneliness, including data tables, data visualizations, articles, and other product types see Analytical releases: Loneliness or view all analytical releases.
- Date modified: