
Canada's Quality of Life Hub is currently in development. We need your help! If you have ideas or thoughts for what you'd like to see on the Hub, Statistics Canada would love to hear about it. Your input is invaluable as we continue to develop the Quality of Life Hub.

Time use
Domain
Society
Subdomain
Time use
Indicator
Time use
Description - Average number of hours per day spent on certain activities, by gender
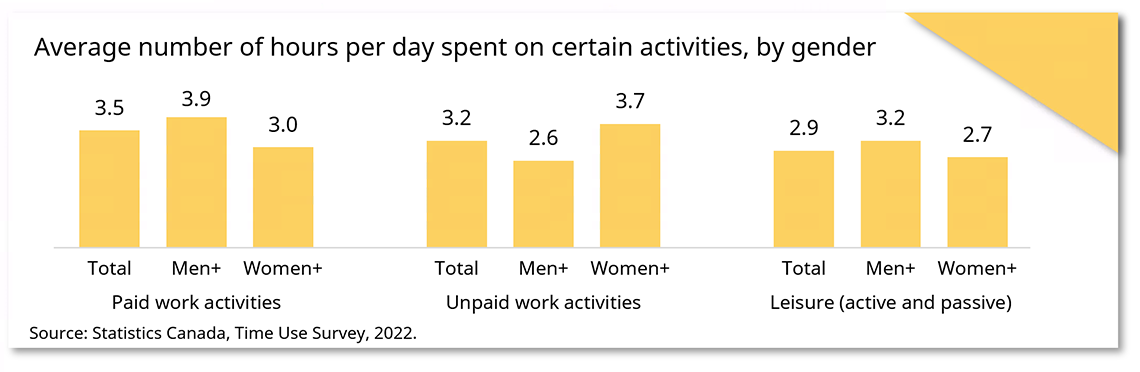
Average number of hours per day spent on certain activities, by gender
| Paid work activities | Unpaid work activities | Leisure (active and passive) | |
|---|---|---|---|
| Total | 3.5 | 3.2 | 2.9 |
| Men+ | 3.9 | 2.6 | 3.2 |
| Women+ | 3 | 3.7 | 2.7 |
Source: Statistics Canada, Time Use Survey, 2022.
Definition
Distribution of the hours in a person's day spent doing various activities.
Measurement
This indicator is measured in the Time Use Survey. This survey employs a retrospective 24-hour time diary to collect information on respondents' participation in, and time spent on, a wide variety of day-to-day activities, lasting at least 5 minutes. Information is also collected on the location that these activities occurred and the people who were with the respondent at the time of the activity.
Data sources
Data tables and analysis
For products related to time use, including data tables, data visualizations, articles, and other product types see Analytical releases: Time use or view all analytical releases.
Frameworks
This indicator aligns with the following frameworks:
- Canadian Indicator Framework (CIF) for the Sustainable Development Goals
- Gender Results Framework (GRF)
- Economic participation and prosperity
- GRF Indicator 2.4.1 – Proportion of time spent on unpaid domestic and care work
- Economic participation and prosperity
- Date modified: