
To commemorate Women's History Month, this infographic uses data from a number of Statistics Canada sources to highlight some of the achievements of women in Canada (e.g., educational attainment, representation in certain occupations and in leadership positions).
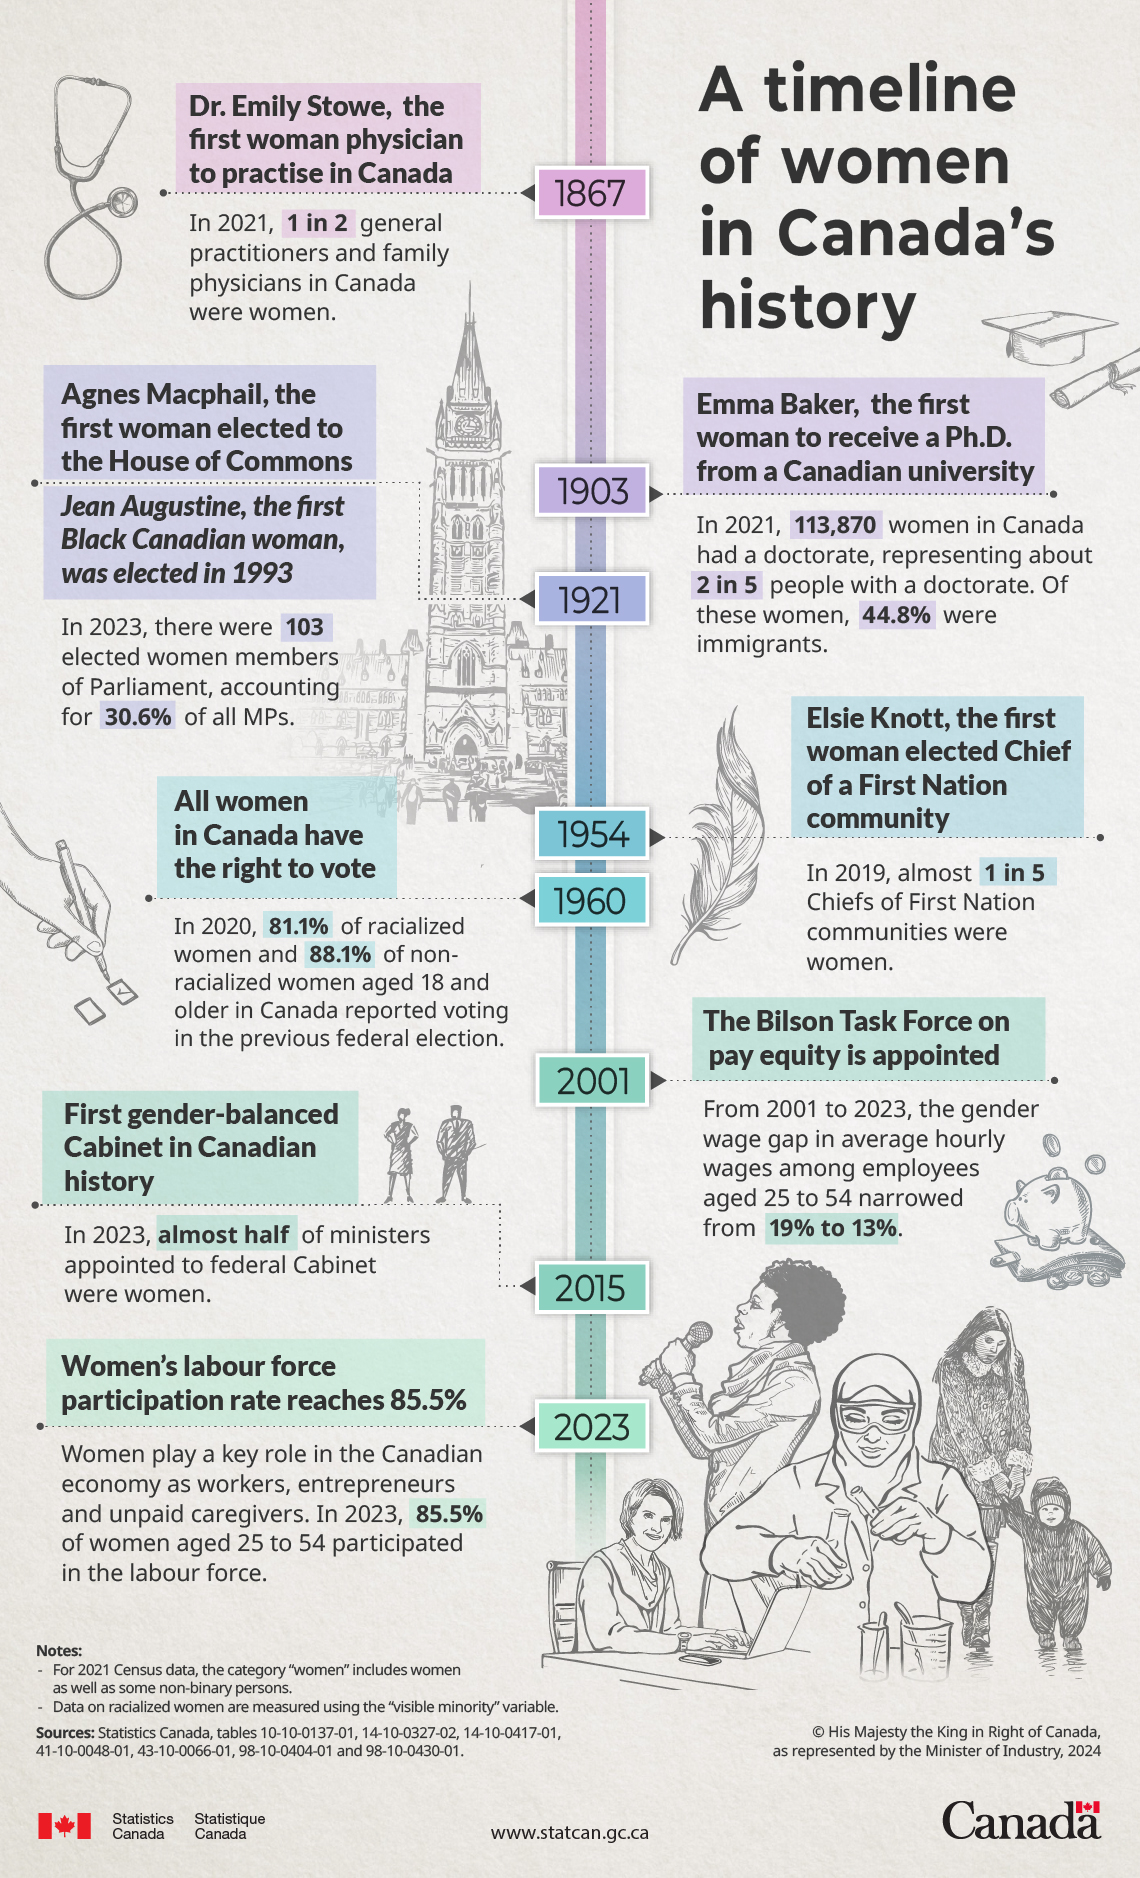
Description - A timeline of women in Canada's history
1867: Dr. Emily Stowe, the first woman physician to practise in Canada
- In 2021, 1 in 2 general practitioners and family physicians in Canada were women.
1903: Emma Baker, the first woman to receive a Ph.D. from a Canadian university
- In 2021, 113,870 women in Canada had a doctorate, representing about 2 in 5 people with a doctorate. Of these women, 44.8% were immigrants.
1921: Agnes Macphail, the first woman elected to the House of Commons
Jean Augustine, the first Black Canadian woman, was elected in 1993
- In 2023, there were 103 elected women members of Parliament, accounting for 30.6% of all MPs.
1954: Elsie Knott, the first woman elected Chief of a First Nation community
- In 2019, almost 1 in 5 Chiefs of First Nation communities were women.
1960: All women in Canada have the right to vote
- In 2020, 81.1% of racialized women and 88.1% of non-racialized women aged 18 and older in Canada reported voting in the previous federal election.
2001: The Bilson Task Force on pay equity is appointed
- From 2001 to 2023, the gender wage gap in average hourly wages among employees aged 25 to 54 narrowed from 19% to 13%.
2015: First gender-balanced Cabinet in Canadian history
- In 2023, almost half of ministers appointed to federal Cabinet were women.
2023: Women’s labour force participation rate reaches 85.5%
- Women play a key role in the Canadian economy as workers, entrepreneurs and unpaid caregivers. In 2023, 85.5% of women aged 25 to 54 participated in the labour force.
Notes:
- For 2021 Census data, the category “women” includes women as well as some non-binary persons.
- Data on racialized women are measured using the “visible minority” variable.
Sources: Statistics Canada, tables 10-10-0137-01, 14-10-0327-02, 14-10-0417-01, 41-10-0048-01, 43-10-0066-01, 98-10-0404-01 and 98-10-0430-01.
Contact information
For more information, or to enquire about the concepts, methods or data quality of this release, contact us (toll-free 1-800-263-1136; 514-283-8300; infostats@statcan.gc.ca) or Media Relations (statcan.mediahotline-ligneinfomedias.statcan@statcan.gc.ca).
Type
New Data
Off